. 2019 Nov;20(11):1435-1443.
doi: 10.1038/s41590-019-0493-z. Epub 2019 Oct 7.

House dust mites activate nociceptor-mast cell clusters to drive type 2 skin inflammation

Affiliations

House dust mites activate nociceptor-mast cell clusters to drive type 2 skin inflammation

Nadine Serhan et al. Nat Immunol. 2019 Nov.

Abstract

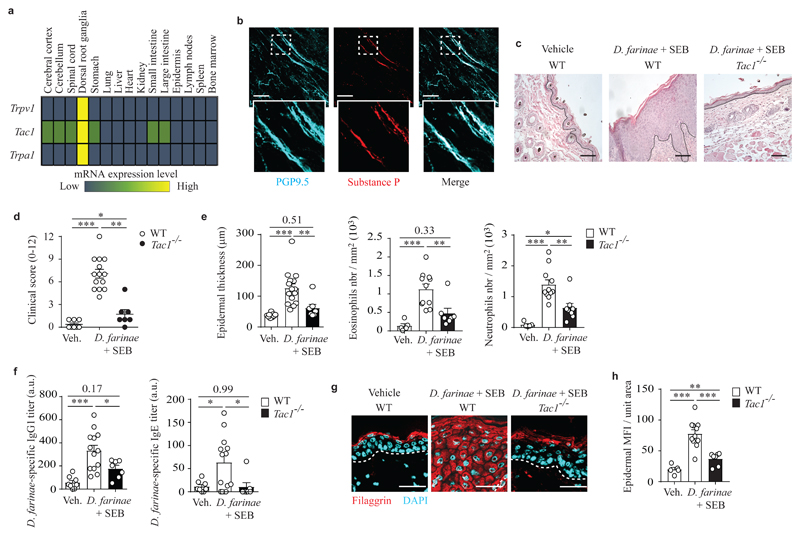
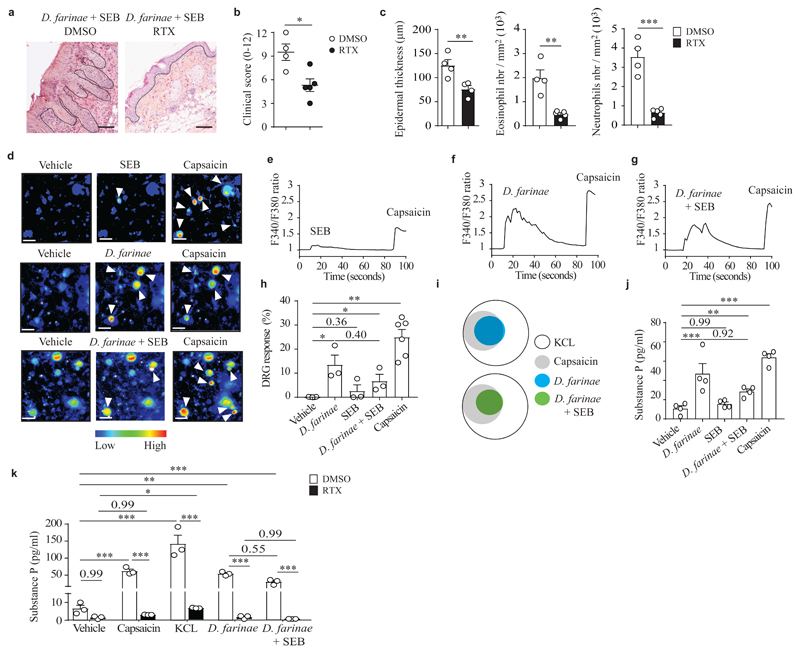
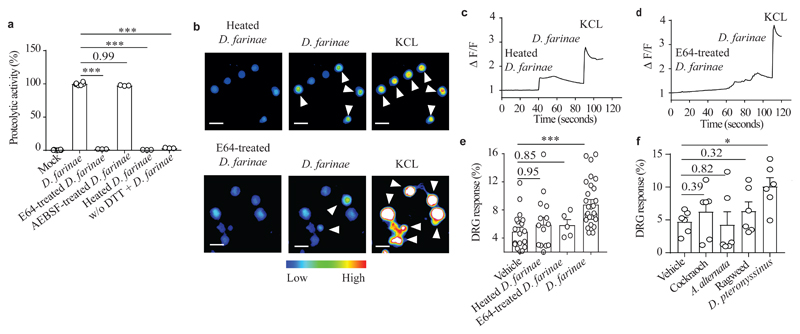
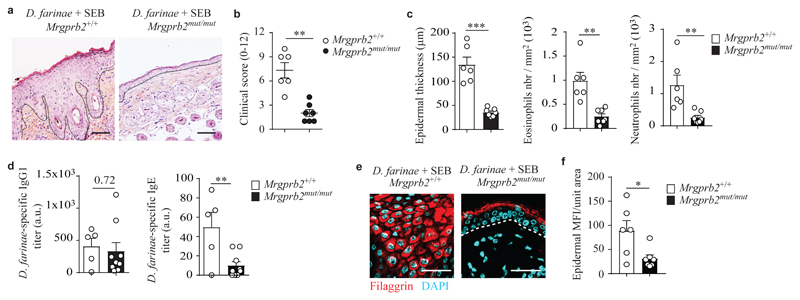
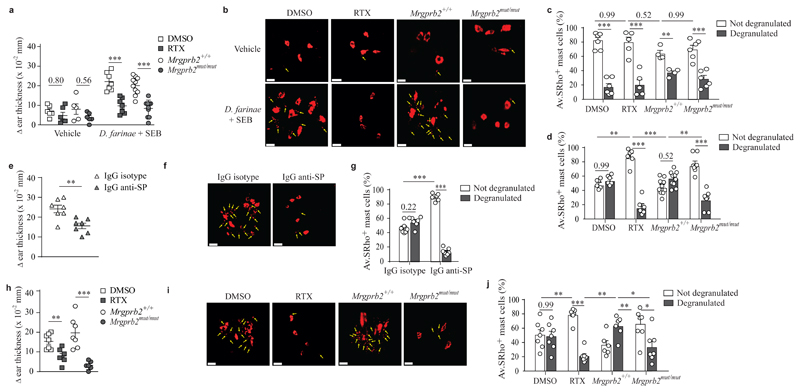
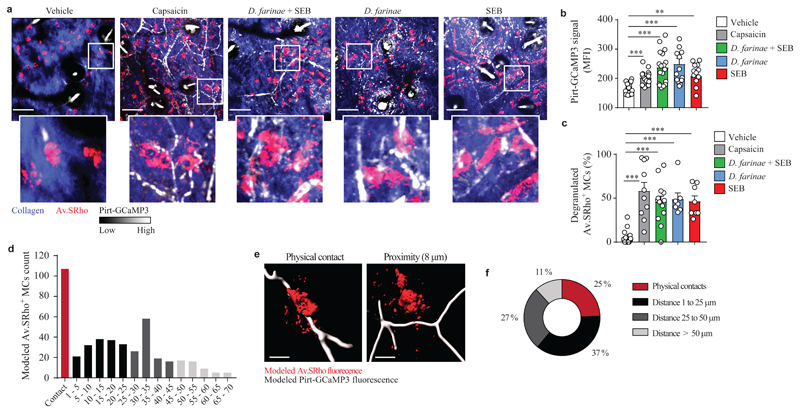
Allergic skin diseases, such as atopic dermatitis, are clinically characterized by severe itching and type 2 immunity-associated hypersensitivity to widely distributed allergens, including those derived from house dust mites (HDMs). Here we found that HDMs with cysteine protease activity directly activated peptidergic nociceptors, which are neuropeptide-producing nociceptive sensory neurons that express the ion channel TRPV1 and Tac1, the gene encoding the precursor for the neuropeptide substance P. Intravital imaging and genetic approaches indicated that HDM-activated nociceptors drive the development of allergic skin inflammation by inducing the degranulation of mast cells contiguous to such nociceptors, through the release of substance P and the activation of the cationic molecule receptor MRGPRB2 on mast cells. These data indicate that, after exposure to HDM allergens, activation of TRPV1+Tac1+ nociceptor-MRGPRB2+ mast cell sensory clusters represents a key early event in the development of allergic skin reactions.


Conflict of interest statement

Competing interests

The authors declare no competing interests.

Figures

Figure 1
Figure 1. Tac1 gene expression is required for the full development of pathological features in a model of allergic skin inflammation.
a, Publicly available microarray gene expression data of Trpv1, Tac1 and Trpa1 in different mouse tissues (GSE 10246); data are shown using a heat map of mRNA expression levels. b, Representative 3D confocal microscopy picture of whole-mounted normal back skin stained for PGP9.5 (a pan neuronal marker, cyan) and substance P (red). c, Representative hematoxylin & eosin (H&E) staining of vehicle- or D. farinae + SEB-treated areas in WT or Tac1-/- mice. d, Clinical scores (0-12) of vehicle- or D. farinae + SEB-treated areas in WT or Tac1-/- mice treated as in c. e, Epidermal thickness (μm) (left), number of eosinophils (middle) and neutrophils (right) in skin sections in WT or Tac1-/- mice treated as in c. f, Serum levels (arbitrary unit [a.u]) of D. farinae-specific IgG1 (left) and IgE (right) antibodies in vehicle- or D. farinae + SEB-treated WT or Tac1-/- mice as in c. g,h, Representative confocal microscopy pictures of back skin sections (g) and fluorescence analysis (h) of filaggrin staining in the epidermis of vehicle- or D. farinae + SEB-treated areas in WT or Tac1-/- mice treated as in c. Bars = 100 μm, dotted black (c) or white (g) lines indicate the junction epidermis/dermis. Each circle = one mouse. Number of mice: (b) n = 3; (c-h) n = 6 (WT Vehicle), n = 14 (WT D. farinae + SEB), n = 7 (Tac1-/-). (e,f,h) Open bars: WT mice; black bars: Tac1-/- mice. (b-h) Data from three independent experiments, mean ± SEM (d), mean + SEM (e,f,h); 1-way ANOVA with Tukey’s test for multiple comparisons, *P<.05 **P<.01 ***P<.001.
Figure 2
Figure 2. TRPV1+ nociceptors are required for the full development of allergic skin inflammation and D. farinae extracts directly induce neuronal activation.
a, Representative H&E staining of D. farinae + SEB-treated areas in mock (dimethylsulphoxide [DMSO])-treated or RTX-treated (TRPV1+ nociceptor ablated) mice. b, Clinical scores (0-12) of D. farinae + SEB-treated areas in DMSO- or RTX-treated mice as in a. c, Epidermal thickness (μm) (left), number of eosinophils (middle) and neutrophils (right) of D. farinae + SEB-treated areas in DMSO- or RTX-treated mice as in a. Number of mice: (a-c) n = 4 (DMSO) and n = 5 (RTX); data are from two independent experiments; mean + SEM, two-tailed, unpaired t-test, *P<.05 **P<.01 ***P<.001. d-h, Representative Fura-2 ratiometric fields (d), associated calcium traces (e-g) and (h) proportion of responding DRG neurons (%) of ex vivo cultured DRG neurons (expressed as % of DRG neurons responding to 50 mM KCL) stimulated with 5 ng/ml SEB (top d,e,h) or 5 ng/ml D. farinae (middle d,f,h) or both (bottom d,g,h) and 1 μM capsaicin (d-h). (d) Bars = 50 μm, white arrow heads indicate neurons with increased Fura-2 fluorescence. (d-h) Data are from three independent experiments performed with DRGs from n = 3 (for the condition of vehicle-, D. farinae, SEB or D. farinae + SEB-treated DRG neurons) and n = 6 (for the condition of capsaicin-treated DRG neurons) different mice; mean + SEM, two-tailed, unpaired t-test, *P<.05 **P<.01. i, Venn diagrams of responding DRG neurons. j,k, Substance P secretion in DRG neurons cultured ex vivo from (j) WT mice, (k) DMSO (open bars)- versus RTX (black bars)-treated mice and stimulated as indicated. Data are from (j) 4 and (k) 3 independent experiments, mean + SEM, two-tailed, unpaired t-test, *P<.05 **P<.01 ***P<.001. Each circle = one mouse.
Figure 3
Figure 3. Activation of DRG neurons by D. farinae extract depends on cysteine protease activity.
a, Protease activity in D. farinae extracts heat inactivated at 95°C for 60 minutes (Heated), or treated with cysteine- (E64, 100 nM) or serine- (AEBSF, 1 mM) protease inhibitors, with or without dithiothreitol (DTT). Data are from three independent experiments performed with three independent biological samples, mean + SEM, One way ANOVA and Holm-Sidak’s post- hoc test, *** P<.001. b-e, Representative Fura-2 ratiometric fields (b), associated calcium traces (c,d) and (e) proportion of responding DRG neurons (%) in ex vivo cultured DRG neurons (expressed as % of DRG neurons responding to 50 mM KCL) stimulated sequentially with 5 ng/ml heated D. farinae (top b,c) or 5 ng/ml E64 (2.5 pM)-treated D. farinae (bottom b,d), 5 ng/ml D. farinae and 50 mM KCL. Data are from five independent experiments performed with 22 (for the conditions Vehicle and D. farinae), 14 (for the condition Heated D. farinae) and 5 (for the condition E64-treated D. farinae) independent experiments performed with independent biological samples, mean + SEM, two-tailed, unpaired t-test, ***P<.001. f, Proportion of responding DRG neurons stimulated with either Vehicle, 5 ng/ml D. pteronyssinus, 5 ng/ml German cockroach, 5 ng/ml A. alternata, or 5 ng/ml ragweed expressed as % of DRG neurons responding to 50 mM KCL. Data are from six independent experiments performed with six independent biological samples, mean + SEM, two-tailed, unpaired t-test, *P<.05. Each circle = one mouse.
Figure 4
Figure 4. Genetic inactivation of MRGPRB2 largely prevents development of pathology in a model of allergic skin inflammation.
a, Representative H&E staining of D. farinae + SEB-treated areas in Mrgprb2mut/mut and Mrgprb2+/+ mice; dotted black lines indicate the junction epidermis/dermis. b, Clinical scores (0-12) of D. farinae + SEB-treated areas in Mrgprb2mut/mut and Mrgprb2+/+ mice as in a. c, Epidermal thickness (μm) (left), number of eosinophils (middle) and neutrophils (right) in D. farinae + SEB-treated areas in Mrgprb2mut/mut and Mrgprb2+/+ mice treated as in a. d, Serum levels (arbitrary unit [a.u]) of D. farinae-specific IgG1 (left) and IgE (right) antibodies of D. farinae + SEB-treated Mrgprb2mut/mut and Mrgprb2+/+ mice as in a. e,f, Representative confocal microscopy of back skin section (e) and fluorescence analysis (f) of filaggrin staining of D. farinae + SEB-treated areas in Mrgprb2mut/mut and Mrgprb2+/+ mice as in a. White lines indicate the junction epidermis/dermis. Bars = 100 μm. Each open circle = one mouse. Number of mice: (a-c,e,f) n = 6 (Mrgprb2+/+), n = 7 (Mrgprb2mut/mut); (d) n = 5 (Mrgprb2+/+), n = 9 (Mrgprb2mut/mut). Mean ± SEM (b), mean + SEM (c,d,f), two-tailed, unpaired t-test, *P<.05 **P<.01 ***P<.001.
Figure 5
Figure 5. Sensory neurons, MRGPRB2 and substance P are required to trigger in vivo mast cell degranulation and associated skin swelling in response to D. farinae and SEB antigens.
a, Changes (Δ) in ear thickness 45 minutes after i.d. injection of vehicle or D. farinae + SEB in DMSO-treated (open squares), RTX-treated (grey squares), Mrgprb2+/+ (open circles) or Mrgprb2mu/mut (grey circles) mice. b, 3D representative confocal microscopy pictures of Av.SRho fluorescent signal (red) in whole-mounted ears in mice treated as in a. c, Quantification of not degranulated (i.e., lacking exteriorized granules, white bars) or degranulated mast cells (i.e., presence of exteriorized Av.SRho+ granule structures, indicated with yellow arrows in b and grey bars) in DMSO-treated, RTX-treated, Mrgprb2+/+ or Mrgprb2mu/mut mice 45 minutes after i.d. injection of vehicle. d, Same experiment as in c but 45 minutes after i.d. injection of D. farinae + SEB. e, Changes (Δ) in ear thickness 45 minutes after i.d. injection of D. farinae + SEB with IgG control isotype (open triangles) or with IgG anti-SP (grey triangles) in WT mice. f, 3D representative confocal microscopy pictures of Av.SRho fluorescent signal (red) in whole-mounted ears in mice treated as in e. g, Quantification of not degranulated or degranulated mast cells in mice treated as in e. h, Same experiment as in a but 45 after i.d. injection of capsaicin. i. Same experiment as in b but 45 after i.d. injection of capsaicin. j, Same experiment as in d but 45 after i.d. injection of capsaicin. Bars = 20 μm. All data are from two independent experiments with the following number of mice: (a-d) n = 6 (DMSO Vehicle), n = 5 (RTX Vehicle), n = 5 (Mrgprb2+/+ Vehicle), n = 6 (Mrgprb2mut/mut Vehicle), n = 7 (DMSO D. farinae + SEB), n = 7 (RTX D. farinae + SEB), n = 9 (Mrgprb2+/+ D. farinae + SEB), n = 9 (Mrgprb2mut/mut D. farinae + SEB); (e-g) n = 7 (IgG control isotype), n = 7 (IgG anti-SP); (h-j) n = 7 (DMSO), n = 7 (RTX), n = 7 (Mrgprb2+/+), n = 7 (Mrgprb2mut/mut). Mean ± SEM (a,e,h), mean + SEM (c,d,g,j), two-tailed, unpaired t-test, *P<.05 **P<.01 ***P<.001.
Figure 6
Figure 6. Dermal mast cells and TPRV1+ nociceptors form sensory clusters in the skin that respond to D. farinae and SEB.
a, Representative high-resolution 3-D images of the dermis; merged fluorescence of Av.SRho (red), GCaMP3 calcium tracer (pseudocolor intensity scale) and collagen structures (blue) in Av.SRho-labeled ear pinna of Pirt-GCaMP3 mice 30-60 minutes after i.d. injection of vehicle or 1 μM capsaicin or 1 μg D. farinae and 50 ng SEB (alone or in combination). White lines identify magnified areas shown in lower images. Bars = 100 μm. b, Mean Fluorescence Intensity (MFI) of GCaMP3 fluorescent signal per field of view in mice treated as in a. c, Proportion (%) of Av.SRho+ mast cells with exteriorized granule structures (i.e., activated to degranulate) per field of view in mice treated as in a. One symbol = one field analyzed. (a-c) All data are from three independent experiments with the following number of mice: n = 4 (vehicle), n = 5 (capsaicin), n = 5 (D. farinae), n = 3 (SEB), n = 5 (D. farinae + SEB). Mean + SEM, two-tailed, unpaired t-test, **P<.01 ***P<.001. d, Automated computational analysis of the minimum distance between modeled Av.SRho+ mast cell bodies detected and modeled capsaicin-activated TRPV1+ Pirt-GCaMP3+ sensory neurons. e, Examples of modeled Av.SRho+ mast cell bodies forming physical contact with (left) or in proximity to (right) modeled capsaicin-activated TRPV1+ Pirt-GCaMP3+ sensory neurons. f, Proportion (%) of 453 modeled Av.SRho+ mast cell bodies from the ear pinnae of 3 different mice in physical contact with (red), at 1 to 25 μm (black), at 25 to 50 μm (dark grey) or at more than 50 μm (light grey) from modeled capsaicin-activated TRPV1+ Pirt-GCaMP3+ sensory neurons.

Comment in

References

    1. Zheng T, Yu J, Oh MH, Zhu Z. The atopic march: progression from atopic dermatitis to allergic rhinitis and asthma. Allergy Asthma Immunol Res. 2011;3:67–73. doi: 10.4168/aair.2011.3.2.67. - DOI - PMC - PubMed
    1. Leung DY, Bieber T. Atopic dermatitis. Lancet. 2003;361:151–160. doi: 10.1016/S0140-6736(03)12193-9. - DOI - PubMed
    1. Sager N, Feldmann A, Schilling G, Kreitsch P, Neumann C. House dust mite-specific T cells in the skin of subjects with atopic dermatitis: frequency and lymphokine profile in the allergen patch test. J Allergy Clin Immunol. 1992;89:801–810. - PubMed
    1. Langer K, Breuer K, Kapp A, Werfel T. Staphylococcus aureus-derived enterotoxins enhance house dust mite-induced patch test reactions in atopic dermatitis. Exp Dermatol. 2007;16:124–129. doi: 10.1111/j.1600-0625.2006.00523.x. - DOI - PubMed
    1. Park HY, et al. Staphylococcus aureus Colonization in Acute and Chronic Skin Lesions of Patients with Atopic Dermatitis. Ann Dermatol. 2013;25:410–416. doi: 10.5021/ad.2013.25.4.410. - DOI - PMC - PubMed

Publication types

MeSH terms