. 2019 Nov;20(11):1542-1554.
doi: 10.1038/s41590-019-0495-x. Epub 2019 Oct 7.

Quantitative analysis of T cell proteomes and environmental sensors during T cell differentiation

Affiliations

Quantitative analysis of T cell proteomes and environmental sensors during T cell differentiation

Andrew J M Howden et al. Nat Immunol. 2019 Nov.

Abstract

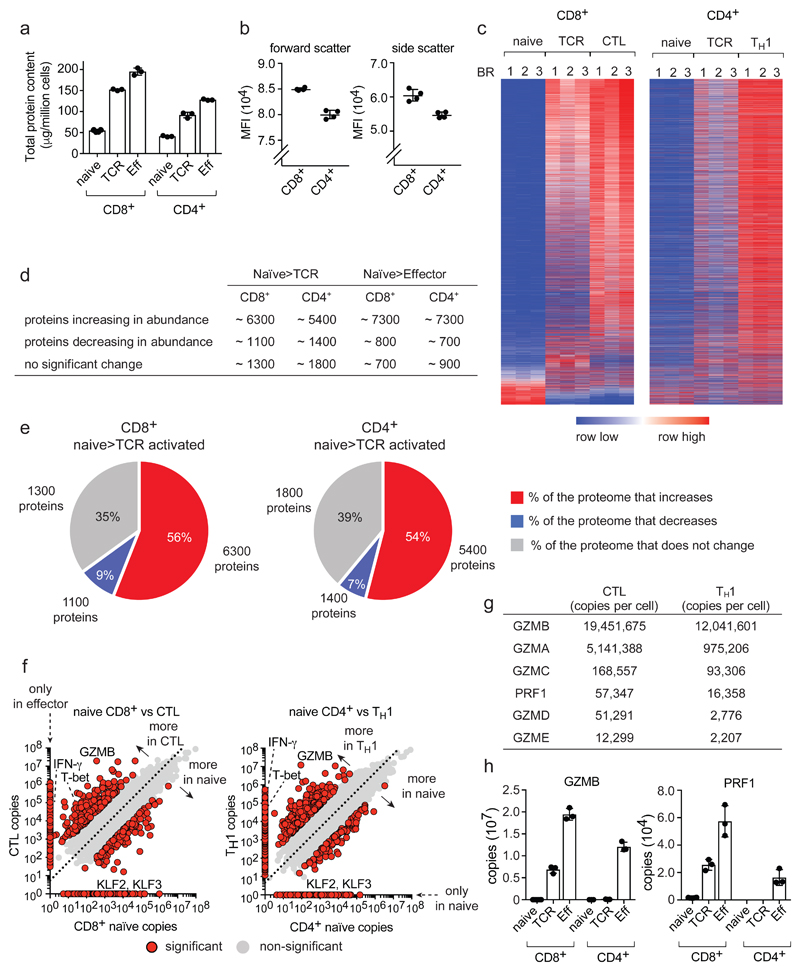
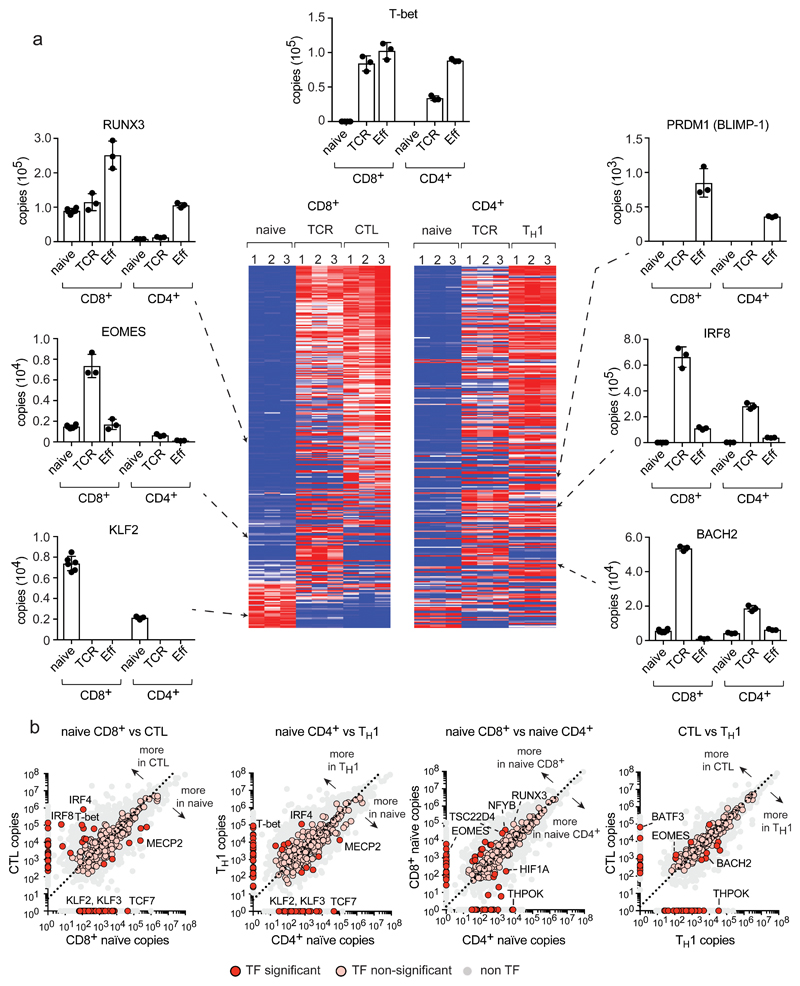
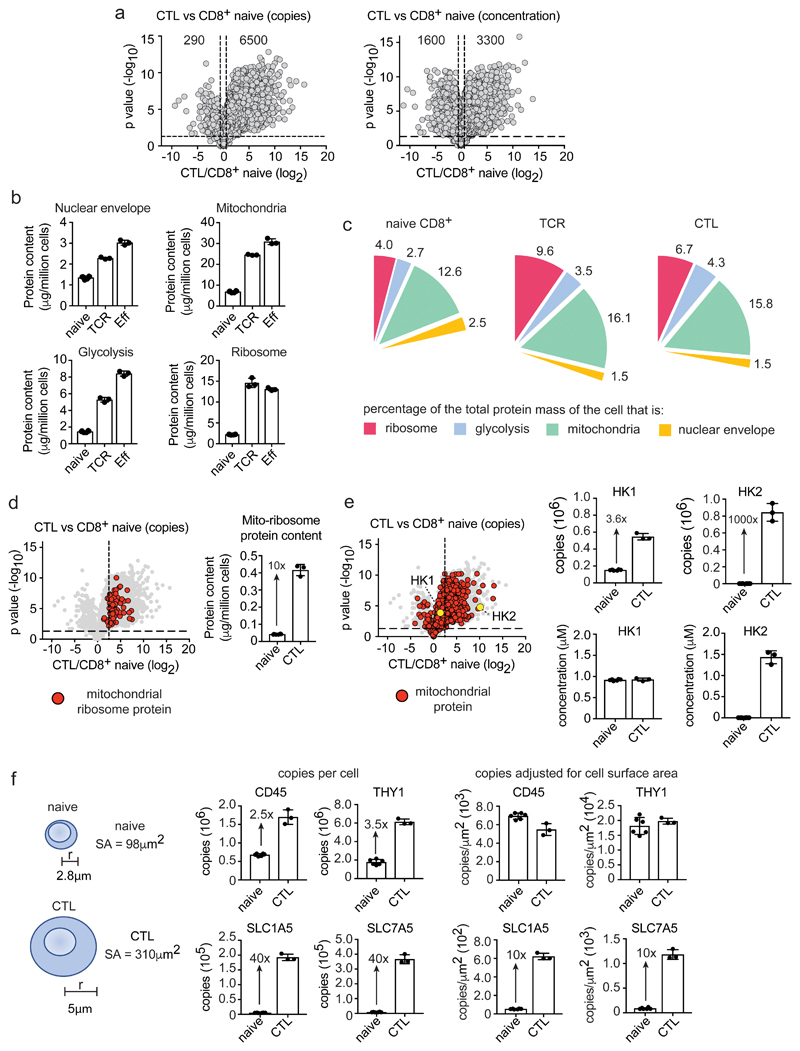
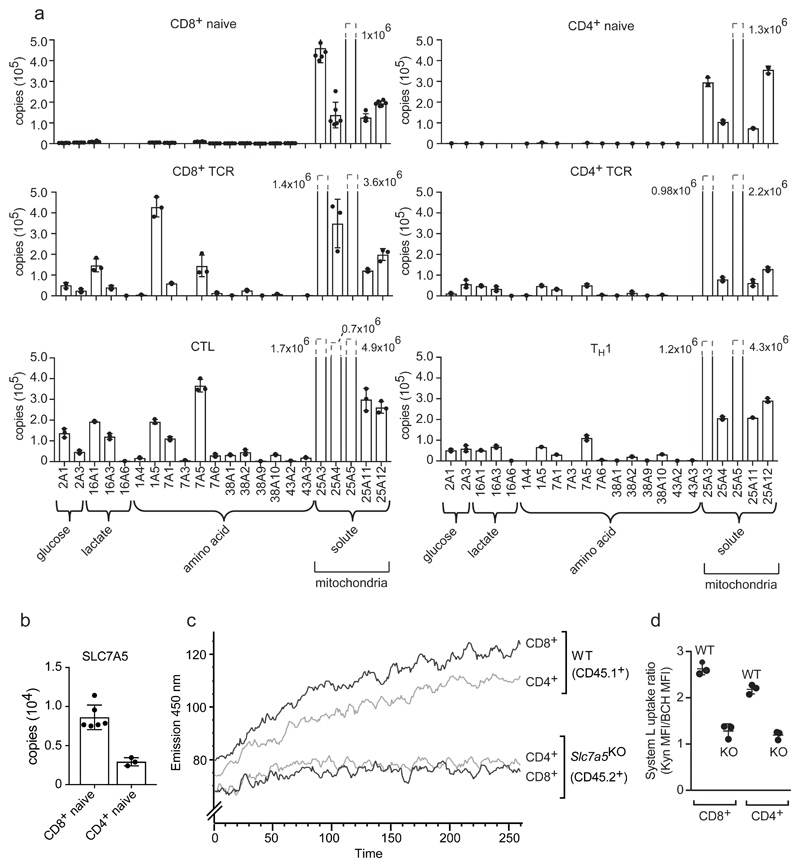
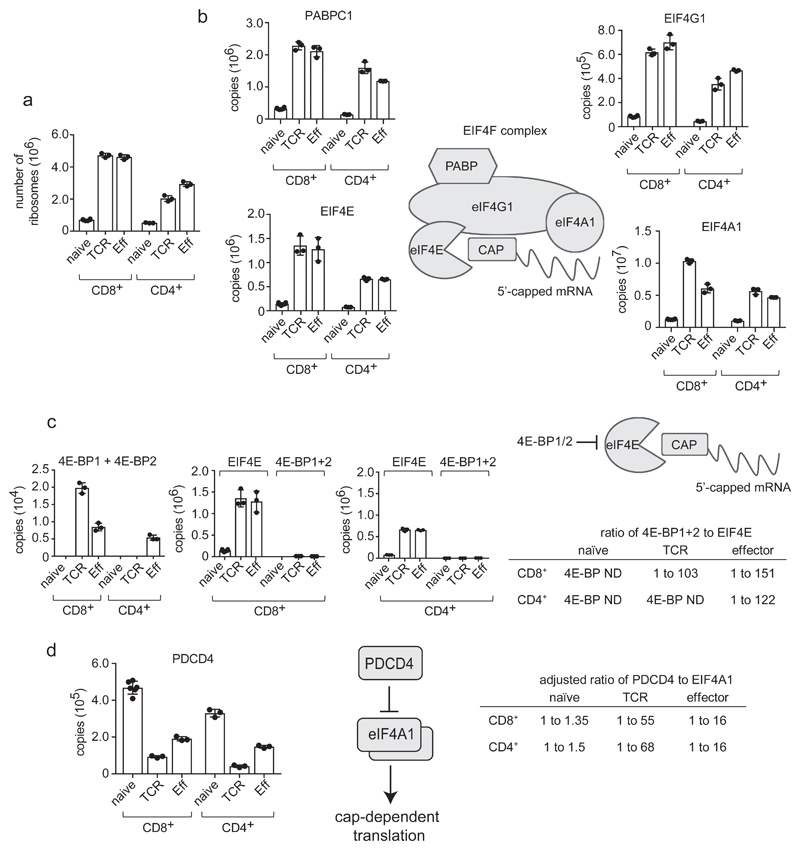
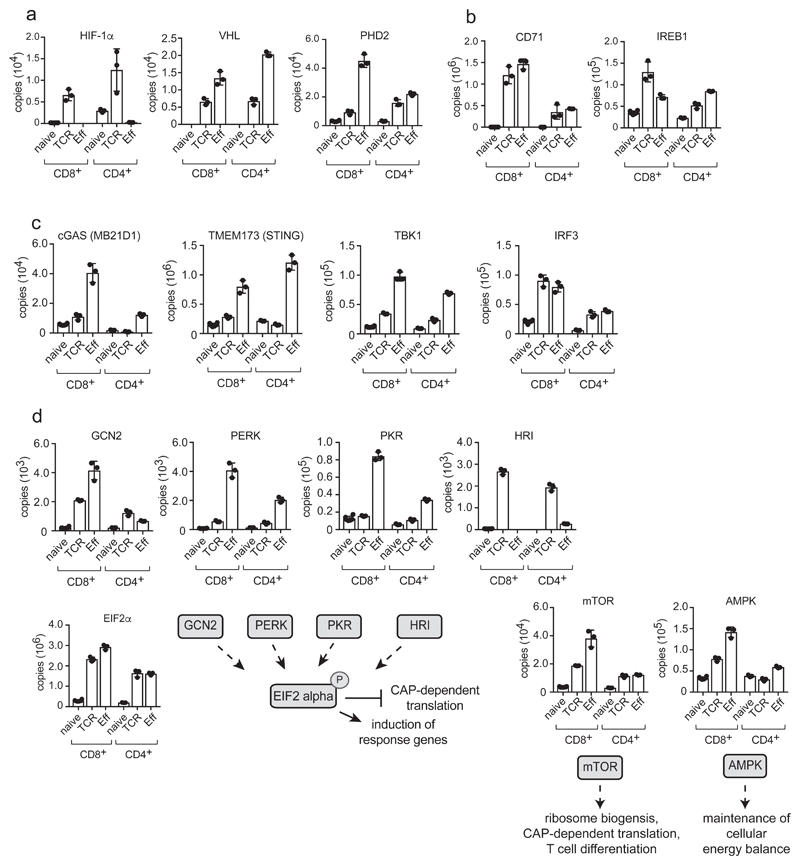
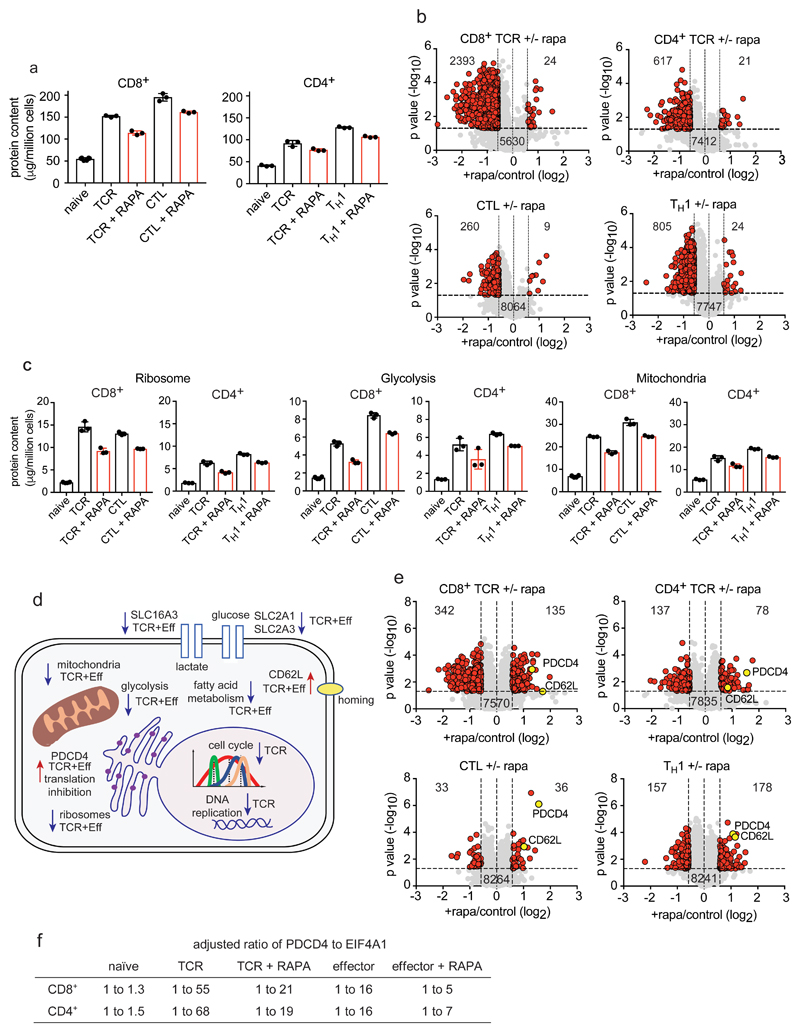
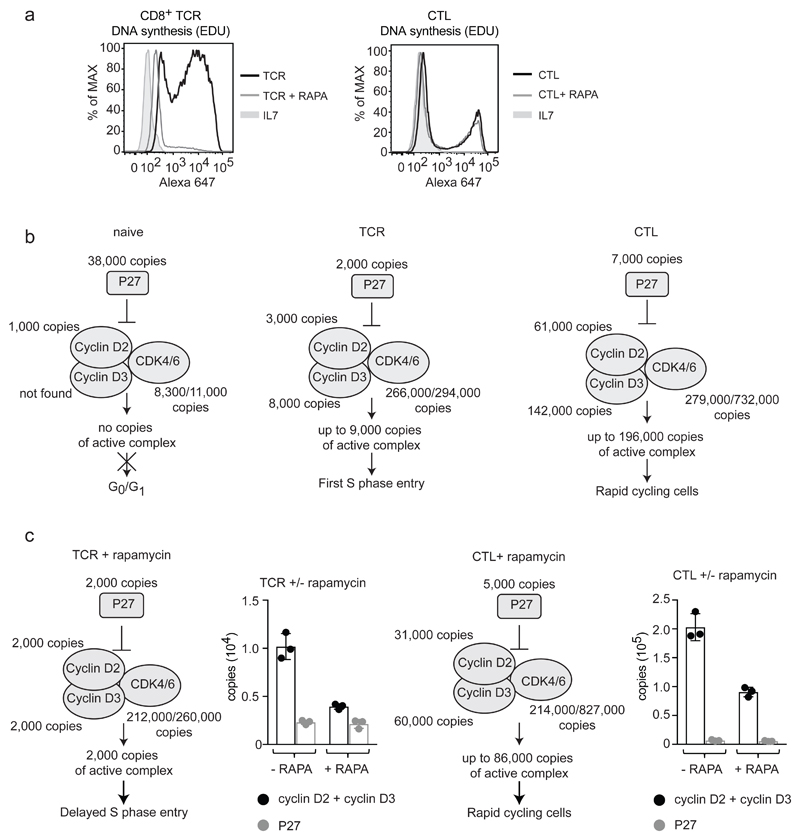
Quantitative mass spectrometry reveals how CD4+ and CD8+ T cells restructure proteomes in response to antigen and mammalian target of rapamycin complex 1 (mTORC1). Analysis of copy numbers per cell of >9,000 proteins provides new understanding of T cell phenotypes, exposing the metabolic and protein synthesis machinery and environmental sensors that shape T cell fate. We reveal that lymphocyte environment sensing is controlled by immune activation, and that CD4+ and CD8+ T cells differ in their intrinsic nutrient transport and biosynthetic capacity. Our data also reveal shared and divergent outcomes of mTORC1 inhibition in naïve versus effector T cells: mTORC1 inhibition impaired cell cycle progression in activated naïve cells, but not effector cells, whereas metabolism was consistently impacted in both populations. This study provides a comprehensive map of naïve and effector T cell proteomes, and a resource for exploring and understanding T cell phenotypes and cell context effects of mTORC1.


Conflict of interest statement

Competing Interests

The authors declare no competing interests.

Figures

Figure 1
Figure 1. Proteome re-modelling during T cell differentiation.
(a) Total protein content of naïve, 24 h TCR-activated (TCR) and effector (Eff) populations. (b) Mean fluorescence intensity (MFI) of forward/side scatter for naïve CD4+ and CD8+ T cells. (c) Heat map of CD4+ and CD8+ proteomes during differentiation. The full list of proteins within the heat map is provided in Supplementary Data File 1. (d) Number of proteins changing in abundance during T cell differentiation: naïve to TCR activated and naïve to effector (P value <0.05, fold change >1.5 (two-tailed t-test with unequal variance) or presence/absence expression). (e) The proportion of the cell mass that corresponds to proteins increasing, decreasing or not changing in naïve cells in response to TCR triggering. The number of proteins in each category is also provided. Proteins were categorized as changing as described above. (f) Protein copy number comparisons between naïve and effector populations for CD4+ and CD8+ T cells. Proteins highlighted in red are significantly different between naïve and effector or show a presence/absence expression profile (P value <0.05, fold change >2 standard deviations from the mean fold change, two-tailed t-test with unequal variance). Proteins that were not detected in one population are positioned on the axis and are highlighted in red. The dashed line = mean fold change between naïve and effector. Interferon-γ (IFN-γ), granzyme B (GZMB), T-bet (TBX21) and Kruppel-like factor 2 and 3 (KLF2 and KLF3). (g) Abundance of effector molecules in CTLs and TH1 cells. (h) Abundance of GZMB and perforin (PRF1). For a, d, e, f, g and h, n = 6 biologically independent samples for CD8+ naïve cells and 3 biologically independent samples for each of the other T cell populations. For b, n = 4 biologically independent samples. For c, n = 3 biologically independent samples for each T cell population. Histogram bars represent the mean +/- SD.
Figure 2
Figure 2. Expression profile of transcription factors during T cell differentiation.
Over 300 proteins annotated as DNA binding/transcription factor activity (GO:0003700) were identified in CD4+ and CD8+ T cell populations. Additional transcription factors without a GO annotation were added manually. (a) Transcription factor expression profiles during T cell differentiation. The full list of proteins included in heat maps is provided in Supplementary Data File 1. Histograms showing protein copy numbers per cell are provided for a selection of core transcription factors essential for T cell differentiation and activity: Runt Related Transcription Factor 3 (RUNX3); Eomesodermin (EOMES); Interferon Regulatory Factor 8 (IRF8); BTB Domain And CNC Homolog 2 (BACH2). (b) Copy number comparisons for transcription factors in different T cell populations. Scatter plots show the average copy number for transcription factors and allow a two-way comparison between T cell populations. Proteins that were not detected in one population are positioned on the axis. Transcription factors significantly different between 2 populations (P value <0.05 and a fold change >2 standard deviations from the mean fold change, two-tailed t-test with unequal variance) or showing a presence/absence expression profile, are represented with a red circle, while non-significant transcription factors are represented with a pink circle. The dashed line = the mean fold change between 2 populations. For heat maps in a, n = 3 biologically independent samples for each T cell population. For histograms in a and plots in b, n = 6 biologically independent samples for CD8+ naïve cells and 3 biologically independent samples for each of the other T cell populations. Histogram bars represent the mean +/- SD.
Figure 3
Figure 3. Scaling versus selective enrichment of proteins and processes during T cell differentiation.
(a) Comparing protein copy number and concentration. Volcano plots show the ratio for proteins in CTLs versus naïve CD8+ T cells (CTL/naïve), using copies/cell or cellular protein concentration (μM). Horizontal dashed line indicates a P value = 0.05, vertical dashed lines indicate a fold change = 1.5 (b) Protein content of ribosomes (KEGG 03010), mitochondria (GO:0005739), nuclear envelope (GO:0005635) and the glycolytic pathway. (c) Protein content of cellular compartments relative to the total cellular protein mass (%). (d) Expression profile and protein content of mitochondrial ribosomal proteins in naïve CD8+ T cells and CTLs. The vertical dashed line on the volcano plot is the mean fold change (copy number CTL/naïve) of all proteins. (e) The expression profile of mitochondrial proteins in CTLs versus naïve CD8+ T cells (copy number CTL/naïve). Mitochondrial proteins are highlighted with red circles. Hexokinase 1 (HK1) and hexokinase 2 (HK2) are highlighted with yellow circles. Vertical dashed line is the mean fold change for all proteins. Copy number and concentration of HK1 and HK2 is also provided. (f) Protein copy numbers relative to cell surface area. The surface area of naïve and effector CD8+ T cells was estimated using the formula 4πr2, assuming the radius of a naïve cell to be 2.8 μm and a CTL to be 5 μm, . Data shows protein copy numbers per cell and protein copy numbers adjusted for cell surface area (copies/μm2). For a-f, n = 6 biologically independent samples for CD8+ naïve cells and 3 biologically independent samples for each of the other T cell populations. Histogram bars represent the mean +/- SD. For a, d and e, P values calculated using a two-tailed t-test with unequal variance.
Figure 4
Figure 4. Nutrient and amino acid transport in T cells.
(a) Copy numbers for the major glucose, lactate and amino acid transporters and selected mitochondrial transporters in naïve, TCR activated and effector populations. (b) Copy numbers for the system L amino acid transporter SLC7A5 in naïve CD8+ and CD4+ T cells. For a and b, n = 6 biologically independent samples for CD8+ naïve cells and 3 biologically independent samples for each of the other T cell populations. Histogram bars represent the mean +/- SD. (c) Flow cytometric monitoring of System L dependent uptake in wild type and CD4Cre Slc7a5fl/fl naïve CD4+ and CD8+ cells. Lymph node cells from CD45.1+ (WT) and CD45.2+ (CD4Cre Slc7a5fl/fl, where SLC7A5 is deleted in all T cells) were mixed together and surface antibody stained for flow cytometric detection prior to the addition of the System L substrate kynurenine (KYN). Fluorescence emission was monitored over time using 405 nm excitation (violet laser) and band pass filter 450 ± 50. The representative trace shows the fluorescence data acquired post addition of 200 μM KYN plotted against time (seconds). (d) Kynurenine uptake in naïve CD4+ and CD8+ T cells +/- 10 mM 2-amino-2-norbornanecarboxylic acid (BCH); a System L transport inhibitor. The System L uptake ratio is calculated as the MFI after 5 min KYN uptake compared with the MFI after 5 min of KYN uptake in the presence of 10 mM BCH (KYN MFI / KYN+BCH MFI). For c and d, n = 3 biologically independent samples for WT and 3 biologically independent samples for CD4Cre Slc7a5fl/fl. Data presented in c is representative of one experiment and the experiment was carried out 3 times producing similar results. Bars shown in d represent the mean +/- SD.
Figure 5
Figure 5. Regulation of mRNA translation in T cells.
(a) Number of ribosomes in naive, TCR activated and effector CD4+ and CD8+ T cell populations. Number of ribosomes was estimated by calculating the mean number of ribosomal subunits within each cell using the KEGG annotation: 03010. (b) Expression profile of key components of the Eukaryotic Initiation Factor 4F (EIF4F) mRNA translation initiation complex during differentiation. EIF4F consists of Eukaryotic Translation Initiation Factor 4 Gamma 1 (EIF4G1), Eukaryotic Translation Initiation Factor 4A1 (EIF4A1), Eukaryotic Translation Initiation Factor 4E (EIF4E) and Poly(A) Binding Protein Cytoplasmic 1 (PABPC1). Data is presented as protein copies per cell in naïve, TCR activated and effector CD8+ and CD4+ T cell populations. (c) Stoichiometry of eukaryotic initiation factor 4E-binding proteins 1 and 2 (4E-BP1+2) to EIF4E in T cell populations. Copy numbers for 4E-BP1 and 2 were combined. 4E-BP1+2 are also plotted adjacent to copy numbers for EIF4E to assess whether inhibitor levels are adequate to block translation initiation, and the ratio of 4E-BP1+2 to EIF4E is presented (ND = not detected). (d) Stoichiometry of Programmed Cell Death 4 (PDCD4) and EIF4A1 during T cell differentiation. The ratio of PDCD4 to EIF4A1 in naïve, TCR triggered and effector CD4+ and CD8+ T cells is shown adjusted to account for 1 molecule of PDCD4 binding 2 molecules of EIF4A1 to inhibit CAP-dependent translation. For a-d, n = 6 biologically independent samples for CD8+ naïve cells and 3 biologically independent samples for each of the other T cell populations. Histogram bars represent the mean +/- SD.
Figure 6
Figure 6. Environmental sensing in T cells.
(a) Protein copy numbers for components of oxygen sensing pathways including the transcription factor hypoxia-inducible factor-1 alpha (HIF-1α), the oxygen sensing molecule prolyl hydroxylase domain-containing protein 2 (PHD2) and the E3 ligase that ubiquinates HIF-1α, von Hippel-lindau tumor suppressor (VHL). (b) The abundance of CD71 (Transferrin receptor) and IREB1 (Iron-Responsive Element-Binding Protein 1/Aconitase 1). (c) The impact of immune activation on the cGAS-STING DNA sensing pathway: Cyclic GMP-AMP Synthase (cGAS); Stimulator Of Interferon Genes Protein (STING or TMEM173); TANK Binding Kinase 1 (TBK1); Interferon Regulatory Factor 3 (IRF3). (d) Abundance of the amino acid sensing kinases Eukaryotic Translation Initiation Factor 2 Alpha Kinases 1, 2, 3 and 4 (HRI, PKR, PERK and GCN2 respectively) and mTOR (glucose and amino acid sensing) and AMPK (glucose sensing). For a-d, n = 6 biologically independent samples for CD8+ naïve cells and 3 biologically independent samples for each of the other T cell populations. Histogram bars represent the mean +/- SD.
Figure 7
Figure 7. The impact of mTORC1 inhibition on CD4+ and CD8+ T cell proteomes.
(a) Protein content of T cells in response to mTORC1 inhibition. Naïve CD4+ and CD8+ T cells were TCR triggered for 24 h +/- rapamycin while effector CD4+ and CD8+ cells were incubated for 24 h +/- rapamycin. (b) Volcano plots show the protein ratios for rapamycin treated cells versus control (+rapamycin/control copy numbers). Proteins highlighted in red have a P value <0.05 and a fold change >1.5 while proteins highlighted in grey did not change significantly. (c) The impact of rapamycin on the glycolytic pathway, ribosomes and mitochondria in CD4+ and CD8+ cells. (d) Summary of cellular processes impacted by mTORC1 inhibition. Arrows pointing downwards indicate decreased abundance while arrows pointing upwards indicate increased abundance. Proteins/processes changing in TCR stimulated cells only are labelled “TCR” while those changing in TCR and effector populations are labelled “TCR+Eff”. (e) The impact of inhibiting mTORC1 on protein concentration. Volcano plots were generated as described above. (f) The ratio of PDCD4 to EIF4A1. 1 molecule of PDCD4 binds 2 molecules of EIF4A1 and the ratios have been adjusted to account for this binding stoichiometry. For a-f, n = 6 biologically independent samples for CD8+ naïve cells and 3 biologically independent samples for each of the other T cell populations. Histogram bars represent the mean +/- SD. For b and e, P values were calculated using a two-tailed t-test with unequal variance.
Figure 8
Figure 8. The impact of mTORC1 inhibition on cell cycle proteins.
(a) Flow cytometric analysis of DNA synthesis in CD8+ T cells in response to rapamycin. Naïve CD8+ cells TCR triggered for 24 h and effector CTLs were treated +/- rapamycin. DMSO was used as a vehicle control. DNA synthesis was assessed by incorporation of EdU (a thymidine analogue) into newly synthesized DNA which is fluorescently labelled using a copper-catalyzed click reaction. Naïve cells (IL7 treated) were included as a control. n = 3 biologically independent samples for IL7 and TCR activated cells, n = 3 biologically independent samples for CTLs. The data shown is from 1 biologically independent sample and is representative of all replicates. (b) Stochiometric model for cell cycle entry and progression. Protein copy numbers are presented for cyclin D2 (CCND2), cyclin D3 (CCND3), cyclin dependent kinase 4 (CDK4), cyclin dependent kinase 6 (CDK6) and the cyclin dependent kinase inhibitor CDKN1B (P27). (c) The impact of rapamycin on the cyclin D/P27 model in CD8+ cells TCR triggered for 24 h and effector CD8+ cells incubated +/- rapamycin. Protein copy numbers are also presented in graphs for CCND2 + CCND3 adjacent to P27. For b and c, n = 6 biologically independent samples for CD8+ naïve cells and 3 biologically independent samples for each of the other T cell populations. Histogram bars represent the mean +/- SD. Copy numbers adjacent to cell cycle proteins are the average of replicates and were rounded to the nearest thousand.

References

    1. Araki K, et al. Translation is actively regulated during the differentiation of CD8(+) effector T cells. Nat Immunol. 2017;18:1046–1057. - PMC - PubMed
    1. Sinclair LV, et al. Control of amino-acid transport by antigen receptors coordinates the metabolic reprogramming essential for T cell differentiation. Nat Immunol. 2013;14:500–508. - PMC - PubMed
    1. Ricciardi S, et al. The Translational Machinery of Human CD4(+) T Cells Is Poised for Activation and Controls the Switch from Quiescence to Metabolic Remodeling. Cell Metab. 2018;28:895–906. - PMC - PubMed
    1. Geiger R, et al. L-Arginine Modulates T Cell Metabolism and Enhances Survival and Anti-tumor Activity. Cell. 2016;167:829–842. - PMC - PubMed
    1. Hukelmann JL, et al. The cytotoxic T cell proteome and its shaping by the kinase mTOR. Nat Immunol. 2016;17:104–112. - PMC - PubMed

Publication types

MeSH terms