. 2019 Nov;20(11):1444-1455.
doi: 10.1038/s41590-019-0496-9. Epub 2019 Oct 7.

Locally instructed CXCR4hi neutrophils trigger environment-driven allergic asthma through the release of neutrophil extracellular traps

Affiliations

Locally instructed CXCR4hi neutrophils trigger environment-driven allergic asthma through the release of neutrophil extracellular traps

Coraline Radermecker et al. Nat Immunol. 2019 Nov.

Abstract

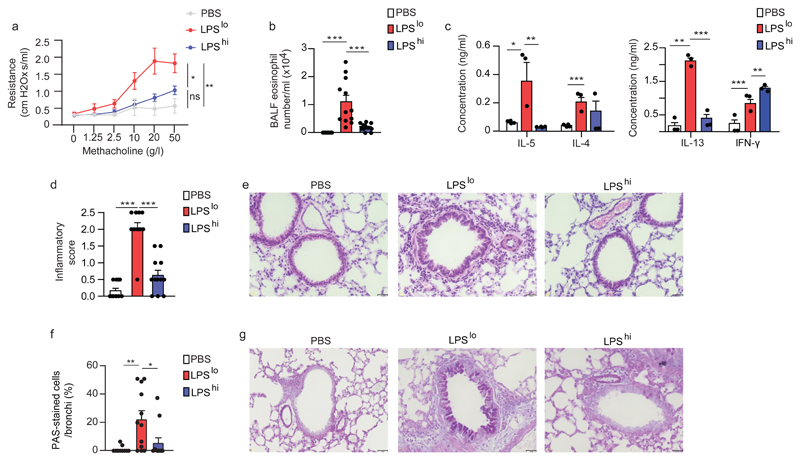
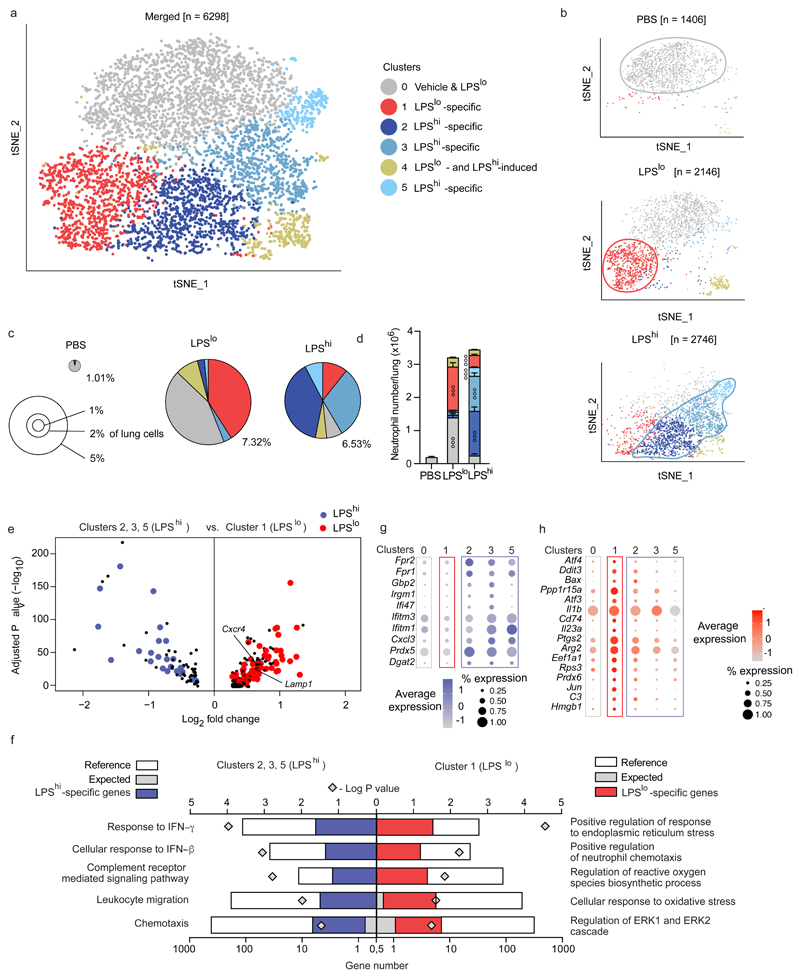
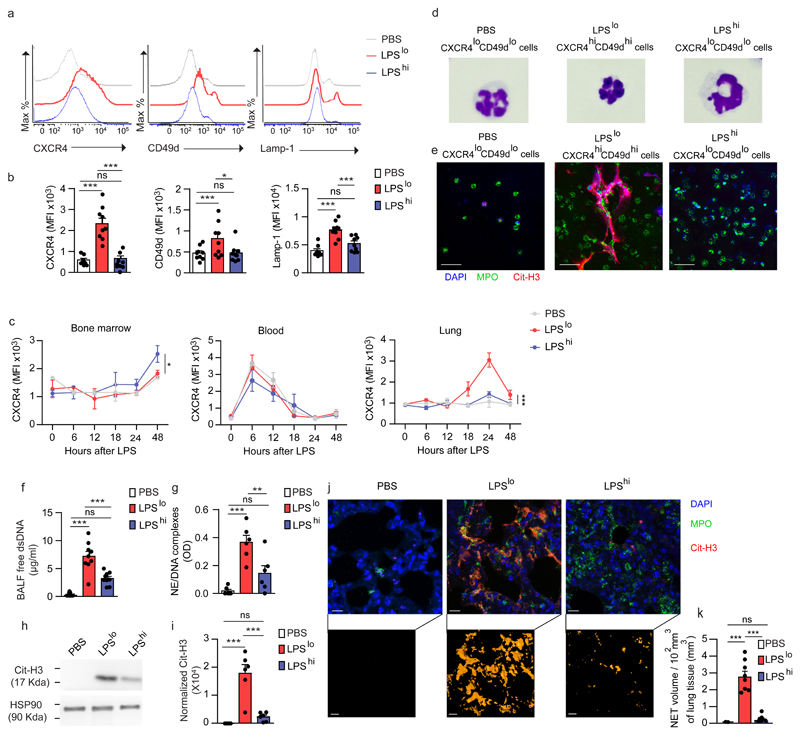
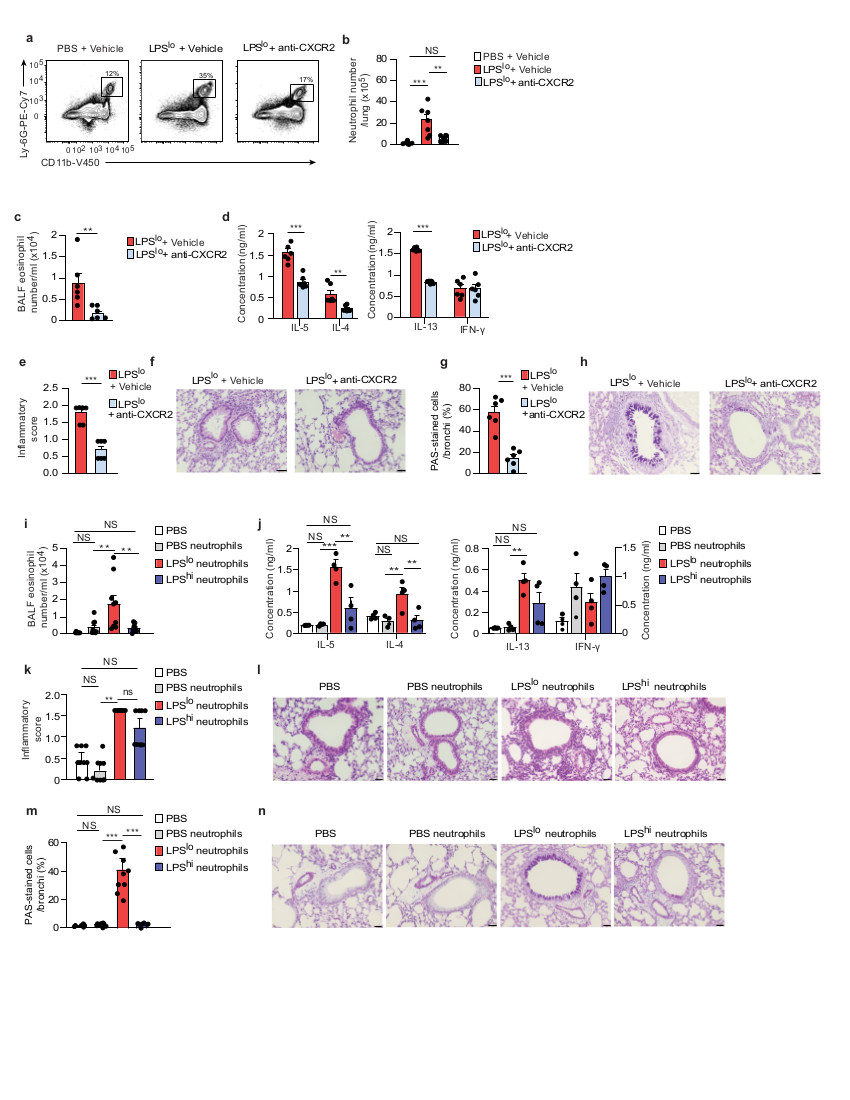
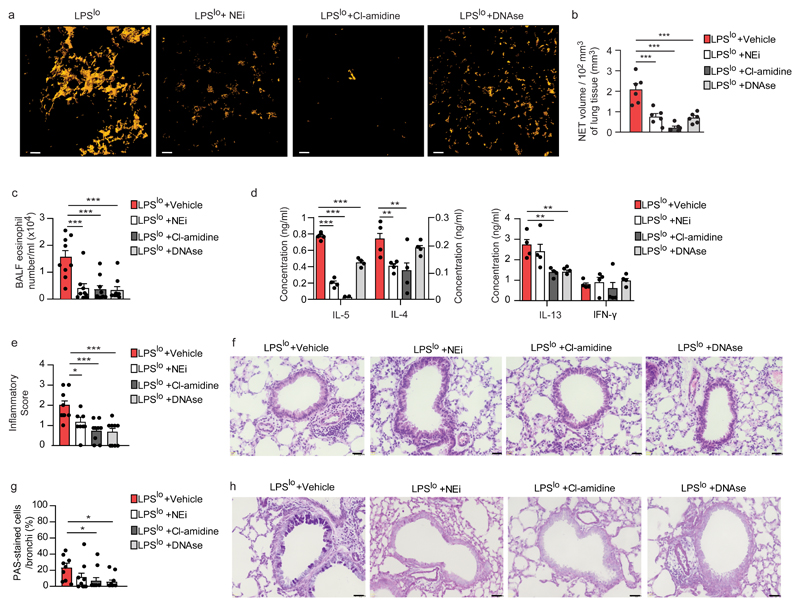
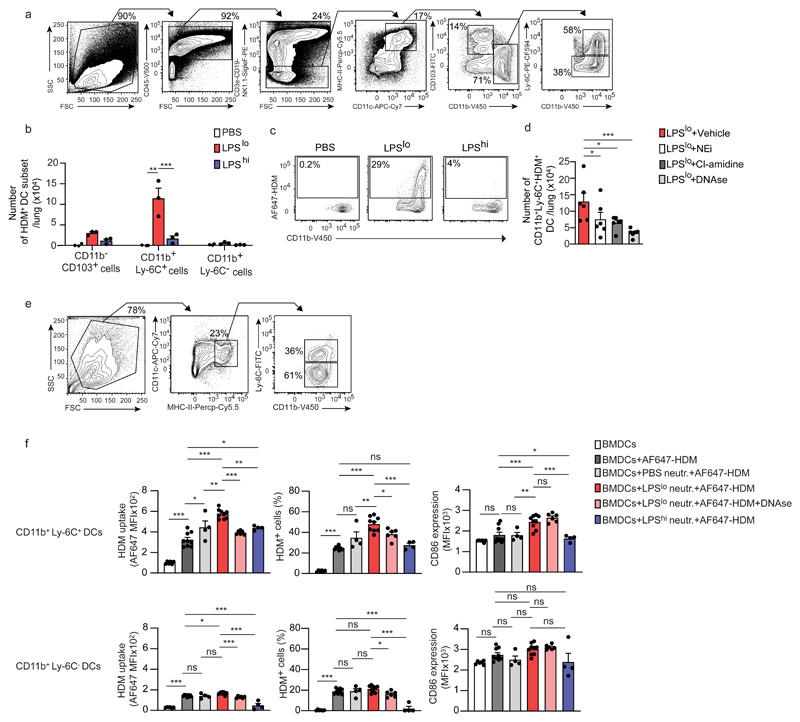
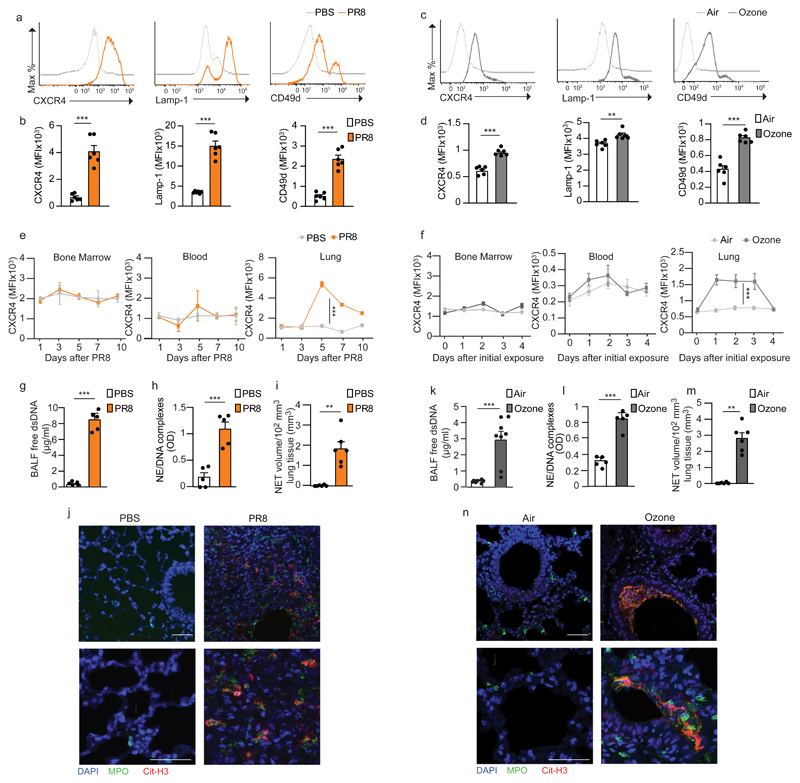
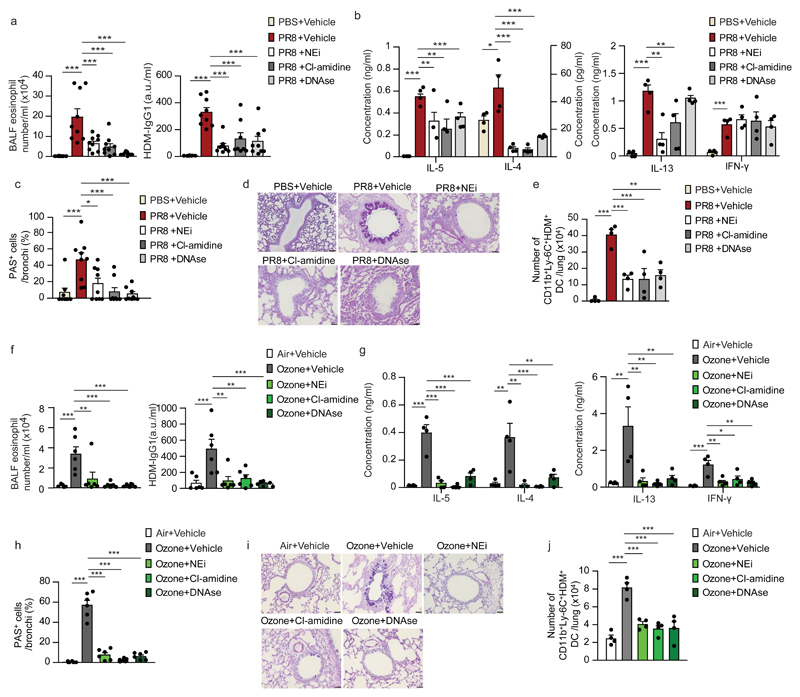
Low exposure to microbial products, respiratory viral infections and air pollution are major risk factors for allergic asthma, yet the mechanistic links between such conditions and host susceptibility to type 2 allergic disorders remain unclear. Through the use of single-cell RNA sequencing, we characterized lung neutrophils in mice exposed to a pro-allergic low dose of lipopolysaccharide (LPS) or a protective high dose of LPS before exposure to house dust mites. Unlike exposure to a high dose of LPS, exposure to a low dose of LPS instructed recruited neutrophils to upregulate their expression of the chemokine receptor CXCR4 and to release neutrophil extracellular traps. Low-dose LPS-induced neutrophils and neutrophil extracellular traps potentiated the uptake of house dust mites by CD11b+Ly-6C+ dendritic cells and type 2 allergic airway inflammation in response to house dust mites. Neutrophil extracellular traps derived from CXCR4hi neutrophils were also needed to mediate allergic asthma triggered by infection with influenza virus or exposure to ozone. Our study indicates that apparently unrelated environmental risk factors can shape recruited lung neutrophils to promote the initiation of allergic asthma.


Conflict of interest statement

Competing financial interests

The authors declare no competing financial interests.

Figures

Figure 1
Figure 1. Pre-exposure to low-dose LPS potentiates HDM-induced type 2 allergic asthma.
a, Invasive measurement of dynamic airway resistance upon methacholine inhalation showing bronchial hyperreactivity in vehicle-HDM, LPSlo-HDM and LPShi-HDM mice, assessed 3 days after the second HDM administration. b, Eosinophil cell counts in the BALF of mice, as in a. c, ELISA measurement of cytokine production by HDM-restimulated bronchial lymph node (BLN) cells of mice as in a. d, Inflammatory score estimating perivascular and peribronchial inflammation, quantified from H&E-stained lung sections of mice as in a. e, Representative H&E staining of lung sections of mice as in a. f, Quantification of PAS-stained epithelial cells per bronchi showing airway mucus production in mice as in a. g, Representative PAS staining of lung sections of mice as in a. (a-d,f) Data show mean + s.e.m. and are pooled from (a) 2 independent experiments (n=6 mice/group) or (b-d,f) ≥3 independent experiments, each symbol representing (b,d,f) individual mice (n=12/group) or (c) independent experiments in which cells from 4 mice were pooled by group. P values were calculated using (a) a mixed effects model with Geisser greenhouse correction or (b-d,f) a one-way ANOVA with Tukey's post hoc test. *P<0.05; **P<0.01; ***P<0.001. BALF, bronchoalveolar lavage fluid; ns, not significant i.n., intranasal(ly). Scale bar = 32 µm.
Figure 2
Figure 2. ScRNA-seq analysis of the lung neutrophil compartment 24 h after pro-allergic low or protective high LPS exposure.
a, tSNE plots depicting the transcriptional identity of lung neutrophils merged from vehicle, LPSlo and LPShi mice 24 h after treatment, analyzed by scRNA-seq (n=3 pooled mice/group). b, tSNE plots depicting the transcriptional identity of lung neutrophils from the three separate experimental conditions as in a. c, Pie charts depicting the relative contribution of each neutrophil cluster to the pool of neutrophils in lungs of mice as in a. Insets indicate average percentage of neutrophils among total lung cells. d, Absolute numbers of lung neutrophils per cluster in mice as in a. e, Volcano plot depicting the differentially expressed genes between LPShi and LPSlo lung neutrophils of mice as in a. Transcripts characteristic of the common LPS, the LPSlo- and LPShi-specific signatures are colored in black, red and blue, respectively. f, PANTHER GO enrichment tests on the genes of the LPShi (left) and LPSlo (right) signatures. g-h, Dot plots showing average expression of genes of the (g) LPShi and (h) LPSlo signatures within neutrophil clusters. Data in (d) show mean + s.e.m. (n=3 mice/group). P values were calculated using (d) a two-way ANOVA with Tukey's post hoc test, (e) a likelihood ratio test based on zero-inflated data to identify positive and negative markers of a single cluster compared to some or all other clusters or (f) a two-tailed Mann-Whitney U test with Benjamini-Hochberg False Discovery Rate (FDR) correction. The symbol ° within a given cluster in d indicates that neutrophil numbers in that cluster are significantly different from the ones of the same cluster in the two other experimental conditions. °°°P<0.001. GO, Gene Ontology.
Figure 3
Figure 3. Pro-allergic low-dose LPS instructs lung neutrophils to upregulate CXCR4, CD49d and Lamp-1 and release NETs.
a, Representative histograms of CXCR4, CD49d and Lamp-1 expression by lung CD45+CD11b+Ly-6G+ neutrophils from vehicle, LPSlo and LPShi mice 24 h after treatment. b, MFI showing quantification of CXCR4, CD49d and Lamp-1 expression by lung CD45+CD11bhiLy-6Ghineutrophils as in a. c, Kinetic analysis of CXCR4 expression by bone marrow, blood and lung CD45+CD11b+Ly-6G+ neutrophils from mice as in a. d, Representative photographs of FACS-sorted CXCR4loCD49dlo, CXCR4loCD49dlo and CXCR4hiCD49dhi lung neutrophils from mice as in a. e, Confocal microscopy stainings of Cit-H3+MPO+DAPI+ NETs released from ex vivo-cultured neutrophils as in d. Pictures are representative of one of 4 independent sorting experiments. f, Levels of extracellular dsDNA in the BALF of vehicle, LPSlo and LPShi mice 24 h after treatment. g, ELISA measurement of NE/DNA complexes in the BALF of mice as in f. h, Representative blots of Cit-H3 and HSP90α (loading control) assessed by Western blot of lung protein extracts from mice as in f. i, Quantification of normalized Cit-H3 levels in lung protein extracts of mice as in f. j, Confocal microscopy stainings (top) and three-dimensional modeling (bottom) of Cit-H3+MPO+ NETs on lung sections of mice as in f. Pictures are representative of one of >6 lungs analyzed. k, Quantification of NET volume in lung sections of mice as in f (n= 8 mice/group). Data show mean + s.e.m and are pooled from (b,f,g,i) 3 independent experiments (b,f,g,i: n=9,9,6,6 mice/group, respectively), or (c) 2 independent experiments perand to release neutrophil extracellular traps time point analyzed (n=3 mice/time point). P values were calculated using a one-way ANOVA with Tukey's post hoc test. *P<0.05; **P<0.01; ***P<0.001. P values compare LPSlo vs. vehicle or LPShi mice in c (i.e., treatment effect). BALF, bronchoalveolar lavage fluid; OD, optical density; ns, not significant. Scale bar = 10 µm.
Figure 4
Figure 4. LPSlo neutrophils mediate susceptibility to HDM-induced type 2 allergic airway inflammation.
a, Representative dot plots of lung CD45+CD11b+Ly-6G+ neutrophils from vehicle or LPSlo mice treated or not with Sch527123, a CXCR2 antagonist (anti-CXCR2), 2 h before and 4, 8 and 20 h after LPS, and analyzed 24 h after LPSlo. Insets indicate % of cells within the gate. b, Absolute numbers of lung CD45+CD11b+Ly-6G+ neutrophils as in a. c, Eosinophil cell counts in the BALF, assessed 3 days after the second HDM administration in LPSlo-HDM mice treated or not with anti-CXCR2, 2 h before and 4 and 8 h after LPSlo, and 2 h before and 4 h after i.n.sensitization with HDM. d, ELISA measurement of cytokine production by HDM-restimulated BLN cells of mice as in c. e, Inflammatory score estimating perivascular and peribronchial inflammation, quantified from H&E-stained lung sections of mice as in c. f, Representative H&E staining of lung sections of mice as in c. g, Quantification of PAS-stained epithelial cells per bronchi showing airway mucus production in mice as in c. h, Representative PAS staining of lung sections of mice as in c. i, Eosinophil cell counts in the BALF, assessed 3 days after the second HDM administration in mice transferred i.t. with vehicle, LPSlo and LPShi neutrophils and exposed to HDM. j, ELISA measurement of cytokine production by HDM-restimulated BLN cells of mice as in i. k, Inflammatory score estimating perivascular and peribronchial inflammation, quantified from H&E-stained lung sections of mice as in i. l, Representative H&E staining of lung sections of mice as in i. m, Quantification of PAS-stained epithelial cells per bronchi showing airway mucus production in mice as in i. n, Representative PAS staining of lung sections of mice as in i. (b-e,g,i-k,m) Data show mean + s.e.m. and are pooled from (b-e,g) 2 independent experiments, each symbol representing individual mice (n=6/group) or (i-k,m) ≥3 independent experiments, each symbol representing (i,k,m) individual mice (n=9/group) or (j) independent experiments in which cells from 2-3 mice were pooled by group. P values were calculated using using a (b,i-k,m) one-way ANOVA with Tukey's post hoc test, (c) a two-sided unpaired Student's t test or (d-e,g) a two-sided Mann-Whitney test. *P<0.05; **P<0.01; ***P<0.001. ns, not significant. BALF, bronchoalveolar lavage fluid. i.t., intra-tracheal ns, not significant. Scale bar = 32 μm.
Figure 5
Figure 5. NETs mediate low-dose-LPS-triggered type 2 allergic airway inflammation to HDM.
a, Three-dimensional modeling of Cit-H3+MPO+ NETs on lung sections, assessed 24 h after LPSlo in mice treated i.p. with DNAse one day before and at the time of LPSlo treatment, or treated 4 times i.p. with NEi or Cl-amidine, every 12 h starting one day before LPSlo. Pictures are representative of one of 6 lungs analyzed. b, Quantification of NET volume in lung sections of mice as in a. c, Eosinophil cell counts in the BALF, assessed 3 days after the second HDM administration in LPSlo-HDM mice treated i.p. with 4 daily injections of DNAse, starting one day before LPSlo treatment, or treated with 8 i.p. injections of NEi or Cl-amidine, every 12 hours starting one day before LPSlo treatment. d, ELISA measurement of cytokine production by HDM-restimulated BLN cells of mice as in c. e, Inflammatory score estimating perivascular and peribronchial inflammation, quantified from H&E-stained lung sections of mice as in c. f, Representative H&E staining of lung sections of mice as in c. g, Quantification of PAS-stained epithelial cells per bronchi showing airway mucus production in mice as in c. h, Representative PAS staining of lung sections of mice as in c. (b) Data show mean + s.e.m. as well as individual mice (n=6/group). (c-e,g) Data show mean + s.e.m. and are pooled from 3-4 independent experiments, each symbol representing (c,e,g) individual mice (n=9/group) or (d) independent experiments in which cells from 2-3 mice were pooled by group. P values were calculated using a one-way ANOVA with Tukey's post hoc test. *P<0.05; **P<0.01; ***P<0.001. BALF, bronchoalveolar lavage fluid ns, not significant. Scale bars = (a) 10 μm; (f,h) 32 μm.
Figure 6
Figure 6. NETs released by LPSlo neutrophils directly promote HDM uptake by CD11b+Ly-6C+ DCs.
a, Representative gating strategy delineating lung DC subsets in vehicle-AF647-HDM, LPSlo-AF647-HDM and LPShi-AF647-HDM mice, assessed 24 h after i.n. AF647-HDM. Lung cells from a LPSlo-AF647-HDM mouse is shown. DCs were defined as CD45+CD3e-CD19-NK1.1-SiglecF-MHC-II+CD11c+ cells and further divided into CD11b-CD103+, CD11b+Ly-6C- and CD11b+Ly-6C+ DCs. b, Absolute numbers of lung AF647-HDM+ DC subsets in mice as in a. c, Representative dot plots showing AF647-HDM MFI in lung CD11b+Ly-6C+ DCs from mice as in a. d, Absolute numbers of lung CD11b+Ly-6C+AF647-HDM+ DCs, assessed 24 h after i.n. AF647-HDM in LPSlo-AF647-HDM mice treated i.p. with 3 daily injections of DNAse, starting one day before LPSlo treatment, or treated with 5 i.p. injections of NEi or Cl-amidine, every 12 h starting one day before LPSlo treatment. e, Representative gating strategy delineating BMDC subsets. BMDCs were defined as MHC-II+CD11c+ cells and further divided into CD11b+Ly-6C- and CD11b+Ly-6C+ subsets. f, MFI of AF647-HDM (left), % of AF647-HDM+ cells (middle), and CD86 expression in CD11b+Ly-6C+ (top) and CD11b+Ly-6C- (bottom) BMDCs, assessed 12 h after treatment with AF647-HDM and after co-culture with vehicle, LPShi or LPSlo neutrophils in the presence or absence of DNAse. (b,d,f) Data show mean + s.e.m. and are pooled from ≥3 independent experiments, each symbol representing (b,d) independent experiments in which cells from 3-5 mice were pooled by group (b,d: n=3,6, respectively) or (f) independent co-culture experiments (BMDCs; BMDCs+AF647-HDM; BMDCs+PBS neutr.+AF647-HDM; BMDCs+LPSlo neutr.+AF647-HDM; BMDCs+LPSlo neutr.+AF647-HDM+DNAse; BMDCs+ LPShi neutr.+AF647-HDM: n=6;9;4;9;6;4, respectively). P values were calculated using (b) a two-way or (d,f) a one-way ANOVA with Tukey's post hoc test. *P<0.05; **P<0.01; ***P<0.001. BMDCs, bone marrow-derived dendritic cells; MFI, mean fluorescence intensity; ns, not significant.
Figure 7
Figure 7. Influenza virus infection and ozone exposure instruct recruited lung CXCR4hi neutrophils to release NETs.
a,c, Representative histograms of CXCR4, Lamp-1 and CD49d expression by lung CD45+CD11b+Ly-6G+ neutrophils (a) 7 days after influenza virus (PR8) infection or (c) 24 h after 3 daily ozone exposures. b,d, MFI showing quantification of CXCR4, CD49d and Lamp-1 expression by lung CD45+CD11b+Ly-6G+ neutrophils as in a and c, respectively. e,f, Kinetic analysis of CXCR4 expression by bone marrow, blood and lung CD45+CD11b+Ly-6G+ neutrophils after (e) PR8 infection or (f) ozone exposure, as in a. g,k, Levels of extracellular dsDNA in the BALF of (g) PBS-injected and PR8-infected mice, 7 days after PR8, or (k) air- and ozone-exposed mice, 24 h after 3 daily ozone exposures. h,l, ELISA measurement of NE/DNA complexes in the BALF of mice as in g and k, respectively. i,m, Confocal microscopy stainings of Cit-H3+MPO+ NETs on lung sections of mice as in g and k, respectively. Pictures are representative of one of >5 lungs analyzed. j,n, Quantification of NET volume in lung sections of mice as in g and k, respectively. (b,d-i,k-m) Data show mean + s.e.m. and are pooled from (b,d,g-i,k-m) 2-3 independent experiments (b,d,g,h,i,k,l,m: n=6,6,5,5,6,8,5,6) mice/group, respectively), or (e,f) 2 independent experiments per time point analyzed (n=4 mice/time point). P values were calculated using (b,d,g-i,k-m) an unpaired two-tailed Student's t test or (e,f) a one-way ANOVA that compares PR8-infected or ozone-exposed vs. control counterparts. **P<0.01; ***P<0.001. BALF, bronchoalveolar lavage fluid; ns, not significant; OD, optical density. Scale bars = 50 µm.
Figure 8
Figure 8. NETs mediate influenza virus- and ozone-potentiated type 2 allergic airway inflammation to HDM.
a, Eosinophil cell counts in the BALF (left) and ELISA measurement of HDM-specific IgG1 in the serum (right), assessed 3 days after the second HDM administration in vehicle-HDM and PR8-HDM mice treated daily for 12 days with DNAse i.p., starting 5 days after PR8, or treated every 12 h with NEi or Cl-amidine i.p., for the same duration as for DNAse. b, ELISA measurement of cytokine production by HDM-restimulated BLN cells of mice as in a. c, Quantification of PAS-stained epithelial cells per bronchi showing airway mucus production in mice as in a. d, Representative PAS staining of lung sections of mice as in a. e, Absolute numbers of lung CD11b+Ly-6C+AF647-HDM+ DCs assessed 8 days after PR8 and 24 h after AF647-HDM in vehicle-AF647-HDM and PR8-AF647-HDM mice treated daily for 3 days with DNAse i.p., starting 5 days after PR8, or treated every 12 h with NEi or Cl-amidine i.p., for the same duration as for DNAse. f, Eosinophil cell counts in the BALF (left) and ELISA measurement of HDM-specific IgG1 in the serum (right), assessed 3 days after the second HDM administration in vehicle-HDM and ozone-HDM mice treated daily for 4 days with DNAse i.p., starting the first day of ozone exposure, or treated every 12 h with NEi or Cl-amidine i.p., for the same duration as for DNAse. g, ELISA measurement of cytokine production by HDM-restimulated BLN cells of mice as in f. h, Quantification of PAS-stained epithelial cells per bronchi showing airway mucus production in mice as in f. i, Representative PAS staining of lung sections of mice as in f. j, Absolute numbers of lung CD11b+Ly-6C+AF647-HDM+ DCs assessed 2 days after the last ozone exposure and 24 h after AF647-HDM in mice as in f. (a-c,e,f-h,j) Data show mean + s.e.m. and are pooled from 2-3 independent experiments, each symbol representing (a,c,f,h) individual mice (a,b,e,g,h,k: n=9,9,6,6 mice/group, respectively) or (b,e,g,j) independent experiments in which cells from 2-4 mice were pooled by group. P values were calculated using a one-way ANOVA with Tukey's post hoc test. *P<0.05; **P<0.01; ***P<0.001. BALF, bronchoalveolar lavage fluid; a.u., arbitrary unit; ns, not significant. Scale bar = 32 µm.

References

    1. Braman SS. The global burden of asthma. Chest. 2006;130:4s–12s. - PubMed
    1. Galli SJ, Tsai M, Piliponsky AM. The development of allergic inflammation. Nature. 2008;454:445–54. - PMC - PubMed
    1. Vercelli D. Discovering susceptibility genes for asthma and allergy. Nat Rev Immunol. 2008;8:169–82. - PubMed
    1. Eder W, Ege MJ, von Mutius E. The asthma epidemic. N Engl J Med. 2006;355:2226–35. - PubMed
    1. Platts-Mills TA. The allergy epidemics: 1870-2010. J Allergy Clin Immunol. 2015;136:3–13. - PMC - PubMed

Publication types

MeSH terms