. 2019 Nov;16(11):1139-1145.
doi: 10.1038/s41592-019-0576-7. Epub 2019 Oct 7.

Exploring single-cell data with deep multitasking neural networks

Affiliations

Exploring single-cell data with deep multitasking neural networks

Matthew Amodio et al. Nat Methods. 2019 Nov.

Abstract

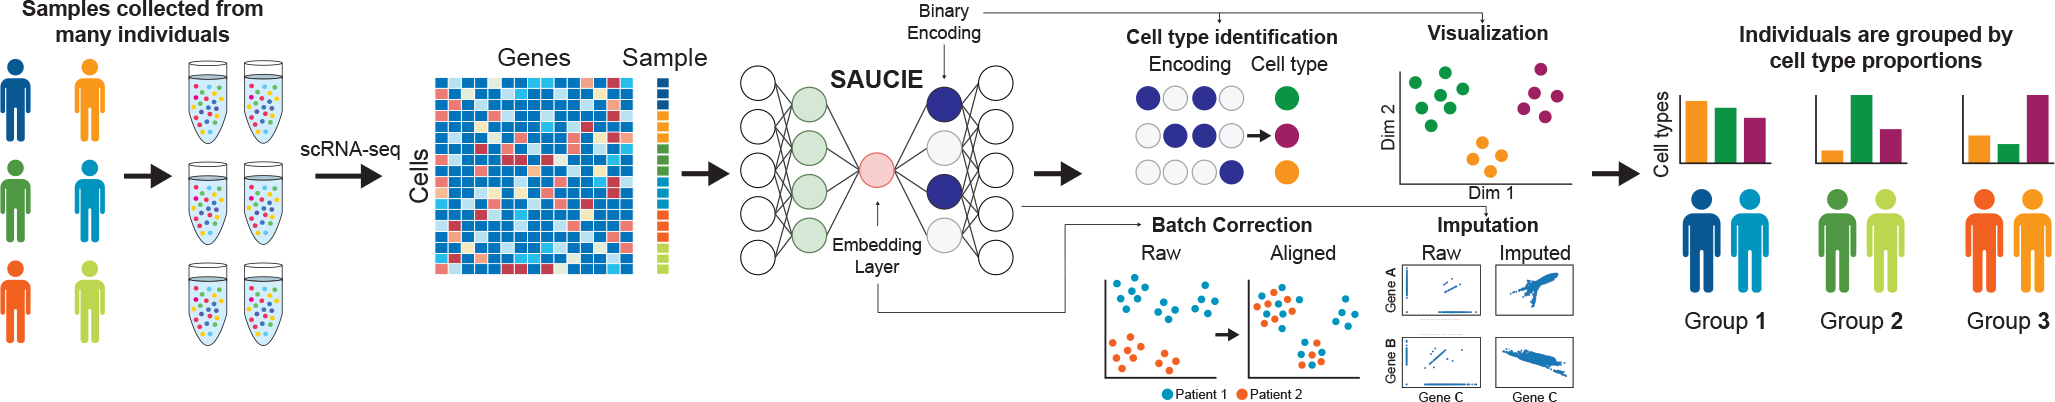
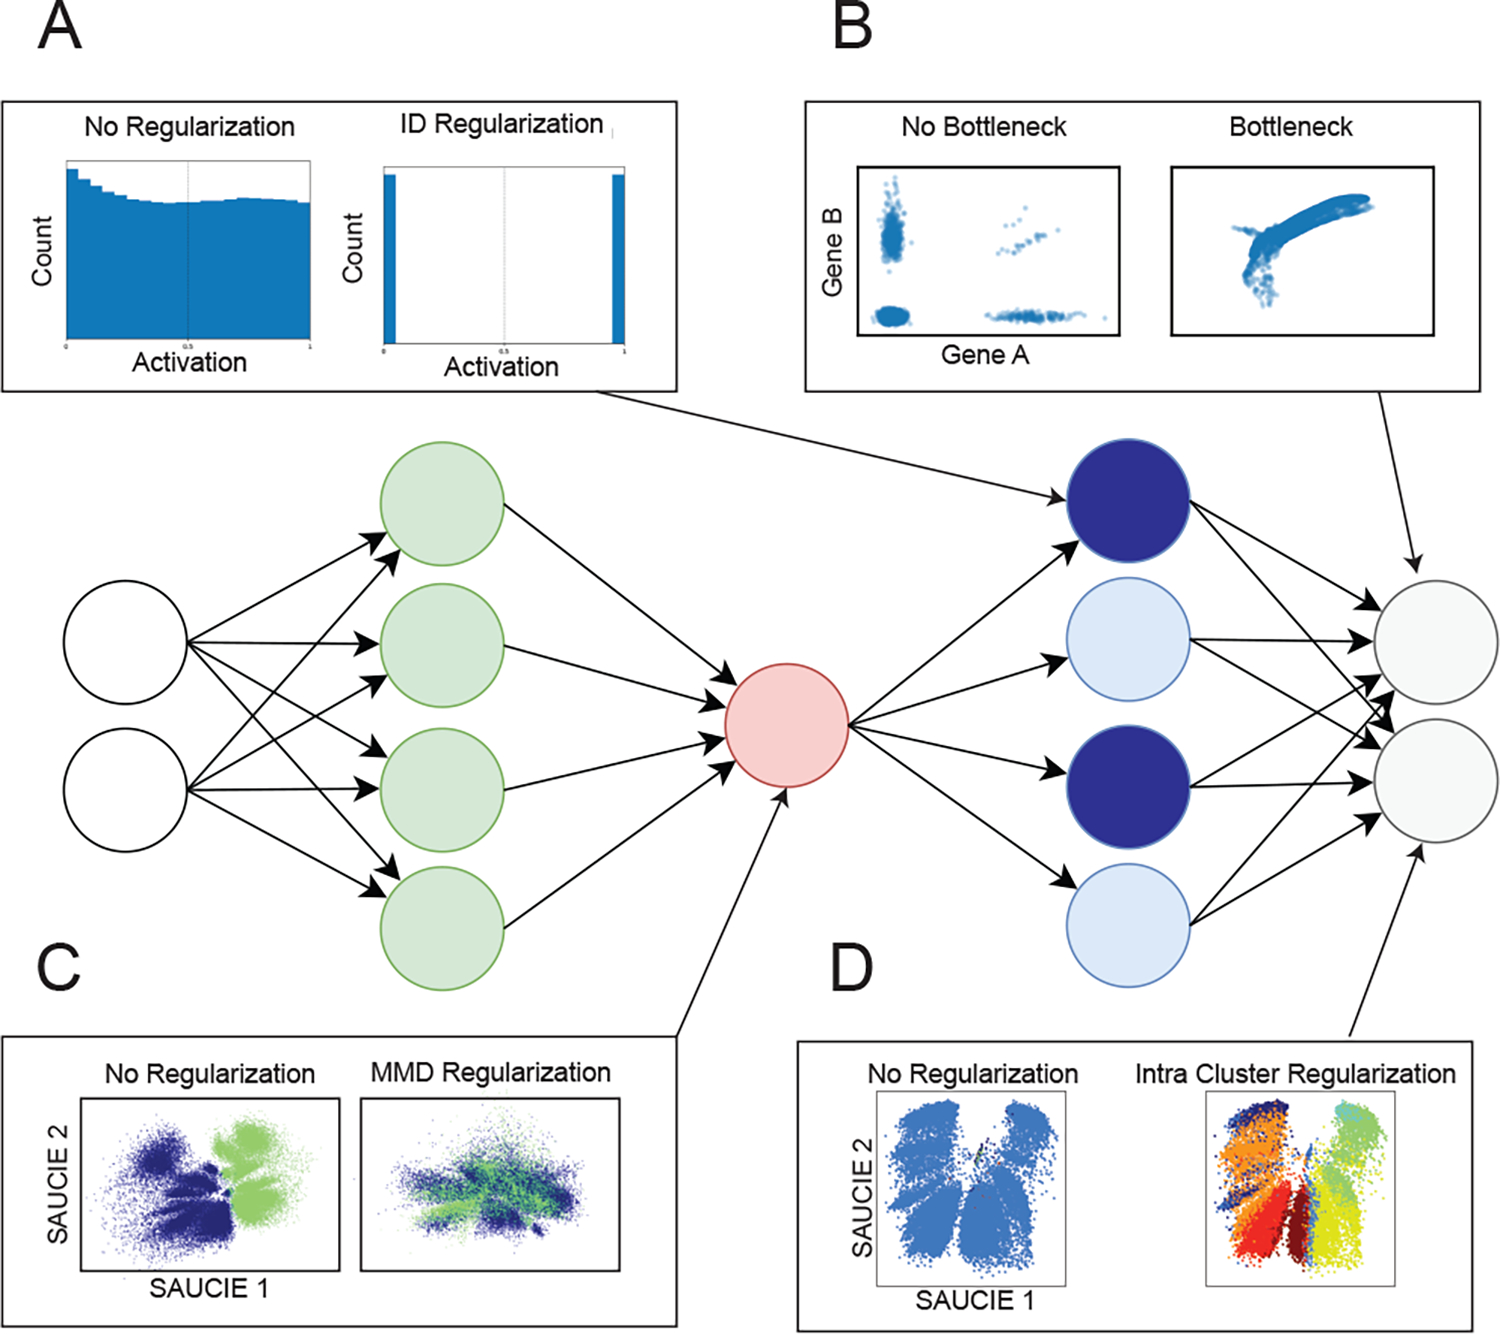
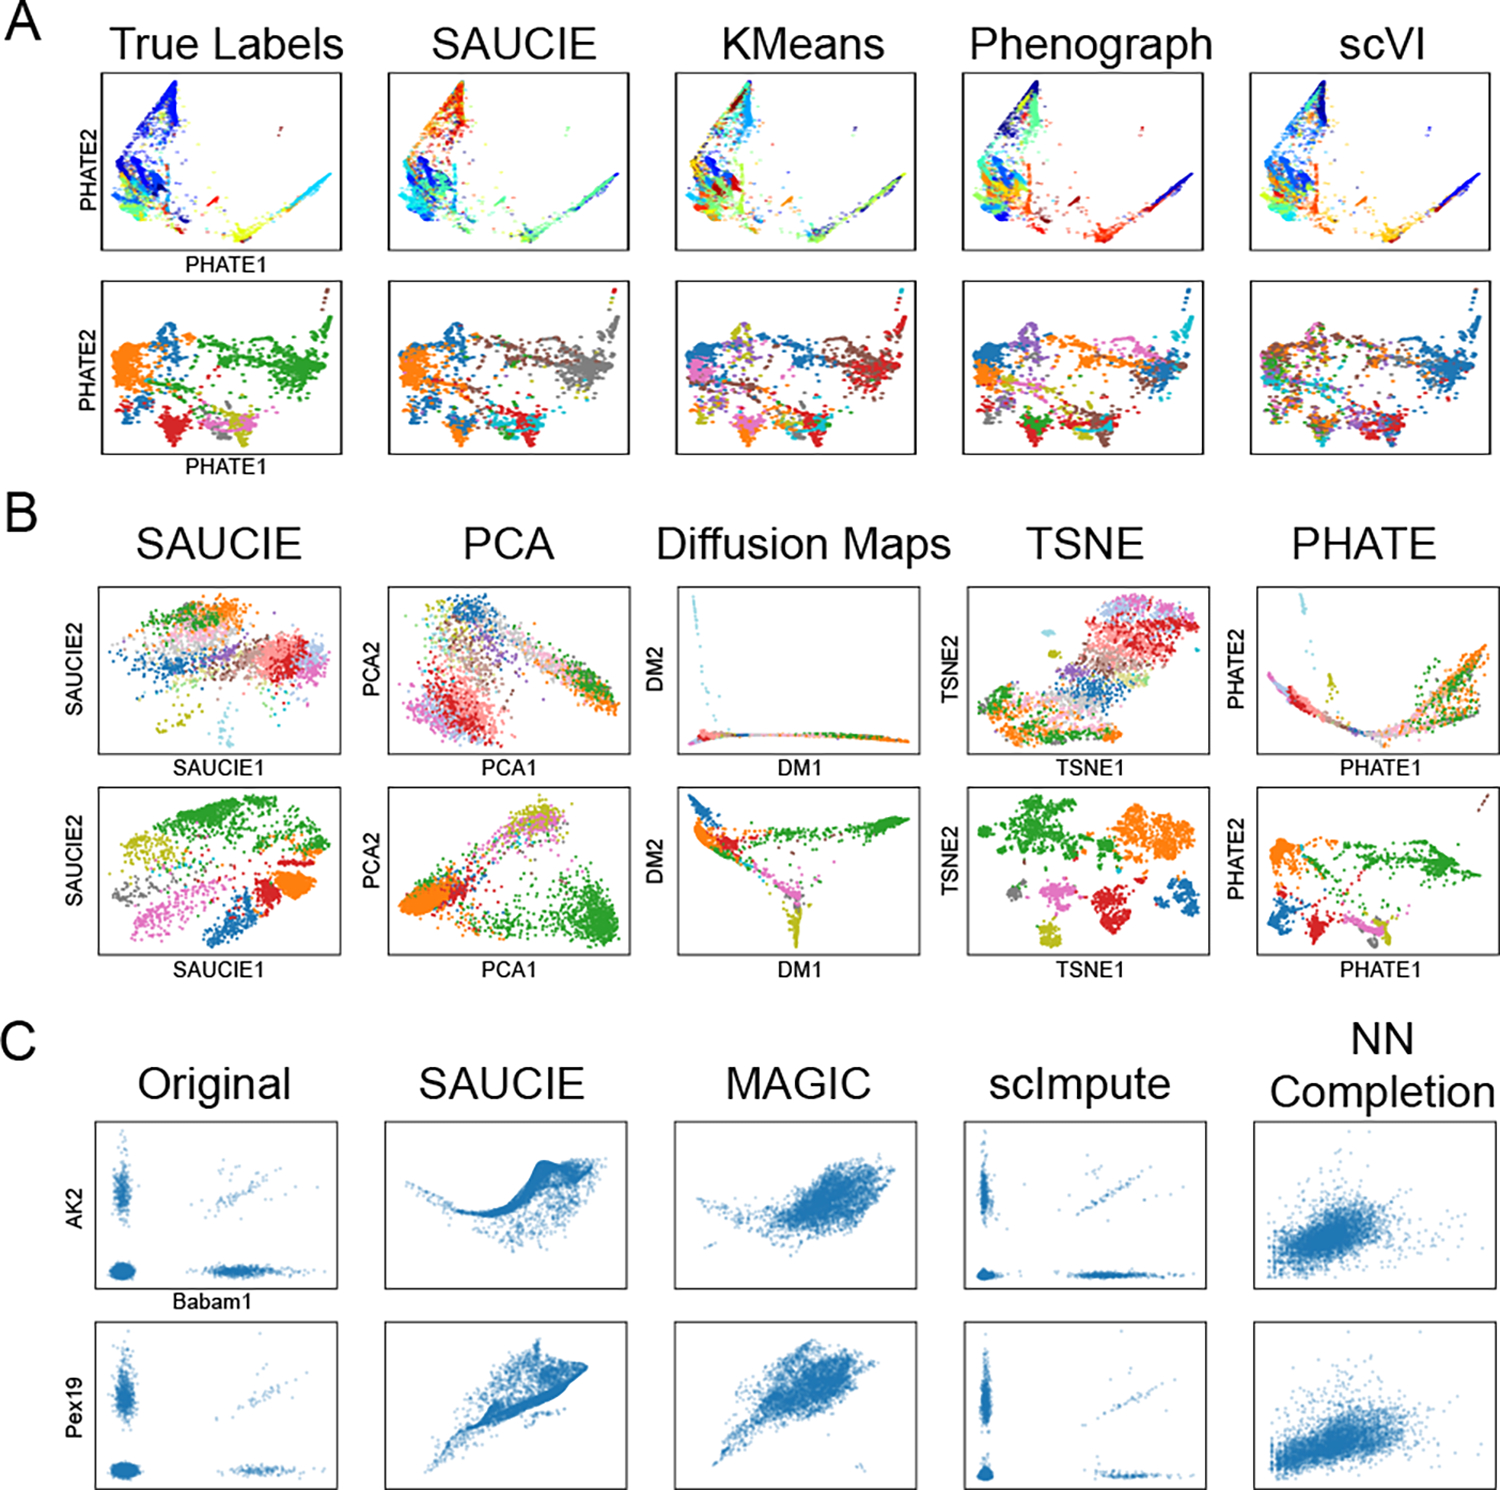
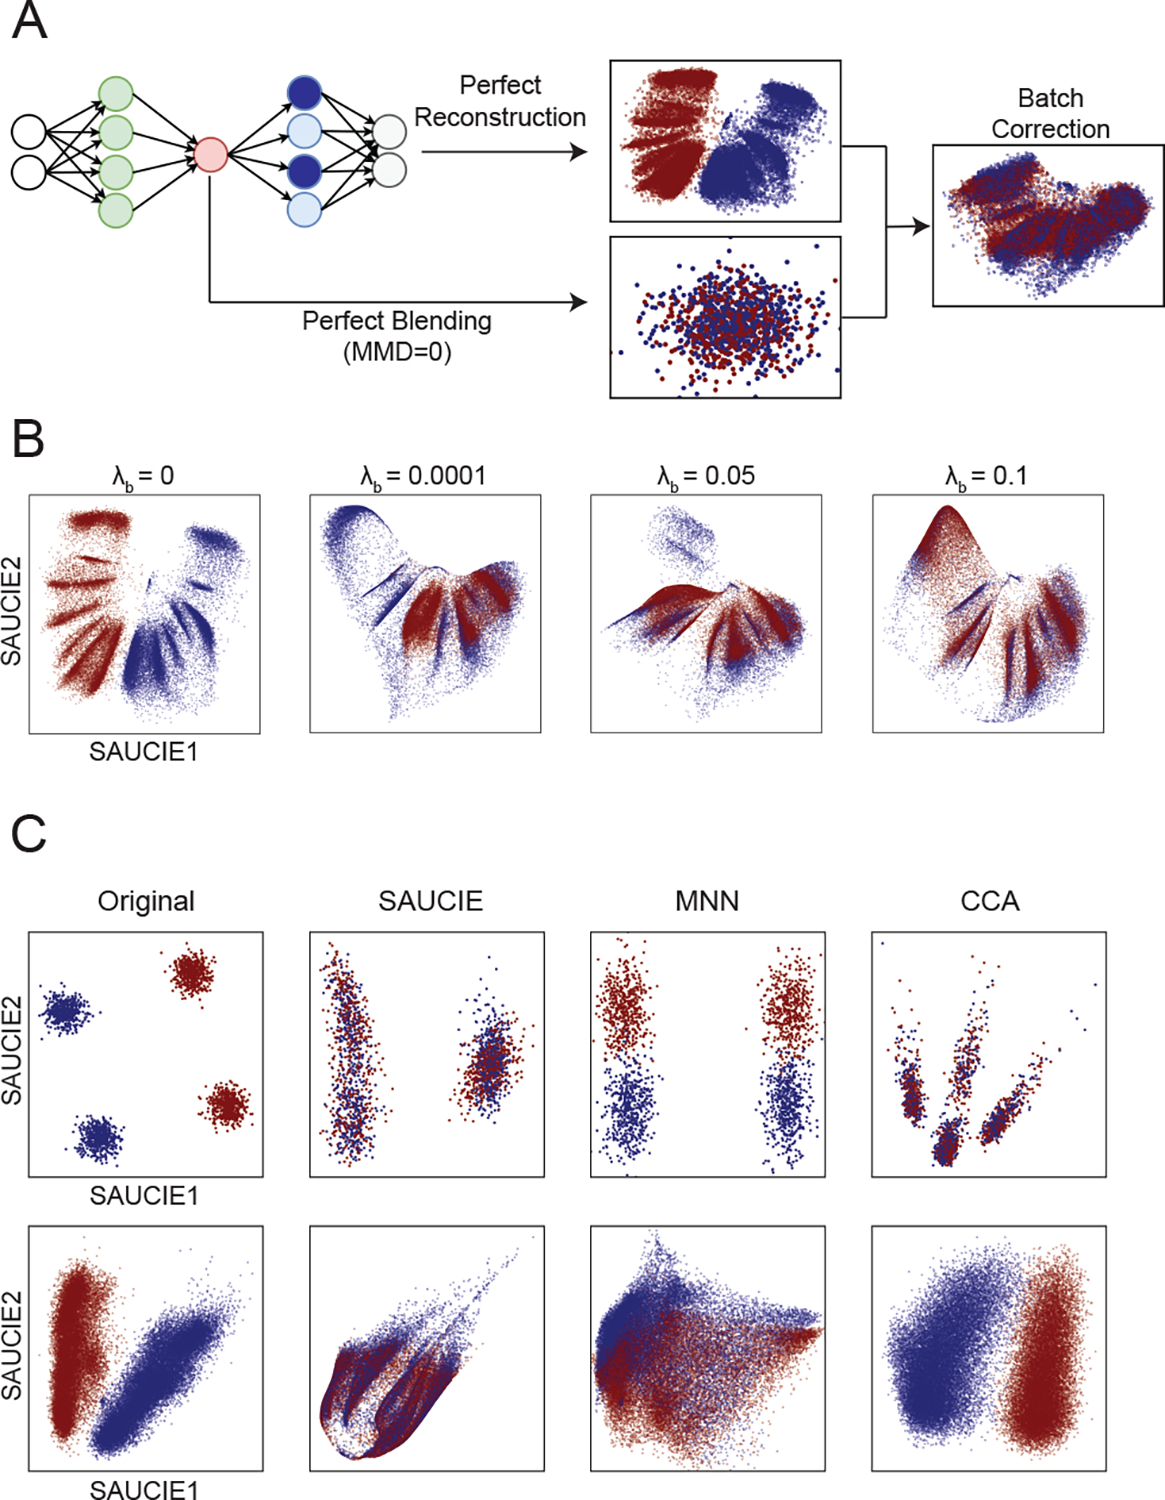
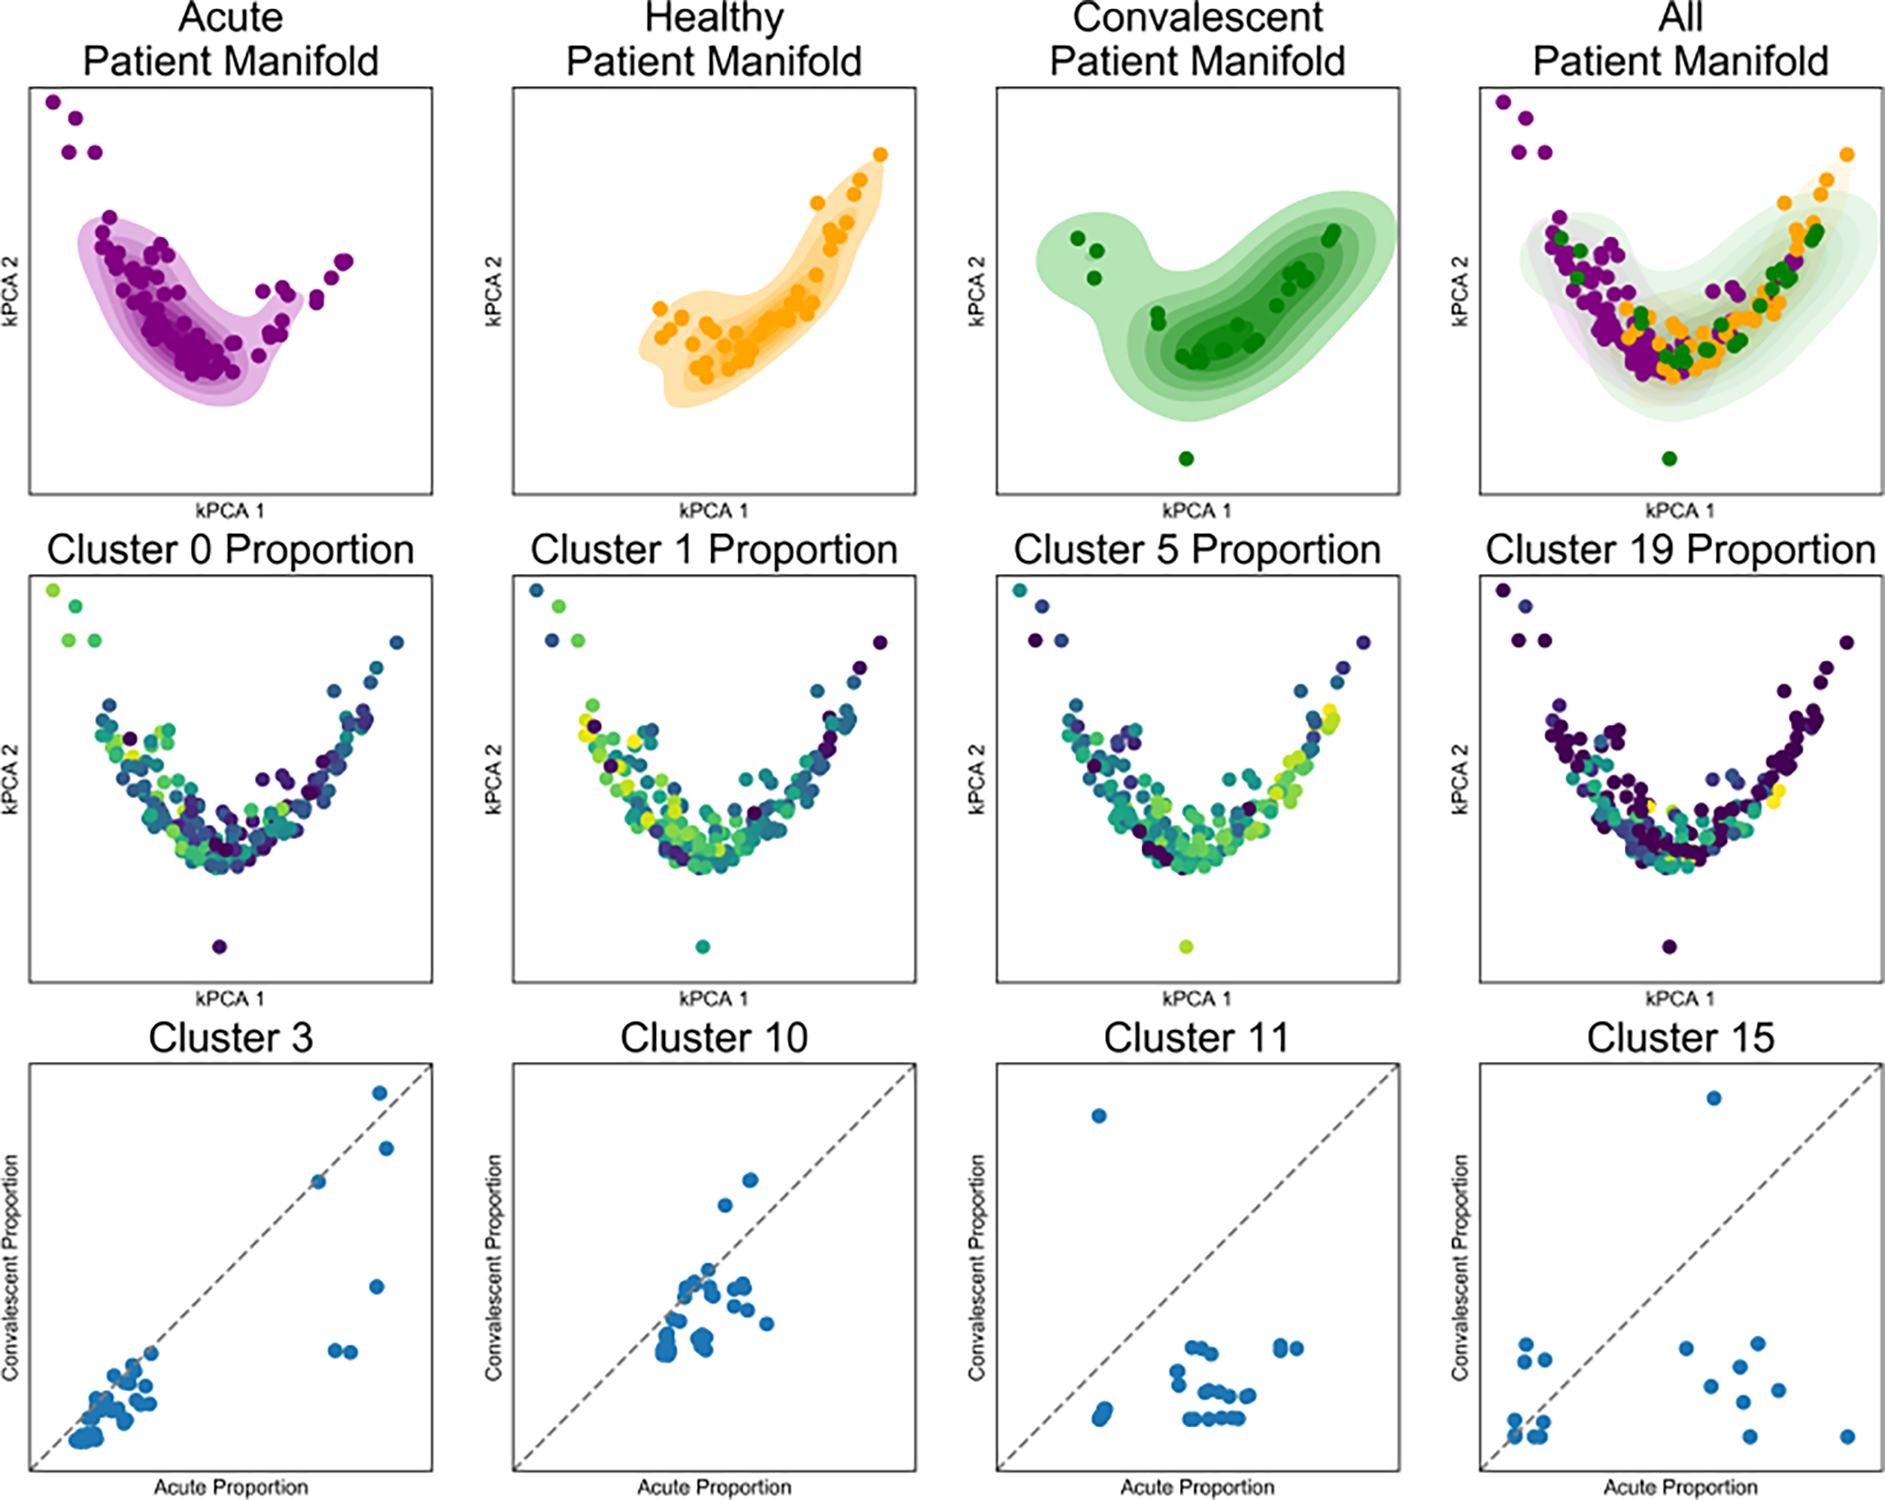
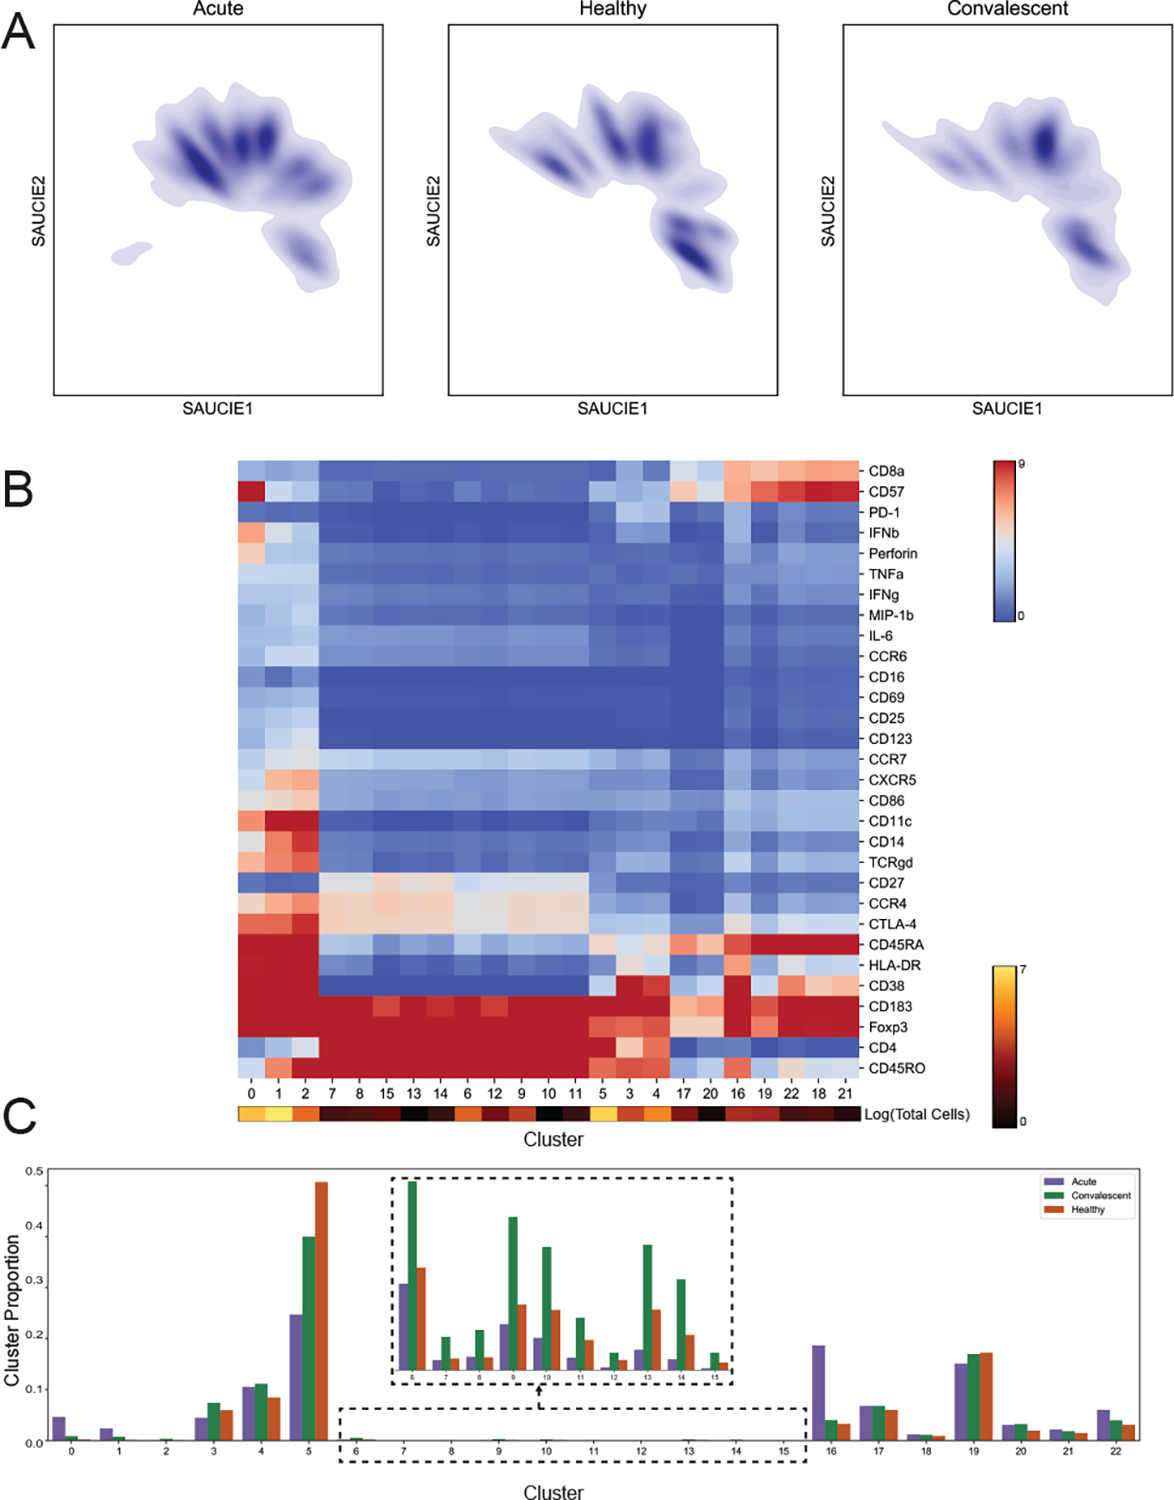
It is currently challenging to analyze single-cell data consisting of many cells and samples, and to address variations arising from batch effects and different sample preparations. For this purpose, we present SAUCIE, a deep neural network that combines parallelization and scalability offered by neural networks, with the deep representation of data that can be learned by them to perform many single-cell data analysis tasks. Our regularizations (penalties) render features learned in hidden layers of the neural network interpretable. On large, multi-patient datasets, SAUCIE's various hidden layers contain denoised and batch-corrected data, a low-dimensional visualization and unsupervised clustering, as well as other information that can be used to explore the data. We analyze a 180-sample dataset consisting of 11 million T cells from dengue patients in India, measured with mass cytometry. SAUCIE can batch correct and identify cluster-based signatures of acute dengue infection and create a patient manifold, stratifying immune response to dengue.


Conflict of interest statement

Competing Financial Interests Statement

There are no competing interests.

Figures

Figure 1
Figure 1
The pipeline for analyzing single-cell data in large cohorts with SAUCIE. Many individual patients are separately measured with a single-cell technology such as CyTOF or scRNA-seq, producing distinct datasets for each patient. SAUCIE performs imputation and denoising, batch effect removal, clustering, and visualization on the entire cohort with a unified model and is able to provide interpretable, quantifiable metrics on each subject or group of subjects.
Figure 2
Figure 2
Regularizations and architecture choices in SAUCIE. A) the ID regularization applied on the sparse encoding layer produces digital codes for clustering B) the informational bottleneck, i.e. a smaller embedding layer, uses dimensionality reduction to produce denoised data at the output C) the MMD regularization removes batch artifacts D) the within cluster distance regularization applied to the denoised data provides coherent clusters.
Figure 3
Figure 3
A comparison of the different analysis tasks performed by SAUCIE against other methods. A) A comparison of clustering performance on the data from Shekhar et al (top) and Zeisel et al (bottom) with samples of size 27499 and 3005, respectively. B) A comparison of SAUCIE’s visualization on the same datasets as part (A). C) A comparison of imputation on the 10x mouse dataset subset of size 4142.
Figure 4
Figure 4
Demonstration of SAUCIE’s batch correction abilities. A) SAUCIE batch correction balances perfect reconstruction (which would leave the batches uncorrected) with perfect blending (which would remove all of the original structure in the data) to remove the technical variation while preserving the biological variation. B) The effect of increasing the magnitude of the MMD regularization on the dengue data of size 41721. Sufficient MMD regularization is capable of fully removing batch effect. C) Results of batch correction on the synthetic GMM data (of size 2000) (top) and the dengue data (bottom) shows that SAUCIE better removes batch effects than MNN and better preserves the structure of the data than CCA.
Figure 5
Figure 5
SAUCIE produces patient manifolds from single-cell cluster signatures. SAUCIE on the entire dengue dataset of 11228838 cells. Top row) The patient manifold identified by SAUCIE cluster proportions, visualized by kernel PCA with acute, healthy, convalescent, and all subjects combined from left to right. The healthy manifold overlaps with the convalescent manifold to a much higher degree than the acute manifold. Middle row) The same patient manifold shown colored by each patient’s cluster proportion. Cluster 1 is more prevalent in acute, cluster 3 in healthy, cluster 5 is ubiquitous, and cluster 9 is rare and in acute patients. Bottom row) A comparison of the cluster proportion for acute (X-axis) versus convalescent (Y-axis) for patients that have matched samples.
Figure 6
Figure 6
SAUCIE identifies and characterizes cellular clusters, whose proportions can be used to compare patients. SAUCIE on the entire dengue dataset of 11228838 cells. A) The cell manifolds identified by the two-dimensional SAUCIE embedding layer for the T lymphocyte subsets from acute, healthy, and convalescent subjects. B) A heatmap showing clusters along the horizontal axis and markers along the vertical axis. Cluster sizes are represented as a color bar beneath the heatmap. C) Cluster proportions for acute, convalescent, and healthy patients.

References

    1. Tan J, Doing G, Lewis KA, Price CE, Chen KM, Cady KC, Perchuk B, Laub MT, Hogan DA, and Greene CS, “Unsupervised extraction of stable expression signatures from public compendia with an ensemble of neural networks,” Cell systems, vol. 5, no. 1, pp. 63–71, 2017. - PMC - PubMed
    1. Way GP and Greene CS, “Extracting a biologically relevant latent space from cancer transcriptomes with variational autoencoders,” bioRxiv, p. 174474, 2017. - PMC - PubMed
    1. Wang W, Huang Y, Wang Y, and Wang L, “Generalized autoencoder: A neural network framework for dimensionality reduction,” in CVPR Workshops, 2014.
    1. Tan J, Ung M, Cheng C, and Greene CS, “Unsupervised feature construction and knowledge extraction from genome-wide assays of breast cancer with denoising autoencoders,” in Pacific Symposium on Biocomputing Co-Chairs, pp. 132–143, World Scientific, 2014. - PMC - PubMed
    1. Tan J, Hammond JH, Hogan DA, and Greene CS, “Adage-based integration of publicly available pseudomonas aeruginosa gene expression data with denoising autoencoders illuminates microbe-host interactions,” MSystems, vol. 1, no. 1, pp. e00025–15, 2016. - PMC - PubMed

Methods-only References

    1. Moon KR, Stanley J, Burkhardt D, van Dijk D, Wolf G, and Krishnaswamy S, “Manifold learning-based methods for analyzing single-cell RNA-sequencing data,” Current Opinion in Systems Biology, 2017.
    1. Moon KR, van Dijk D, Wang Z, Chen W, Hirn MJ, Coifman RR, Ivanova NB, Wolf G, and Krishnaswamy S, “PHATE: A dimensionality reduction method for visualizing trajectory structures in high-dimensional biological data,” bioRxiv, p. 120378, 2017.
    1. Montufar GF, Pascanu R, Cho K, and Bengio Y, “On the number of linear regions of deep neural networks,” in Advances in neural information processing systems, pp. 2924–2932, 2014.
    1. Anand K, Bianconi G, and Severini S, “Shannon and von Neumann entropy of random networks with heterogeneous expected degree,” Physical Review E, vol. 83, no. 3, p. 036109, 2011. - PubMed
    1. Levine JH, Simonds EF, Bendall SC, Davis KL, El-ad DA, Tadmor MD, Litvin O, Fienberg HG, Jager A, Zunder ER, et al., “Data-driven phenotypic dissection of AML reveals progenitor-like cells that correlate with prognosis,” Cell, vol. 162, no. 1, pp. 184–197, 2015. - PMC - PubMed

Publication types