. 2019 Nov;16(11):1169-1175.
doi: 10.1038/s41592-019-0586-5. Epub 2019 Oct 7.

Engineering of human brain organoids with a functional vascular-like system

Affiliations

Engineering of human brain organoids with a functional vascular-like system

Bilal Cakir et al. Nat Methods. 2019 Nov.

Abstract

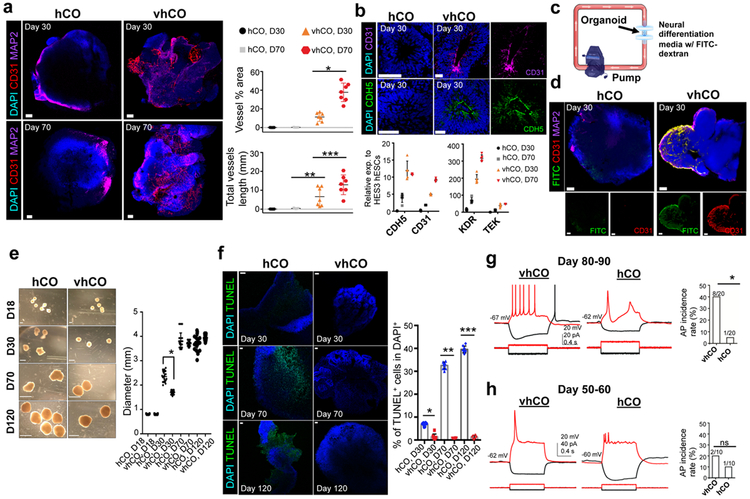
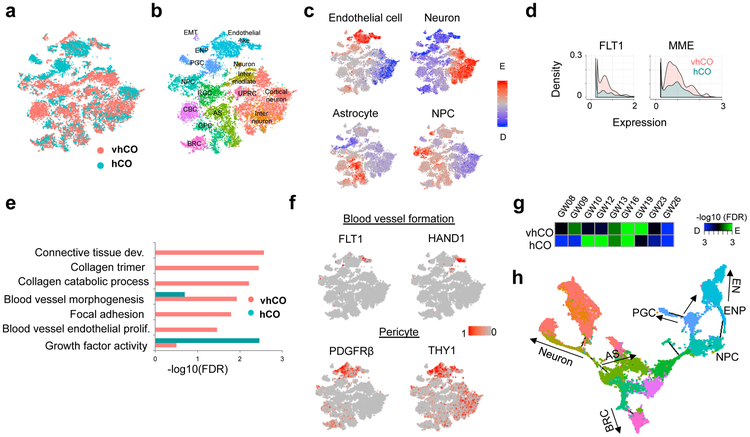
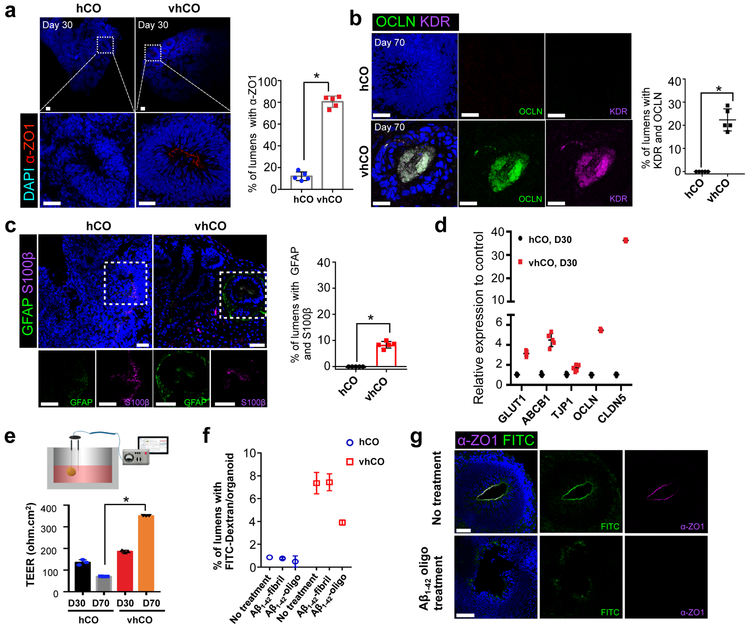
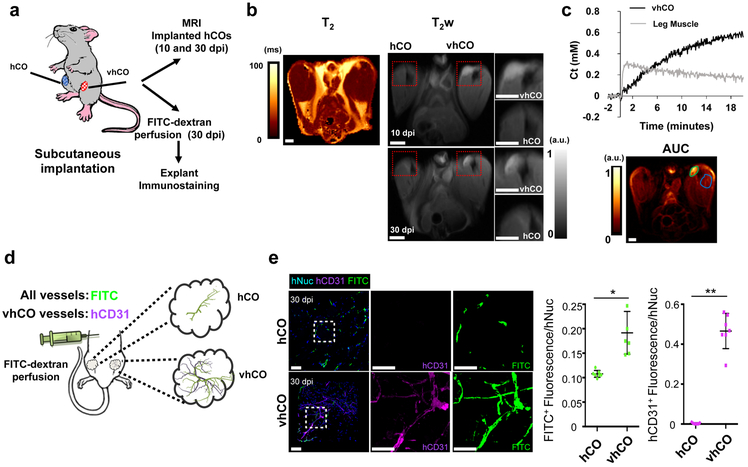
Human cortical organoids (hCOs), derived from human embryonic stem cells (hESCs), provide a platform to study human brain development and diseases in complex three-dimensional tissue. However, current hCOs lack microvasculature, resulting in limited oxygen and nutrient delivery to the inner-most parts of hCOs. We engineered hESCs to ectopically express human ETS variant 2 (ETV2). ETV2-expressing cells in hCOs contributed to forming a complex vascular-like network in hCOs. Importantly, the presence of vasculature-like structures resulted in enhanced functional maturation of organoids. We found that vascularized hCOs (vhCOs) acquired several blood-brain barrier characteristics, including an increase in the expression of tight junctions, nutrient transporters and trans-endothelial electrical resistance. Finally, ETV2-induced endothelium supported the formation of perfused blood vessels in vivo. These vhCOs form vasculature-like structures that resemble the vasculature in early prenatal brain, and they present a robust model to study brain disease in vitro.


Figures

Figure 1.
Figure 1.. Characterization of vasculature in vhCOs.
(a) Left, immunostaining of whole mount vhCOs and control hCOs at the different time point (30-day and 70-day) for CD31 and MAP2. Right, AngioTool analysis indicating the abundance and type of vasculature in hCOs. Data represent the mean ± SEM (n=7, from three independent batches). (*p=0.00003699, and **p=0.00064, ***p=0.0403) (b) Top, immunostaining for CD31 and CDH5 reveals the production of endothelial cells in sectioned-vhCOs at day 30. CD31 and CDH5 were present at lumens of ventricular zone in sectioned vhCOs while they were not found in control hCOs. Bottom, expression of endothelial genes from organoids at day 30 and day 70 was measured relative to HES3 hESCs. Data represent the mean ± SEM (n=5, from three independent batches). (c) Illustration of FITC-dextran perfusion into organoids via bioreactor with the flow rate of 0.88 ml/min. (d) Immunostaining of whole mount FITC-dextran perfused vhCOs and control hCOs for CD31. Representative images were shown (N=5, from three independent batches). (e) Left, morphology and size of the control hCOs and vhCOs after 120-day culture. Right, quantification of diameter (mm) from organoids at different stages (n=20, *p=0.000045, from four independent batches) (Mean values of hCO at day 18, 30, 70, 120 are 0.803, 2.354, 3.802 and 3.731 mm, respectively, and mean values of vhCO at day 18, 30, 70, 120 are 0.831, 1.695, 3.697 and 3.938 mm, respectively). Error bar represents the ± SEM. (f) Left, TUNEL staining of organoids after 30-, 70- and 120-day culture. Right, quantification of TUNEL+/DAPI+ cells indicated that the increase in cell death at the center of control hCOs at day 70 and 120 was dramatically reduced in vhCOs. Data represent the mean ± SEM (n=8, from three independent batches). (D30: T=9.97 DF=4 and *p=0.000096, D70: T=26.02 DF=4 and **p=0.000012, D120: T=34.78 DF=4 and ***p=00000408). (g-h) Left, voltage traces of current-clamp recordings of a cell in control hCOs and in vhCOs at day 80-90 (g) and day 50-60 (h) in response to hyperpolarizing (−10 pA) and depolarizing (+5 pA or +10 pA) current steps. Right, bar graph shows the difference in AP incidence rate between control hCOs and vhCOs. *p<0.05 in g and p<0.5 in h. The scale bar represents 100 μm in a, d, and 50 μm in f, b, and 1, 2 and 4 mm at day 18, 30, and 70 and 120, respectively in e. The unpaired two-tail t-test was used for all comparisons.
Figure 2.
Figure 2.. Single cell analysis of vhCOs.
(a-b) t-distributed Stochastic Neighbor Embedding (tSNE) plot of single cells distinguished by a. organoid type and b. cell annotation. RGC: radial glia cell, GPC: glia progenitor cell, NPC: neuronal progenitor cell, CBC: Cilium-bearing cell, BRC: BMP signal-related cell, EN: endothelial-like cell, ENP: endothelial-like progenitor, PGC: proteoglycan-expressing cell, EMT: epithelial-mesenchymal transition-related cell, UPRC: unfolded protein response-related cell. Data are representative of 20026 cells. (c) Enrichment of gene signatures for endothelial cells, neuron, NPC, astrocyte and oligodendrocyte. Data are representative of 20026 cells. (d) Histogram of gene expression related to vasculogenesis. Two-sided T test p-value=2.96e-6 (FLT1) and 4.68e-14 (MME). Statistical significance was calculated by hypergeometric test and adjusted by Benjamini-Hochberg procedure. Data are representative of 2257 cells. (e) GO enrichment for differentially-expressed genes in endothelial-like clusters between vhCO and control hCO. Data are representative of 2257 cells. (f) tSNE plot showing gene expression related to blood vessel formation and pericyte. Data are representative of 20026 cells. (g) Estimation of neurodevelopmental stage by enrichment of vhCO- and control hCO-specific genes. (h) Monocle-based trajectory analysis of vascularized organoid, vhCO.
Figure 3.
Figure 3.. The vhCOs demonstrate BBB characteristics.
(a) Left, immunostaining showed that α-ZO1 was present in most lumens of vhCOs. Right, quantification of lumens with α-ZO1. Data represent the mean ± SEM (n=5, from three independent batches). Unpaired two-tail t-test was used for comparison (T=10 DF=2 and *p<0.0001). (b) Top, co-immunostaining for OCLN and KDR indicates that they are co-localized at the lumen of vhCOs day 70. Bottom, quantification of lumens stained with both OCLN and KDR. Data represent the mean ± SEM (n=5, from three independent batches). Unpaired two-tail t-test was used for comparison (T=9.77 DF=4 and *p=0.0006). (c) Left, co-immunostaining for GFAP and S100β indicates that they are co-localized at the lumen of vhCOs at day 70. Right, quantification of lumens stained with both GFAP and S100β. Data represent the mean ± SEM (n=5, from three independent batches). Unpaired two-tail t-test was used for comparison (T=16 DF=4 and *p=0.00009). (d) Expression of markers for tight junction and transporters from control hCOs and vhCOs at day 30. Data represent the mean ± SEM (n=5, from three independent batches). (e) Left, depiction of TEER analysis from hCOs. Right, TEER was measured in hCOs at day 30 and 70. TEER was sharply increased from vhCOs at day 70. Data represent the mean ± SEM (n=3, from three independent batches). (f) Aβ1-42 treatment of hCOs induces a decrease in FITC-dextran filled lumens. Organoids were incubated with 10 μM Aβ1-42 (Aβ1-42-fibril and Aβ1-42-oligo) for 48h, and then FITC-dextran perfusion was performed. FITC-dextran filled lumens were significantly decreased in vhCOs treated with Aβ1–42-oligo. Data represent the mean ± SEM (n=6, from three independent batches, *p<0.000001). (g) Immunostaining for tight junction marker α-ZO1 in the FITC-dextran perfused vhCOs with or without Aβ1-42-oligo treatment. Data are representative of three independent experiments. The scale bar represents 50 μm in a, b, c and g.
Figure 4.
Figure 4.. The vhCOs possess functional vascular system.
(a) Depiction of subcutaneous implantation of control hCOs and vhCOs in the right and left leg of immune-deficient mice. (b) Left, in vivo T2 map of the implanted control hCOs and vhCOs. Right, anatomical image of hCOs after 10- and 30-day post-implantation (dpi). Both images detected the vhCO region, but area of implanted control hCO was not apparent. Data are representative of three independent experiments. (c) Top, tissue concentration of gadolinium contrast agent as a function of time in the left leg muscle (gray trace) and implanted vhCOs (black trace). Muscle tissue indicates a rapid uptake and backflow into the vasculature, but vhCOs showed a slower and irreversible uptake. Bottom, map of the area under the curve (AUC) of the concentration curve, with ROIs outlined for the vhCOs (green) and muscle (blue). Data are representative of three independent experiments. (d) Schematic of the method for FITC-dextran perfusion. Host blood vessels are filled with FITC-dextran, shown green, and endogenous vessels in vhCOs were shown as magenta. (e) Explanted organoids from FITC-perfused mice were stained for human-specific CD31 and hNuclei at day 30 dpi. The scale bar represents 50 μm, n=3 animals and 3 organoids from three independent batches for MRI and n=7 animals and 7 organoids from four independent batches for FITC-perfusion (*p=0.00412, **p=0.000183, the unpaired two-tail t-test was used for all comparisons). Mean ± SEM are shown.

References

    1. Lancaster MA et al. Cerebral organoids model human brain development and microcephaly. Nature 501, 373 (2013). - PMC - PubMed
    1. Paşca AM et al. Functional cortical neurons and astrocytes from human pluripotent stem cells in 3D culture. Nature methods 12, 671 (2015). - PMC - PubMed
    1. Qian X et al. Brain-region-specific organoids using mini-bioreactors for modeling ZIKV exposure. Cell 165, 1238–1254 (2016). - PMC - PubMed
    1. Pașca SP The rise of three-dimensional human brain cultures. Nature 553, 437 (2018). - PubMed
    1. Quadrato G, Brown J & Arlotta P The promises and challenges of human brain organoids as models of neuropsychiatric disease. Nature medicine 22, 1220 (2016). - PubMed

Publication types

LinkOut - more resources