. 2019 Oct;25(10):1615-1626.
doi: 10.1038/s41591-019-0579-z. Epub 2019 Oct 7.

Genome-wide germline correlates of the epigenetic landscape of prostate cancer

Affiliations

Genome-wide germline correlates of the epigenetic landscape of prostate cancer

Kathleen E Houlahan et al. Nat Med. 2019 Oct.

Abstract

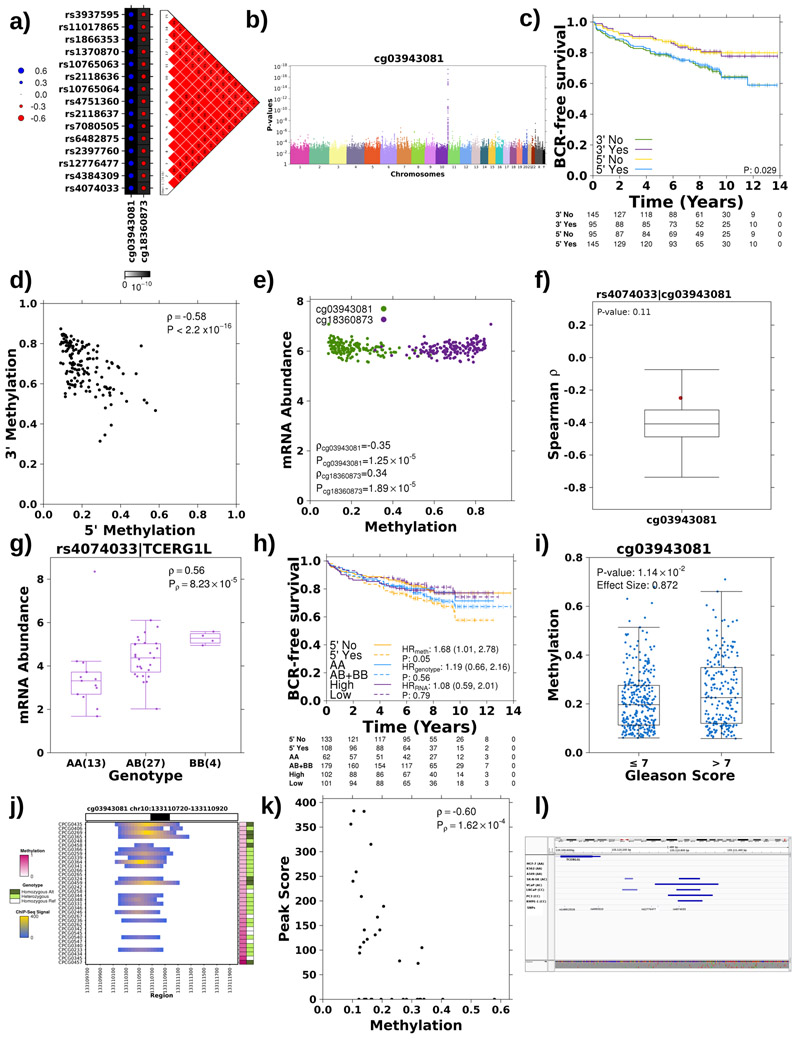
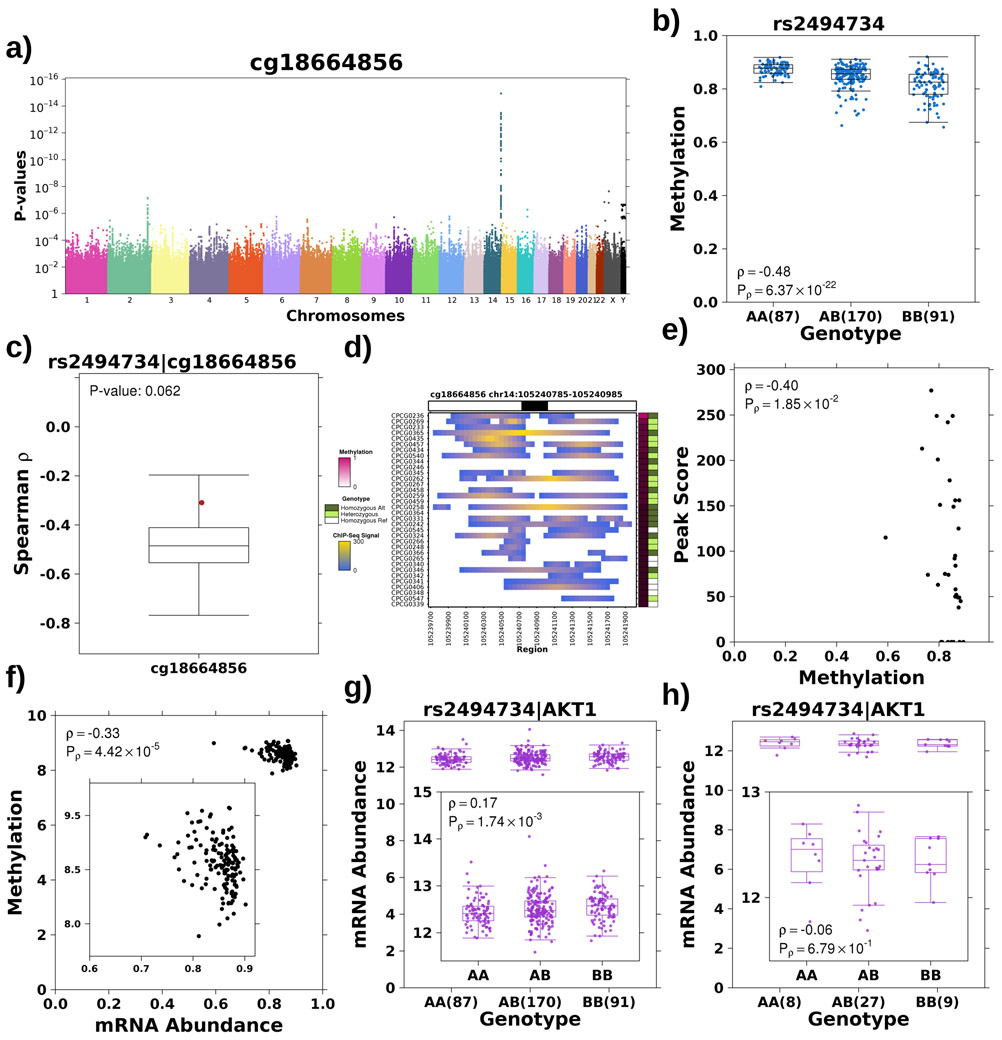
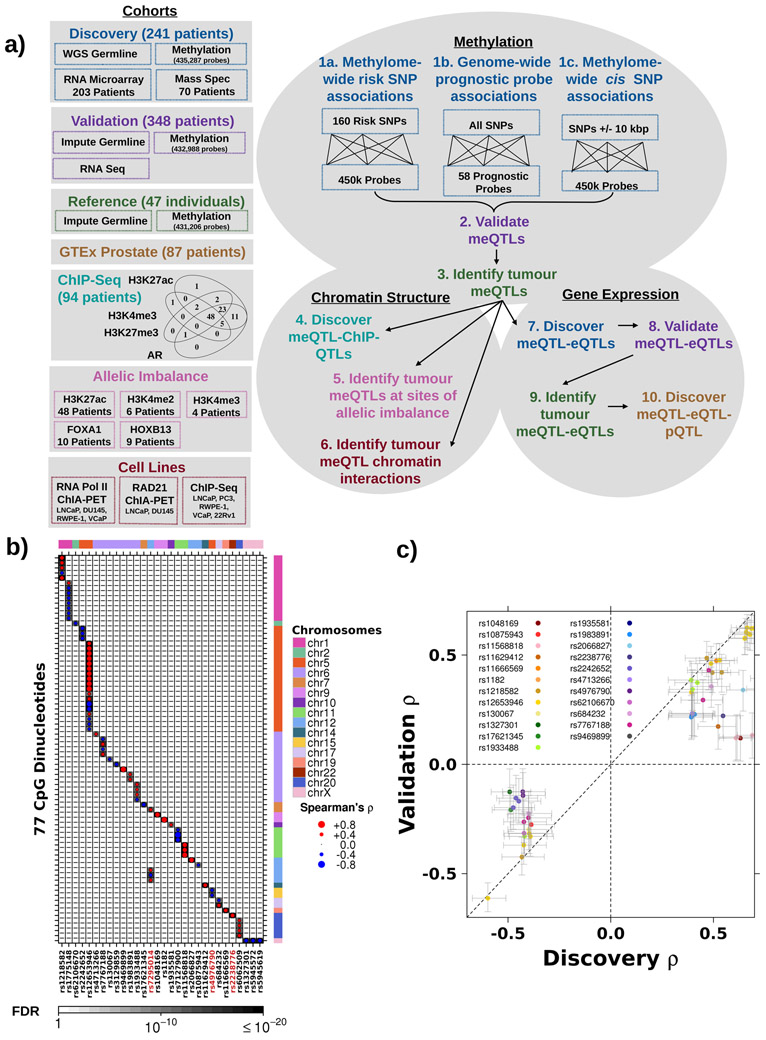
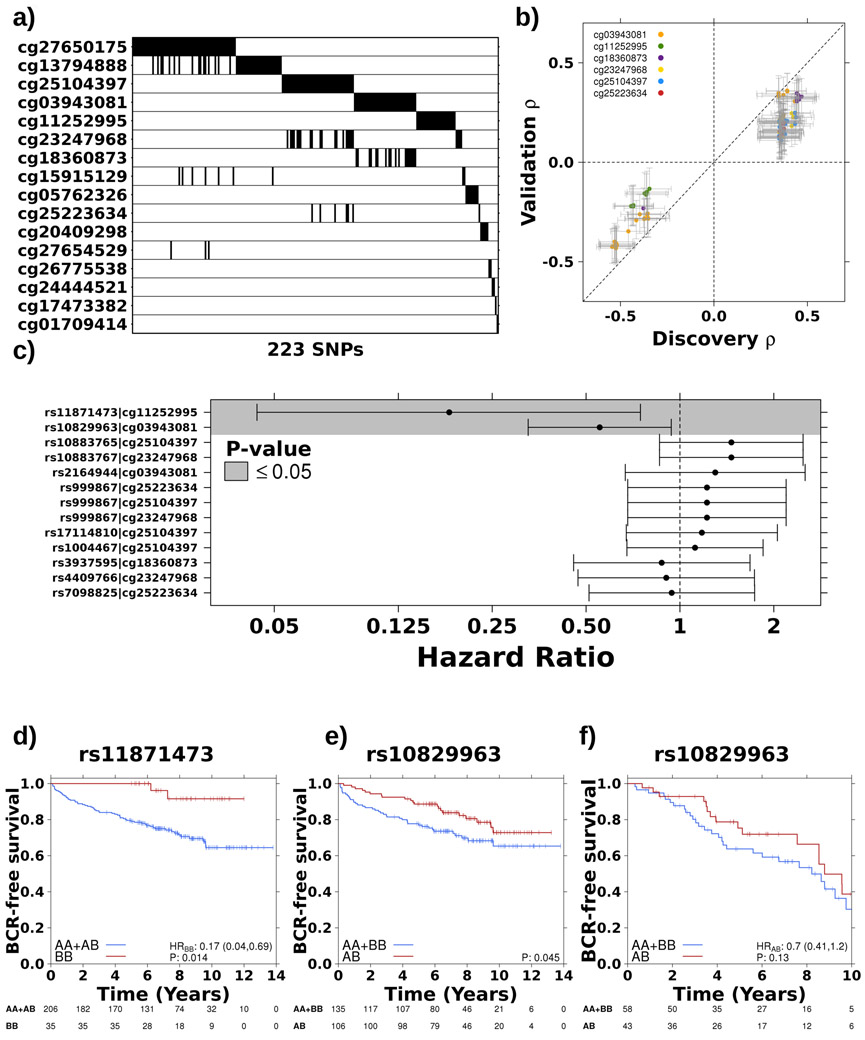
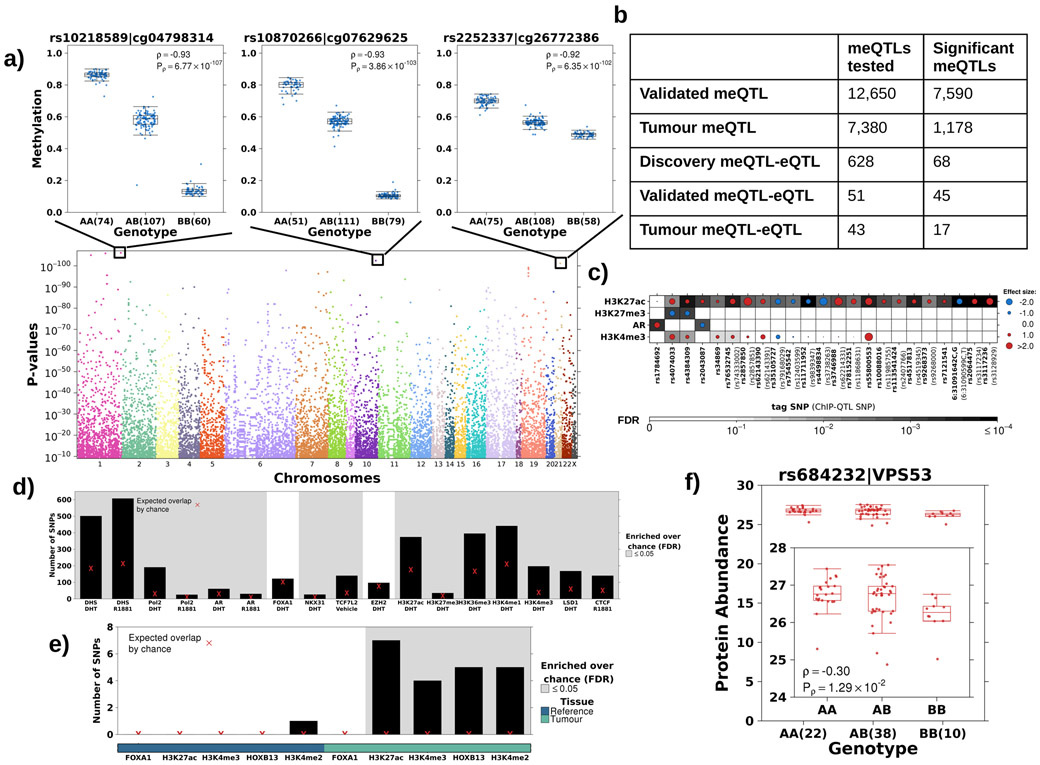
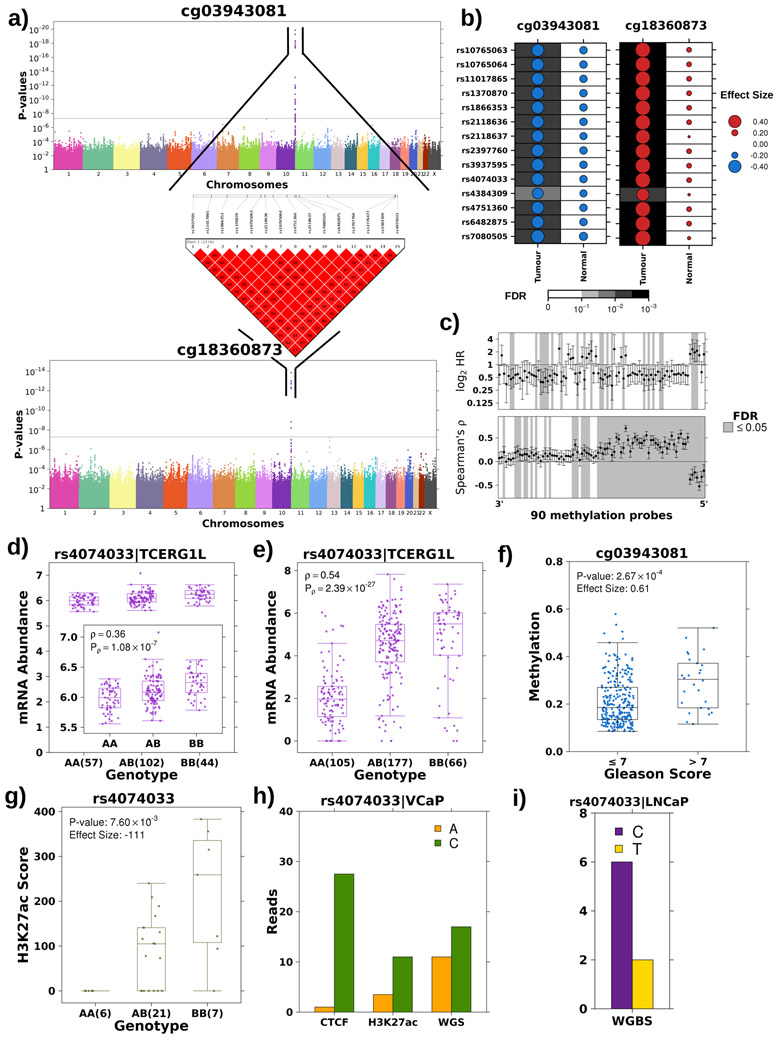
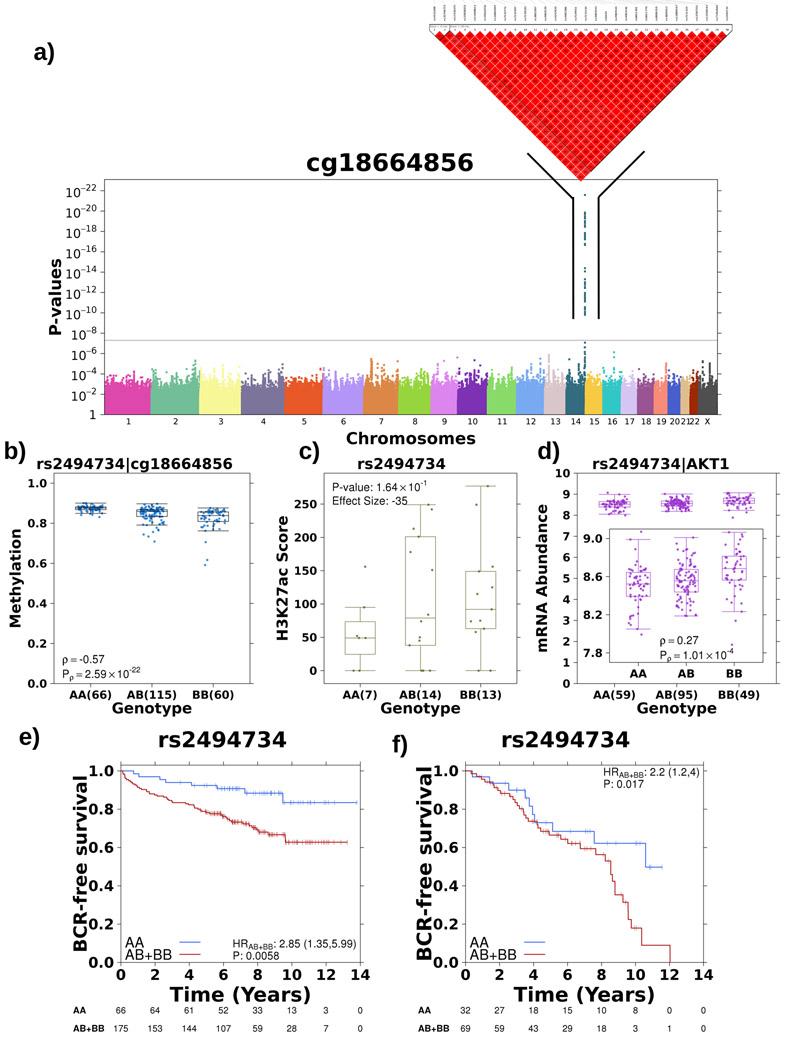
Oncogenesis is driven by germline, environmental and stochastic factors. It is unknown how these interact to produce the molecular phenotypes of tumors. We therefore quantified the influence of germline polymorphisms on the somatic epigenome of 589 localized prostate tumors. Predisposition risk loci influence a tumor's epigenome, uncovering a mechanism for cancer susceptibility. We identified and validated 1,178 loci associated with altered methylation in tumoral but not nonmalignant tissue. These tumor methylation quantitative trait loci influence chromatin structure, as well as RNA and protein abundance. One prominent tumor methylation quantitative trait locus is associated with AKT1 expression and is predictive of relapse after definitive local therapy in both discovery and validation cohorts. These data reveal intricate crosstalk between the germ line and the epigenome of primary tumors, which may help identify germline biomarkers of aggressive disease to aid patient triage and optimize the use of more invasive or expensive diagnostic assays.


Conflict of interest statement

Conflict of Interest Statement

All authors declare that they have no conflicts of interest.

Figures

Extended Data Figure 1.
Data analysis and quality controls.
Extended Data Figure 2.
Characterizing risk meQTLs.
Extended Data Figure 3.
Characterizing meQTLs targeting prognostic methylation sites.
Extended Data Figure 4.
Characterizing tumor meQTLs.
Extended Data Figure 5.
Characterizing TCERG1L tumor meQTLs.
Extended Data Figure 6.
Characterizing AKT1 tumor meQTLs.
Figure 1 –
Figure 1 –. Prostate cancer susceptibility loci associated with tumour methylation dysregulation
a) Schematic of datasets and workflow. The boxes along the left and their corresponding colours indicate the dataset used at each step. b) Thirty risk loci (x-axis) were associated with 77 methylation probes (y-axis). Dot size represents Spearman’s ρ magnitude while colour indicates directionality. Background shading represents FDR. Covariate along the top represents the chromosome of each SNP, while the covariate along the right indicates the chromosome of each methylation site. Red ID indicates SNP is involved in a trans meQTL. c) Comparison of Spearman’s ρ in discovery and validation cohorts for 23 risk loci significantly associated (FDR < 0.05) with 55 methylation probes in the validation cohort. Diagonal dotted line represents the y=x line.
Figure 2 –
Figure 2 –. Germline variants associate with prognostic methylation levels
a) Summary of 223 significant SNPs (x-axis) for each prognostic methylation probe (y-axis). Black indicates that a SNP is significantly associated (p-value < 5x10⁻⁸) with methylation levels at that probe. b) Comparison of Spearman’s ρ in discovery and validation cohorts for 75 SNPs that were significantly associated (FDR < 0.05) with six methylation probes in the validation cohort. Diagonal dotted line represents the y=x line. c) Two cis-meQTLs were prognostic. Dots and error bars represent hazard ratios and 95% confidence intervals, respectively, for the tag SNP from each of the seven haplotypes. Dotted line indicates HR = 1 and grey background shading indicates P ≤ 0.05. d) The homozygous alternative genotype of a haplotype on chromosome 17, associated with methylation of ATP2A3, gives a survival advantage. Hazard ratio and p-value from CoxPH model. e) A haplotype on chromosome 10, associated with methylation of TCERG1L, is co-dominantly associated with BCR. f) Co-dominant association with BCR replicated at rs10829963 in independent cohort (n=101).
Figure 3 –
Figure 3 –. The landscape of cis tumour meQTLs
a) Identification of cis tumour meQTLs methylome-wide (P<3x10⁻⁹; Bonferroni adjustment). Each point represents a SNP, ordered by chromosome along x-axis. Y-axis gives p-value from Spearman’s correlation. Representative boxplots, showing methylation (y-axis) discretized by genotype (x-axis), for three germline-methylation associations. Boxplot represents median, 0.25 and 0.75 quantiles with whiskers at 1.5x interquartile range. Blue points refer to methylation values and number of samples with each genotype is given in brackets. b) Table shows number of meQTLs tested and statistically significant (FDR<0.05 based on Spearman’s correlation) at each stage. c) Tumour meQTLs demonstrated allele specific AR binding or histone modification (n=30; 23 unique SNPs). Circle size and colour represents magnitude and sign of coefficient from logistic regression model (i.e. red indicates alternate allele associated with increased binding and blue decreased binding). Background shading represents FDR. X-axis labels show tag tumour meQTL-ChIP-QTL and SNP ID in brackets indicate the ChIP-QTL SNP in the case that the ChIP-QTL SNP is not the tag SNP. d) Tumour meQTLs were enriched at transcription factor binding sites and active regulatory elements in LNCaP cells. Y-axis shows number of tumour meQTLs that overlap each target/treatment pair. Background shading indicates FDR<0.05 from permutation analysis (n=105 permutations). Red X represents expected number of overlapping loci by chance. e) Tumour meQTLs were interrogated for overlap with sites of allelic imbalance at FOXA1, H3K27ac, H3K4me3, HOXB13 and H3K4me2 peaks in tumour and reference tissue. Y-axis shows number of tumour meQTLs that overlap each target. Background shading indicates FDR<0.05 from permutation analysis (n=105 permutations). The bottom covariate indicates sites of allelic imbalance in tumour or reference tissue. Red X represents expected number of overlapping loci by chance. f) The tumour meQTL-eQTL-pQTL identified in this analysis is in LD with the risk locus, rs684232, which is also a pQTL for VPS53. Boxplot represents median, 0.25 and 0.75 quantiles with whiskers at 1.5x interquartile range and red points refer to protein abundance values. The number of samples with each genotype is given in brackets.
Figure 4 –
Figure 4 –. Tumour meQTL associated with TCERG1L regulation
a) Haplotype on chromosome 10 strongly associated with methylation probes at both 5’ and 3’ ends of TCERG1L. Manhattan plot presents p-values (y-axis; Spearman’s correlation) for association of each SNP, x-axis ordered by chromosome, with methylation at both 5’ (cg03943081) and 3’ (cg18360873) ends of TCERG1L. The grey line represents the Bonferroni adjustment. All associated SNPs are in strong LD. LD plot shows pairwise D’ values between all associated SNPs where a solid red square indicates a D’ value of 1. b) TCERG1L meQTLs were tumour-specific. Dot size reflects the magnitude and dot colour reflects the directionality of Spearman’s ρ between genotype and methylation at probes 5’ and 3’ of TCERG1L. The background shading indicates the FDR. c) Genotype at rs4074033 was associated with methylation levels of 64/90 probes spanning TCERG1L. Bottom forest plot shows Spearman’s correlation and 95% CI for association of each methylation probe (x-axis) and genotype at rs4074033. Horizontal line represents ρ=0. Top forest plot shows HR and 95% CI for association of methylation probes with BCR using a CoxPH model. Horizontal line represents HR = 1. Grey shading in both plots indicates significant association (FDR<0.05). d-e) The alternative (B) allele exhibits a dominant effect resulting in increased mRNA abundance of TCERG1L in both the discovery (d) and the validation cohort (e). Boxplot represents median, 0.25 and 0.75 quantiles with whiskers at 1.5x interquartile range and purple points refer to mRNA abundance values. The number of samples with each genotype is given in brackets. Difference in abundance levels was quantified using Spearman’s correlation. f) Methylation 5’ of TCERG1L (cg03943081) is significantly associated with Gleason Score in the discovery cohort. Effect quantified by Mann-Whitney and effect size is fold change. Blue points refer to methylation levels. g) The alternative allele showed increased H3K27ac modification in the discovery cohort. Effect quantified using Mann-Whitney test (AA vs. AB+BB) and effect size represents differences in medians. Green points refer to H3K27ac peak signal. h) The alternative allele at rs4074033 preferentially shows H3K27ac modification and is preferentially bound by CTCF. The VCaP cell line is heterozygous at rs4074033 (i.e. genotype: AC). The y-axis shows the number of reads with each allele at rs4074033 from CTCF and H3K27c ChIP-Seq and WGS data. i) The alternative allele at rs4074033 is methylated in LNCaP cell lines (genotype: CC). Y-axis shows number of reads with the methylated C allele vs. the unmethylated T allele (from WGBS).
Figure 5 –
Figure 5 –. Tumour meQTL associated with AKT1 regulation
a) Haplotype on chromosome 14 strongly associated with methylation of a probe within the gene body of AKT1. Manhattan plot represents p-values from Spearman’s correlation as outlined previously. b) The alternative allele is associated with decreased methylation of cg18774856, effect quantified by Spearman’s correlation. Boxplot represents median, 0.25 and 0.75 quantiles with whiskers at 1.5x interquartile range and blue points refer to methylation values. The number of samples with each genotype is given in brackets. c) The alternative allele showed increased H3K27ac modification in this region, effect quantified by Mann-Whitney test (AA vs. AB+BB) and effect size gives difference in medians. Green points refer to H3K27ac ChIP-Seq signal. d) The alternative allele was associated with increased mRNA abundance of AKT1, effect quantified by Spearman’s correlation. Purple points refer to mRNA abundance. e) The presence of the alternative allele confers a survival disadvantage as presented in Kaplan-Meier plot with time along the x-axis in years and estimated proportion of individuals without biochemical recurrence event on y-axis. The hazard ratio from a CoxPH model is also presented along with the number of individuals without an event in each group at each time point along the bottom. f) Alternative allele at rs2456274 is dominantly associated with rapid biochemical recurrence in an independent cohort (n=101).

Comment in

References

    1. Hanahan D & Weinberg RA Hallmarks of cancer: The next generation. Cell 144, 646–674 (2011). - PubMed
    1. Vogelstein B et al. Cancer genome landscapes. Science 339, 1546–1558 (2013). - PMC - PubMed
    1. Garraway LA & Lander ES Lessons from the cancer genome. Cell 153, 17–37 (2013). - PubMed
    1. Tomasetti C, Li L & Vogelstein B Stem cell divisions, somatic mutations, cancer etiology, and cancer prevention. Science 355, 1330–1334 (2017). - PMC - PubMed
    1. Tomlinson IP et al. A genome-wide association study identifies colorectal cancer susceptibility loci on chromosomes 10p14 and 8q23.3. Nat. Genet 40, 623–630 (2008). - PubMed

Methods References

    1. Shiah Y-J, Fraser M, Bristow RG & Boutros PC Comparison of Pre-processing Methods for Infinium HumanMethylation450 BeadChip Array. Bioinformatics 33, 3151–3157 (2017). - PubMed
    1. Pidsley R et al. A data-driven approach to preprocessing Illumina 450K methylation array data. BMC Genomics 14, 293 (2013). - PMC - PubMed
    1. Fisher S et al. A scalable, fully automated process for construction of sequence-ready human exome targeted capture libraries. Genome Biol. 12, R1 (2011). - PMC - PubMed
    1. Li H & Durbin R Fast and accurate short read alignment with Burrows-Wheeler transform. Bioinforma. Oxf. Engl 25, 1754–1760 (2009). - PMC - PubMed
    1. McKenna A et al. The Genome Analysis Toolkit: A MapReduce framework for analyzing next-generation DNA sequencing data. Genome Res. 20, 1297–1303 (2010). - PMC - PubMed

Publication types

MeSH terms

Substances