. 2019 Oct;25(10):1607-1614.
doi: 10.1038/s41591-019-0584-2. Epub 2019 Oct 7.

A rectal cancer organoid platform to study individual responses to chemoradiation

Affiliations

A rectal cancer organoid platform to study individual responses to chemoradiation

Karuna Ganesh et al. Nat Med. 2019 Oct.

Abstract

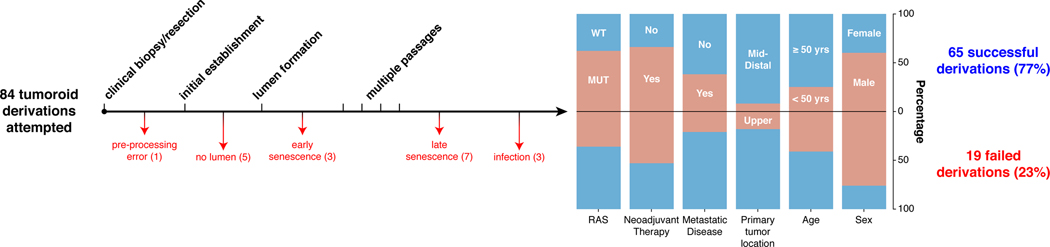
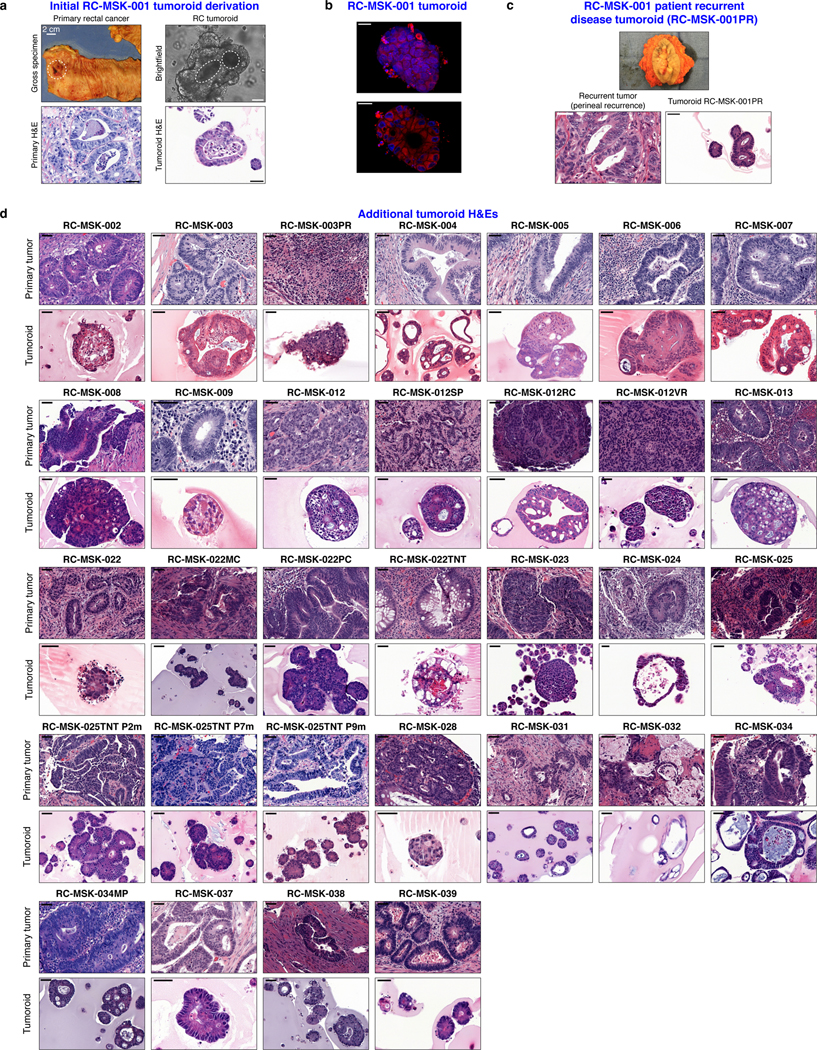
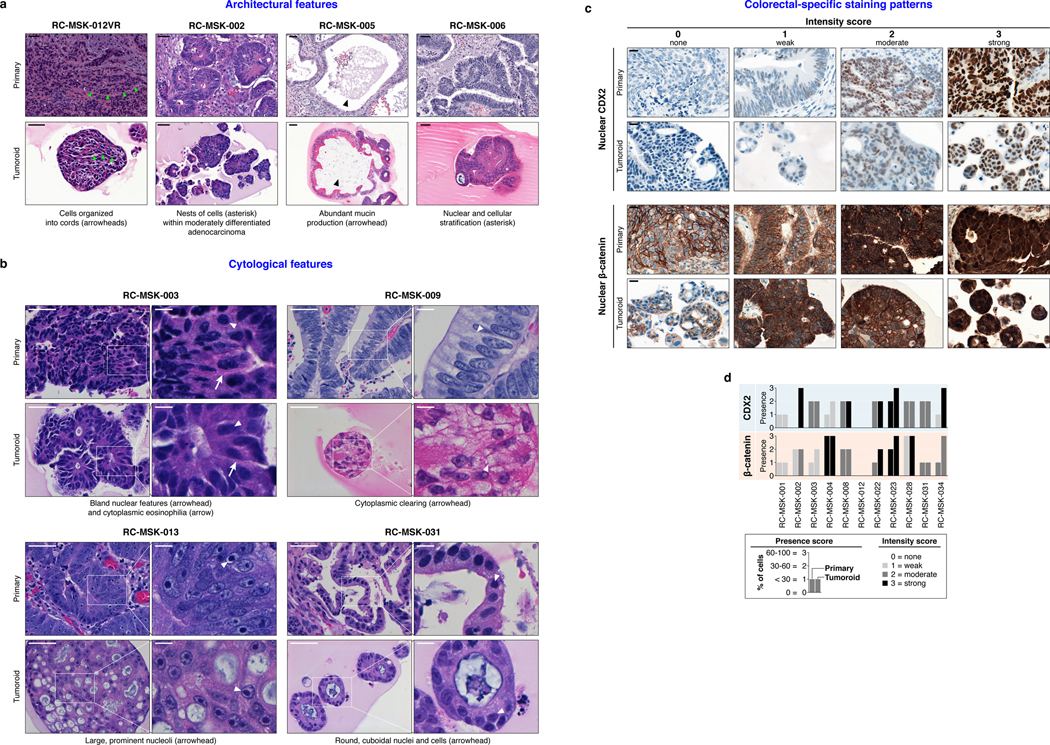
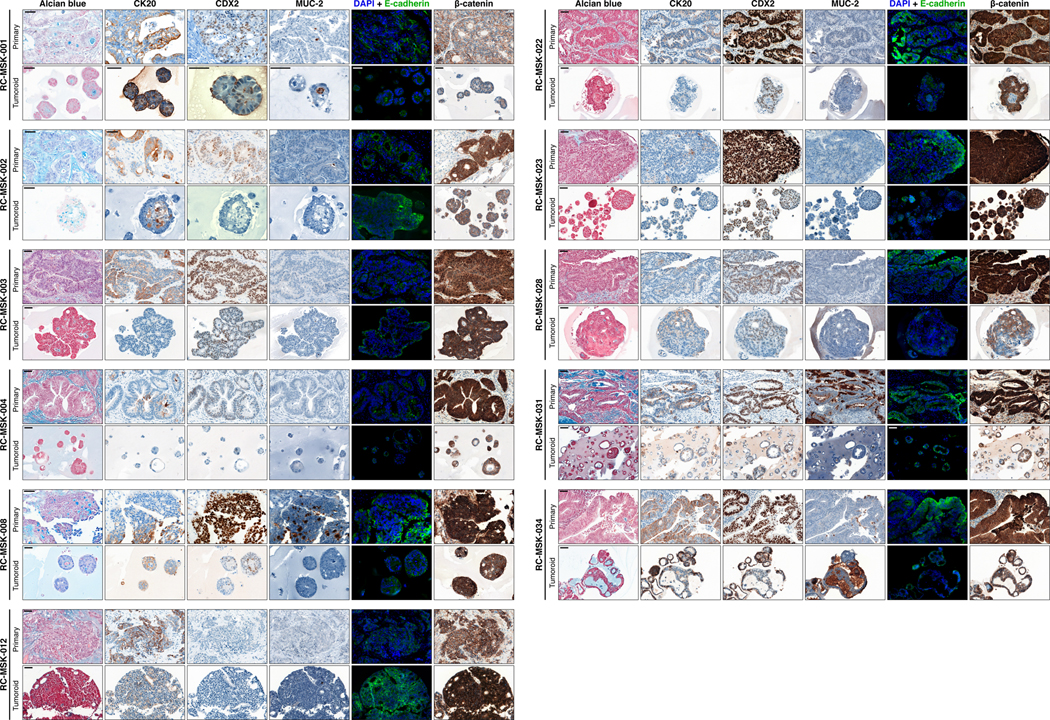
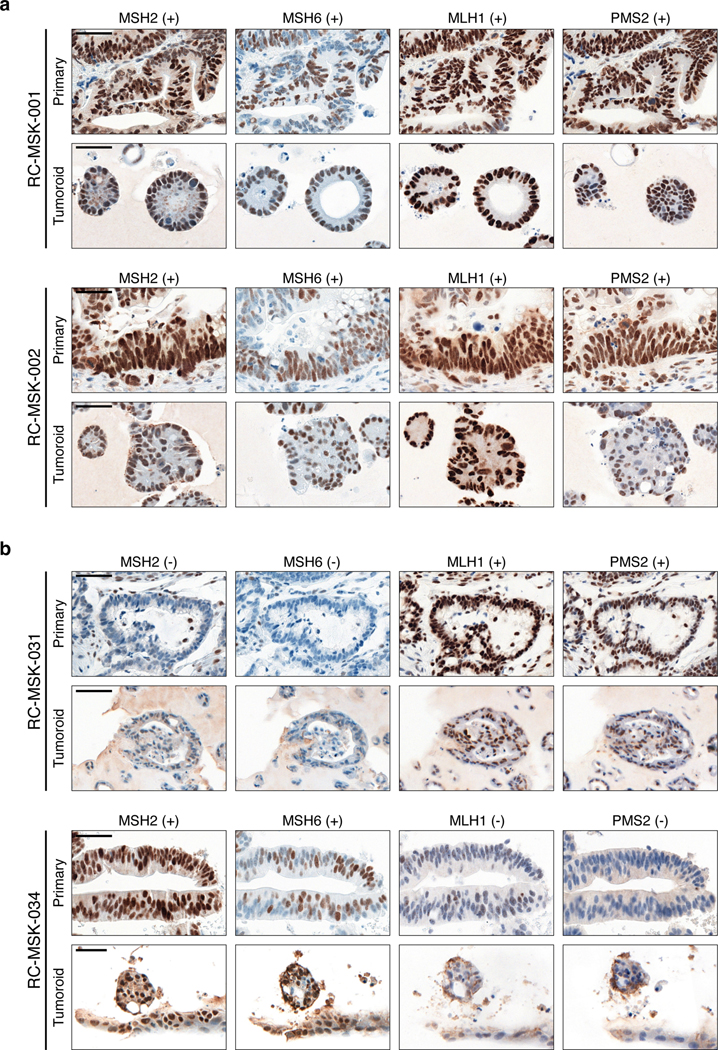
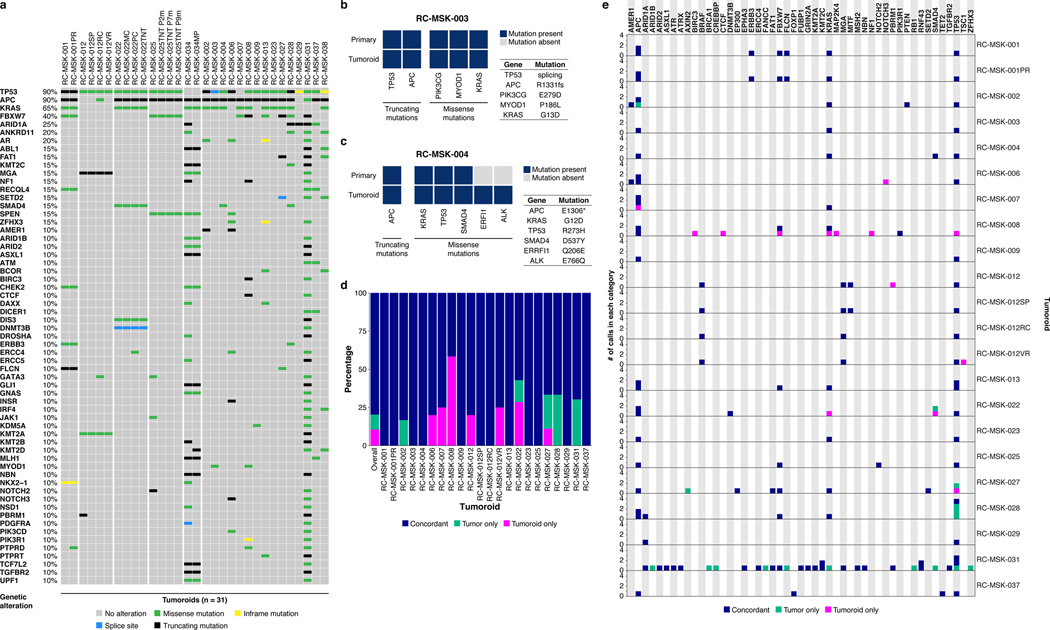
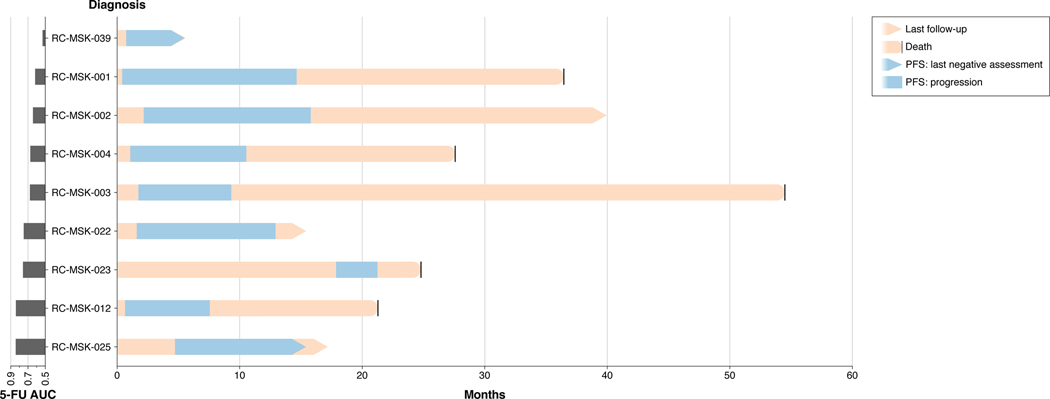
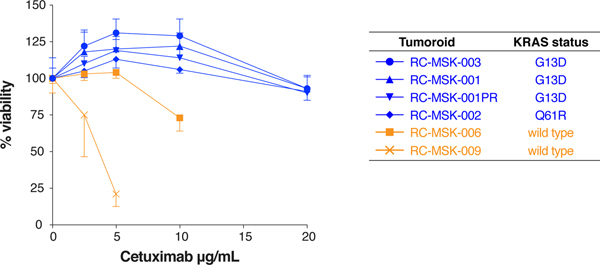
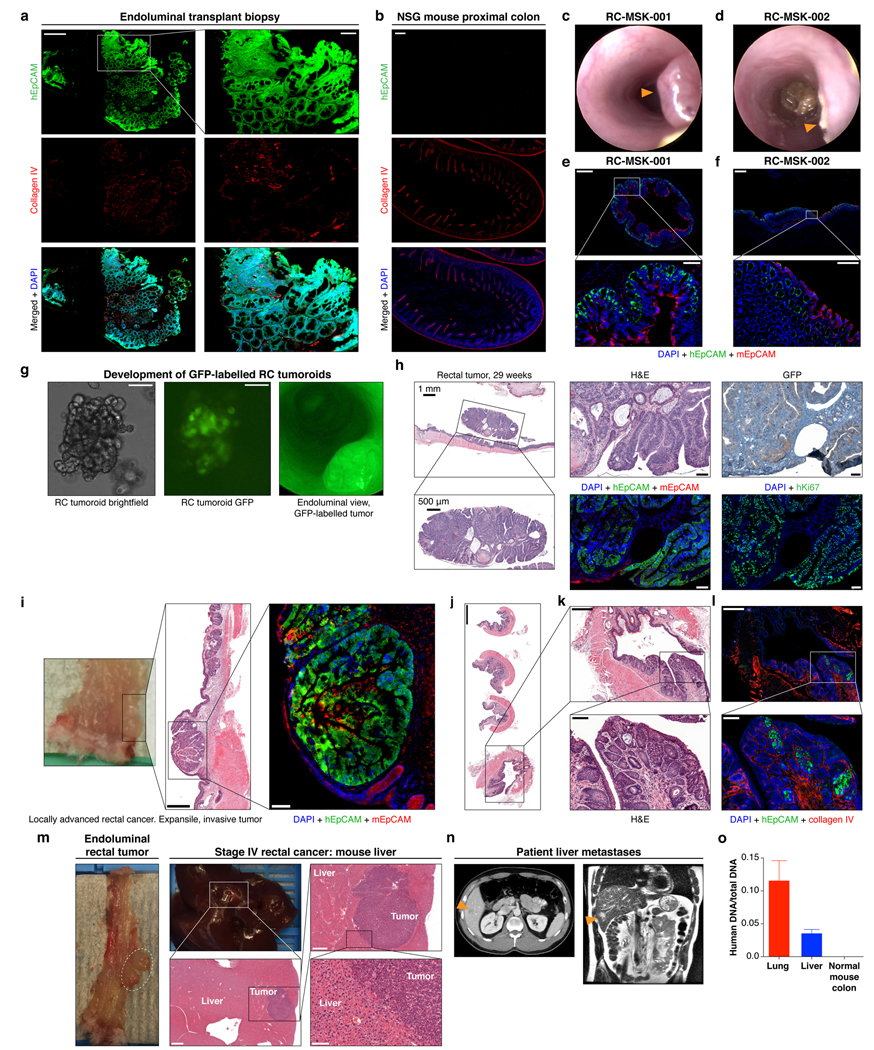
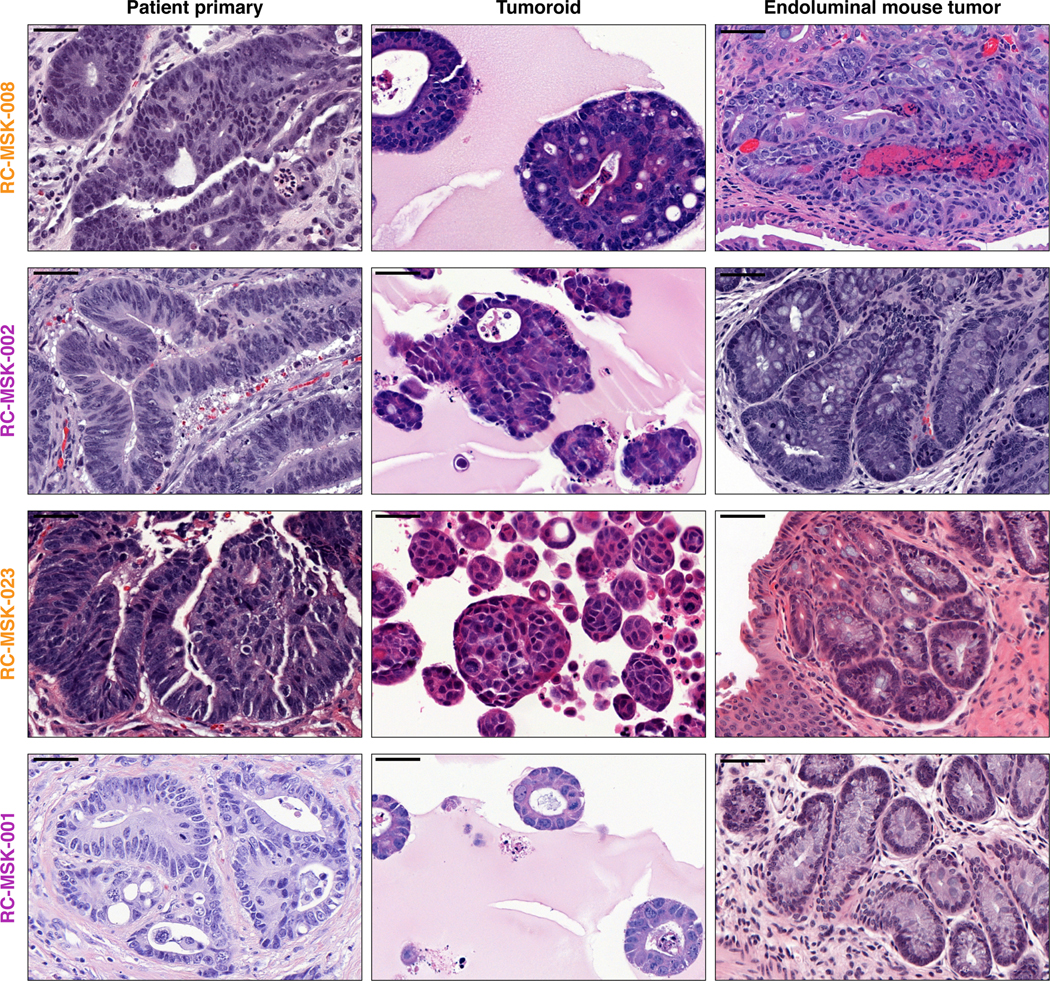
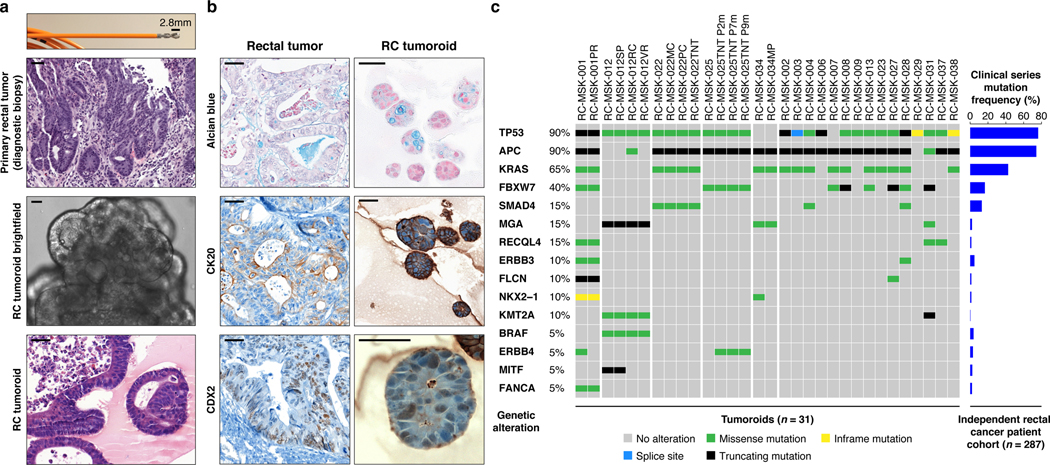
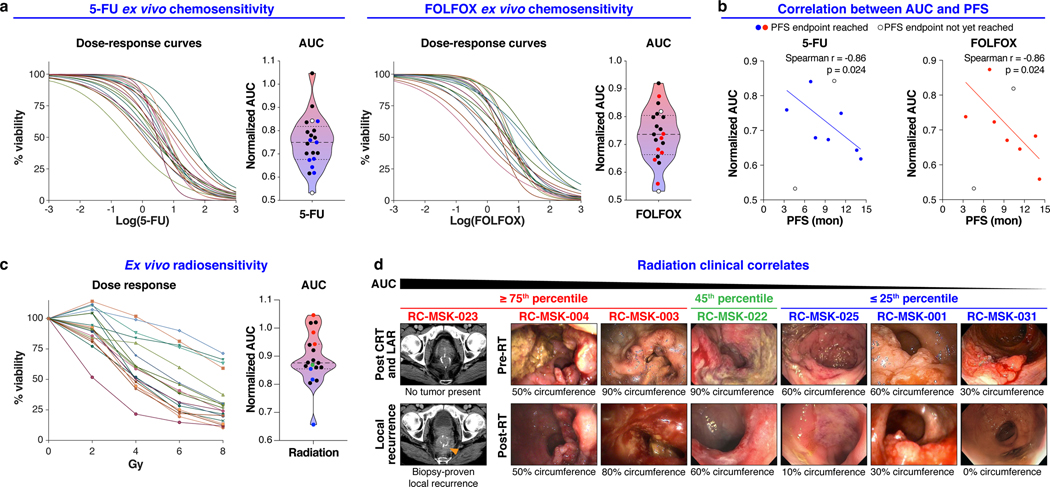
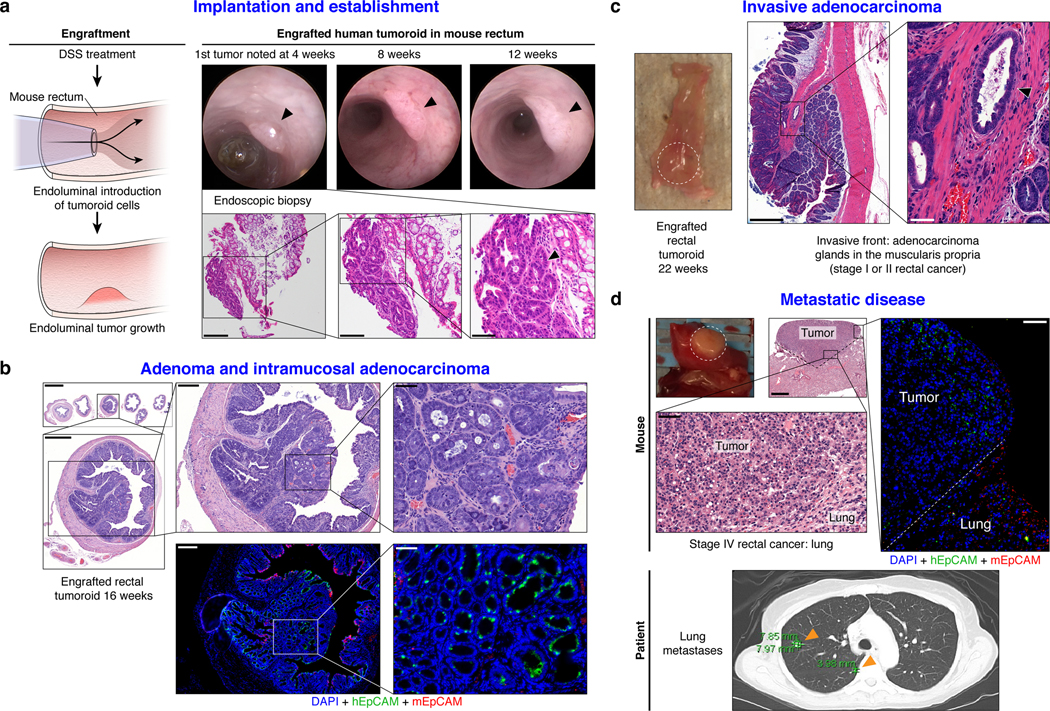
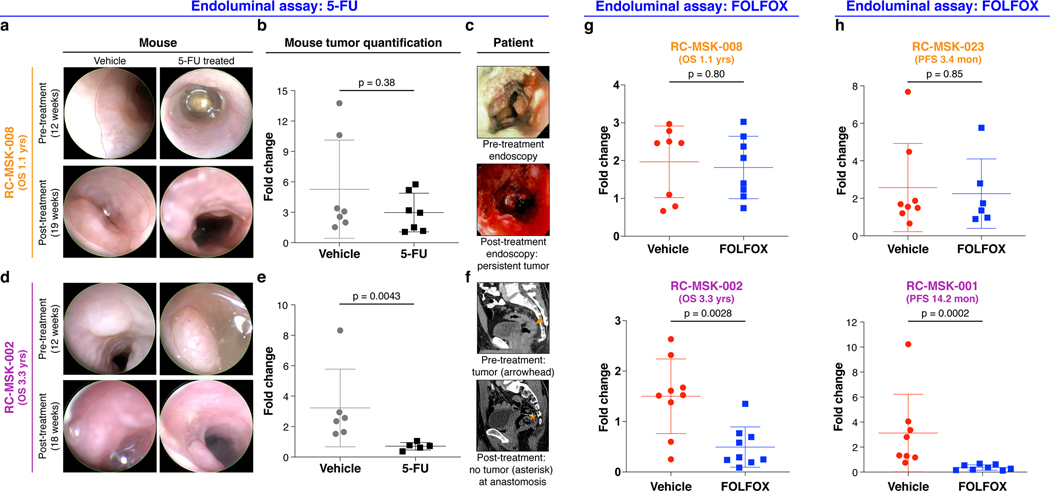
Rectal cancer (RC) is a challenging disease to treat that requires chemotherapy, radiation and surgery to optimize outcomes for individual patients. No accurate model of RC exists to answer fundamental research questions relevant to patients. We established a biorepository of 65 patient-derived RC organoid cultures (tumoroids) from patients with primary, metastatic or recurrent disease. RC tumoroids retained molecular features of the tumors from which they were derived, and their ex vivo responses to clinically relevant chemotherapy and radiation treatment correlated with the clinical responses noted in individual patients' tumors. Upon engraftment into murine rectal mucosa, human RC tumoroids gave rise to invasive RC followed by metastasis to lung and liver. Importantly, engrafted tumors displayed the heterogenous sensitivity to chemotherapy observed clinically. Thus, the biology and drug sensitivity of RC clinical isolates can be efficiently interrogated using an organoid-based, ex vivo platform coupled with in vivo endoluminal propagation in animals.


Conflict of interest statement

Competing Interests:

J.J.S. has received travel support from Intuitive Surgical Inc. and has served as a clinical advisor for Guardant Health, Inc.

C.L.S. serves on the Board of Directors of Novartis, is a co-founder of ORIC Pharm, and co-inventor of enzalutamide and apalutamide. He is a science advisor to Agios, Beigene, Blueprint, Column Group, Foghorn, Housey Pharma, Nextech, KSQ, Petra, and PMV. He was a co-founder of Seragon, purchased by Genentech/Roche in 2014.

J.M. is a science advisor and owns company stock in Scholar Rock.

H.C. is an inventor on several patents related to organoid technology.

S.W.L. is a co-founder and scientific advisory board member for ORIC Pharm, Blueprint, and Mirimus. He also serves on the scientific advisory board for Constellation, Petra, and PMV and has recently served as a consultant for Forma, Boehringer Ingelheim, and Aileron.

J.G.-A. has received support from Medtronic (honorarium for consultancy with Medtronic), Johnson & Johnson (honorarium for delivering a talk), and Intuitive Surgical (honorarium for participating in a webinar by Intuitive Surgical).

P.B.R. has received honorarium from Corning to discuss 3D cell culture techniques, has served as a consultant for AstraZeneca, and is a consultant for EMD Serono for work on radiation sensitizers.

R.N.K. is a cofounder of Ceramedix Holding L.L.C. He also has patents unrelated to this work: RK (US7195775B1, US7850984B2, and US10052387B2), RK (US8562993B2, US9592238B2, US20150216971A1, and US20170335014A1), and RK (US20170333413A1 and US20180015183A1).

K.P.O. has received an honorarium from Merck to discuss organoid platforms.

Figures

Extended Data Fig. 1 |
Extended Data Fig. 1 |. Rectal cancer tumoroid derivation and patient characteristics.
The diagram shows the outcome of attempts to derive tumoroids from 84 rectal cancer (RC) tumor samples from 58 individual RC patients. 65 RC tumoroids from 41 patients (77%) were successfully derived. For the 19 failed derivations, the points of failure are shown. Demographics from each group are displayed (RAS status [wild type (WT) or mutant (MUT)], neoadjuvant therapy, metastatic status at derivation, location of the primary tumor [middle/distal or upper rectum], sex, and age). Two patients were mismatch repair deficient (not shown).
Extended Data Fig. 2 |
Extended Data Fig. 2 |. Preservation of rectal cancer histopathology in tumoroids.
a, Gross resected rectal specimen from which the first RC tumoroid line (RC-MSK-001) was derived and representative brightfield microscopy of the tumoroid in 3D culture two months after processing. Lower panels show hematoxylin and eosin (H&E) staining of the patient tumor (bottom left panel) and the derived RC-MSK-001 tumoroid (bottom right panel) in 3D culture. Scale bars, 50 μm. b, Hoechst and MitoTracker stains of a representative section of the RC-MSK-001 tumoroid demonstrate the luminal and glandular structure. Scale bars, 20 μm. c, Perineal recurrence of the original RC-MSK-001 tumor and the derived tumoroid (RC-MSK-001PR) are shown with H&E staining. Scale bar, 50 μm. d, H&E comparison of 32 additional tumoroid cell lines as noted with the corresponding primary tumor from which they were derived. Scale bars, 50 μm. All representative images are from one patient-specific tumor-to-tumoroid derivation.
Extended Data Fig. 3 |
Extended Data Fig. 3 |. Tumoroids preserve both architecture, cytology, and colorectal-specific staining patterns of the primary tumors from which they were derived.
a, Examples of architecture preservation in tumoroids and primary tumors. Scale bars, 50 μm. b, Examples of cytological preservation in specific tumoroids. Scale bars: low magnification 50 μm, high magnification inset 10 μm. Both architecture and cytology features were identified by an independent gastrointestinal pathologist. c, CDX2 and β-catenin were quantified by both presence and intensity of stain on a 0–3 scale. Presence is defined as the percentage of cells with staining: 0 = 0%, 1 = < 30%, 2 = 30–60%, 3 = >60%. Intensity defines the strength of staining: 0 = none, 1 = weak, 2 = moderate, 3 = strong. Examples for both CDX2 and β-catenin are displayed. Intensity of staining is assessed exclusively within the nuclear compartment. Scale bar, 20 μm. d, The presence and intensity of each tumoroid is shown graphically according to the key. Cohen’s κ was used to assess similarity in score between matched primary and tumoroid samples: β-catenin presence score, κ = 0.51, p = 0.0021; β-catenin intensity score, κ = 0.63, p = 0.00034; CDX2 presence score, κ = 0.45, p = 0.0037; CDX2 intensity score, κ = 0.527, p = 0.00042. All representative images are from one patient-specific tumor-to-tumoroid derivation.
Extended Data Fig. 4 |
Extended Data Fig. 4 |. Conservation of enterocyte markers.
Eleven tumoroids are compared to their respective primary tumors for Alcian blue, CK20, CDX2, MUC-2, E-cadherin, and β-catenin staining. For immunofluorescent staining: E-cadherin (green), DAPI (blue). See Fig. 1b for another example of RC-MSK-001 Alcian blue, CK20, and CDX2 comparisons. Scale bars, 50 μm. All representative images are from one patient-specific tumor-to-tumoroid derivation.
Extended Data Fig. 5 |
Extended Data Fig. 5 |. Comparison of nuclear mismatch repair proteins between patient and tumoroid samples.
Immunohistochemistry of the nuclear mismatch repair (MMR) proteins MSH2, MSH6, MLH1, and PMS2. The presence of each protein is assessed by nuclear staining verified by pathologic analysis with (+) indicating present and (−) indicating absent staining. a, Displayed are two MMR-proficient tumoroids, RC-MSK-001 and RC-MSK-002. b, Displayed are two MMR-deficient tumors. RC-MSK-031 is deficient in MSH2 and MSH6. RC-MSK-034 is deficient in MLH1 and PMS2. Scale bars, 50 μm. All representative images are from one patient-specific tumor-to-tumoroid derivation.
Extended Data Fig. 6 |
Extended Data Fig. 6 |. The mutational fingerprint in derived RC tumoroids.
a, The mutational fingerprint of 31 RC tumoroids for the most common alterations as determined by MSK-IMPACT are displayed. The frequency of alteration is noted along with the type of genetic alteration relative to truncating mutation, inframe mutation, missense mutation, or splice site alterations (as noted by the color code). b, Example of a tumoroid (RC-MSK-003) with complete conservation of mutations between the tumoroid and the primary tumor from which it was derived. c, Example of a tumoroid (RC-MSK-004) with conservation of driver mutations and the addition of two secondary mutations noted in the tumoroid in culture only. d, Percentage of concordance between tumoroid and tumor among mutations predicted to be oncogenic overall and by each patient. The mutations represented are those annotated by OncoKB as oncogenic or likely oncogenic in each tumoroid and tumor pair. e, All mutations called in the MSK-IMPACT sequencing of tumoroids and primary tumors are shown. The numbers of mutations are displayed with regard to each gene (by column) and each tumoroid and tumor pair (by row). Mutations are colored by concordance status.
Extended Data Fig. 7 |
Extended Data Fig. 7 |. Swimmer’s plot of each patient treated with 5-FU-based therapy whose tumoroid has been analyzed for chemosensitivity ex vivo.
Data is displayed from top to bottom by descending area under the curve (AUC) calculated from the 5-FU dose-response experiments presented in Fig. 2a. The blue areas denote progression-free survival (PFS) intervals from treatment start date as indicated above. Seven of the nine patients have progressed, with the current status of the two patients who have not progressed indicated (RC-MSK-039 and RC-MSK-025). All patients were treated with FOLFOX, with the exception of RC-MSK-003 (capecitabine [oral 5-FU prodrug] + oxaliplatin + bevacizumab) and RC-MSK-023 (FOLFIRI: 5-FU + leucovorin + irinotecan). Four patients for whom ex vivo chemosensitivity data is presented in Fig. 2a are not shown because they did not receive 5-FU-based therapy.
Extended Data Fig. 8 |
Extended Data Fig. 8 |. Resistance to a targeted anti-epidermal growth factor receptor therapy, cetuximab, in KRAS mutant compared with KRAS wild type tumoroids.
Resistance to cetuximab is demonstrated in KRAS mutant RC tumoroids (blue) compared with a KRAS wild type tumoroids (orange). Dose range was used as shown and percentage of live cells is displayed for each tumoroid. Results are from two independent experiments done in technical quadruplicate; mean ± s.e.m.
Extended Data Fig. 9 |
Extended Data Fig. 9 |. Demonstration of endorectally implanted human rectal cancer.
a, The RC-MSK-001 endoluminal mouse biopsy represented in Fig. 3a shows serially sectioned and stained hEpCAM; collagen IV; merged with DAPI. n=5 mice scale bars: 200 μm; inset, 50 μm. b, Colon from an unimplanted NSG mouse as control for a. Scale bars, 200 μm. c-d, 12-week endoscopy of a mouse transplanted with RC-MSK-001 (n=5) or RC-MSK-002 (n=7) tumoroids. e-f, Distinct staining was noted for human and mouse EpCAM for RC-MSK-001 (n=5) and RC-MSK-002 (n=7) engrafted NSG mice. Scale bars: 500 μm; inset, 50 μm. g, RC-MSK-001 tumoroids labeled with GFP and viewed by brightfield (left), intravital GFP imaging (middle; endoscopically (right). Scale bars, 100 μm. h, Invasive rectal tumor after RC-MSK-001 tumoroid implantation (n=7 mice) stained for H&E, GFP (IHC), and IF (hEpCAM, mEpCAM, and hKi67, each merged with DAPI). i, Independent experiment similar to Fig. 3c of one male NSG mouse sacrificed at 22 weeks post-transplantation. Implanted rectal tumor, H&E, and IF (hEpCAM, mEpCAM, DAPI) showing engraftment and invasion of human tumoroids. Scale bars: H&E, 500 μm; IF, 100 μm. j-l, RC-MSK-001 endorectal tumor 16 weeks post-transplantation (n=3 mice). H&E demonstrates invasion at the junction between the columnar and squamous epithelium of anorectal junction. j/k, H&E; l, DAPI + hEpCAM + collagen IV; Scale bars are as follows: j, 1,000 μm; k-l: 400 μm; insets, 100 μm. m, Liver metastasis in an independent experiment (see Fig. 3d) after rectal transplantation in a male NSG mouse sacrificed at 36 weeks. Liver metastasis shows poorly differentiated histology. Scale bars for H&E: 1,000 μm, 500 μm, 100 μm. n, Axial and coronal CT images of liver metastases in the corresponding patient (arrowheads) discussed in m. o, Human-specific Alu qPCR demonstrates that the metastases in Fig. 3d and current panel m arose from implanted human tumoroids (Results based on three independent RNA isolates). Mean ± s.d. Staining: hEpCAM (green), hKi67 (green), mEpCAM (red), Collagen IV (red), and DAPI (blue).
Extended Data Fig. 10 |
Extended Data Fig. 10 |. Histopathologic conservation of glandular architecture in the endoluminally implanted RC tumoroids.
H&E images are shown for the RC-MSK-008, RC-MSK-002, RC-MSK-023, and RC-MSK-001 tumoroid lines. Left panels display the primary patient tumor from which the tumoroid was derived once per patient. Middle panels display the tumoroids in 3D culture. Right panels display the engrafted tumoroids within the mouse rectum following endoluminal transplantation The number of mice engrafted with indicated tumoroids is 8, 7, 8, and 5 (top to bottom). The H&E photomicrographs demonstrate histopathologic conservation of glandular features as noted in the human adenocarcinomas from which they were derived. Scale bar, 50 μm.
Fig. 1 |
Fig. 1 |. Preservation of rectal cancer histopathology and mutational fingerprint in tumoroids.
a, Shown at the top is the 2.8 mm cold biopsy forceps (Boston Scientific Corp.™) used for sampling tumor from some of the rectal cancers (RCs) used to derive tumoroids. Also shown is the first primary tumor sampled with this biopsy forceps stained with hematoxylin and eosin (H&E, second panel). The corresponding derived tumoroid, RC-MSK-008, in 3D culture is displayed by brightfield microscopy and H&E (lower 2 panels). Scale bars, 50 μm. b, Histopathologic staining of enterocyte markers (Alcian blue, CK20, and CDX2) of a primary resected rectal tumor (leftmost panels) and the corresponding tumoroid, RC-MSK-001, in 3D culture (right panels). Scale bars, 50 μm. c, The mutation landscape of 31 of the RC tumoroids is displayed (left panel) compared to an independent set of 287 RCs (right panel), both detected by MSK-IMPACT. The frequency of alterations in the RC tumoroids is noted with the type of genetic alteration (noted by color code). Displayed are the top 15 mutated genes observed in the derived tumoroids.
Fig. 2 |
Fig. 2 |. Clinically relevant responses to chemotherapy and radiation in rectal cancer tumoroids ex vivo.
a, Ex vivo chemosensitivity of 21 RC tumoroids to 5-FU and FOLFOX in the form of dose response curves are displayed for each tumoroid (n=2 or 3 independent experiments for each). Area under the curve (AUC) was calculated from the raw dose response data and is displayed as a violin plot; dashed line and dotted lines represent mean and upper/lower quartiles, respectively. Colored data points indicate those tumoroids referenced in b. b, Correlation between AUC and progression free survival (PFS) for the seven patients (n=7) who have a PFS endpoint are displayed (Two-tailed Spearman correlation: Spearman r = 0.86, p = 0.024 for both treatment conditions). Data for both 5-FU and FOLFOX is shown. The linear regression line is plotted. c, Ex vivo radiosensitivity of 19 RC tumoroids (n=2 or 3 independent experiments for each tumoroid) is shown with corresponding AUC calculated and displayed as in a. Colored data points indicate those tumoroids referenced in d. d, Endoscopic clinical responses to radiation are displayed for each patient and ranked by AUC, descending left-to-right as indicated. The percent of the bowel circumference involved by tumor pre- and post-radiation (pre- and post-RT) is displayed as assessed endoscopically by a colorectal surgeon. The RC-MSK-023 tumor is shown radiographically in the left-most panel as a local recurrence following chemoradiation (CRT) and low anterior resection (LAR). The tumoroids are categorized from left to right as ≥ 75th percentile (red), 45th percentile (green), and ≤ 25th percentile (blue) with corresponding color-coded data points indicated in c.
Fig. 3 |
Fig. 3 |. Establishment of an endoluminal rectal cancer assay in mice.
a, Cartoon of the implantation process and an endoscopic view of the first rectal tumoroid (RC-MSK-001) implanted in a NSG mouse; mouse at 4, 8, and 12 weeks (top panels). H&E of the engrafted tumoroid biopsied at 4 weeks via endoscopic channel (bottom panels) demonstrates high nuclear/cytoplasmic ratio, poor differentiation, and neoplastic glands (arrowhead). Adjacent normal mouse colonic epithelium and stroma is seen. Scale bars from low to high magnification are as follows: 200 μm, 100 μm, 50 μm. b, H&E, axial view of the rectal tumor within the NSG mouse rectum with adjacent serial sections (upper panels). Inset demonstrates intramucosal adenocarcinoma with atypical neoplastic cells, poorly differentiated tumor cells, and high nuclear to cytoplasmic ratio. IF (lower panels): DAPI (blue), hEpCAM (green), mEpCAM (red). Scale bars from low to high magnification: 2,000 μm, 500 μm, 200 μm, 50 μm. c, NSG mouse rectum (gross rectum with tumor, white dashed circle) and H&E shows evidence of a moderately differentiated tumor engrafted from RC-MSK-001 tumoroids with invasion into the muscularis (inset, arrowhead). Scale bars: 500 μm; inset, 50 μm. d, Gross lung metastasis (white dashed circle) from the same mouse presented in c engrafted endoluminally with RC-MSK-001 tumoroids. Corresponding H&Es demonstrate poorly differentiated architecture of the metastasis. IF serial section demonstrates engraftment of the human tumoroids: DAPI (blue), hEpCAM (green), mEpCAM (red). Lower panel shows axial thoracic CT imaging of the patient from which the tumoroid was derived, demonstrating lung metastases (orange arrows indicate two of multiple lung metastases). Scale bars: 500 μm; H&E and IF insets, 50 μm. Images are representative of 5 tumoroid engraftments into mouse rectum.
Fig. 4 |
Fig. 4 |. The endoluminal rectal cancer model can be used to reflect patient-specific chemoresistance and chemosensitivity.
a, RC-MSK-008 (more clinically aggressive: overall survival [OS]=1.1 yrs) implanted in the mouse rectum is shown endoscopically pre- and post-treatment with vehicle or 5-FU. b, Quantification of RC-MSK-008 tumor area measured endoscopically pre- and post-treatment (n=7 per condition) and presented as fold change in tumor size for each mouse. No difference was observed between vehicle and 5-FU-treated groups (Mann-Whitney: U=17, p=0.38). c, The RC-MSK-008 human rectal tumor viewed endoscopically according to routine clinical care at diagnosis and post 5-FU-based treatment. d, RC-MSK-002 (less clinically aggressive: OS=3.3 yrs) implanted in the mouse rectum is shown endoscopically pre- and post-treatment with vehicle or 5-FU. e, Quantification of RC-MSK-002 tumor area as in b (n=6 for vehicle, n=5 for 5-FU). 5-FU treated tumors had a significantly lower fold change compared to vehicle-treated tumors (Two-tailed Mann-Whitney: U=0, p=0.0043). f, The RC-MSK-002 human rectal tumor viewed by sagittal CT imaging according to routine clinical care pre-treatment (orange arrowhead: tumor) and after both resection and 5-FU based systemic therapy (orange asterisk: anastomosis) with no evidence of recurrence. g, RC-MSK-008 (n=8 mice per condition) and RC-MSK-002 (n=9 mice per condition) tumoroids implanted and measured as in a-f were treated with FOLFOX. Similarly, RC-MSK-008 implanted mice showed no difference between vehicle and FOLFOX-treated groups (Two-tailed Mann-Whitney: U=29, p=0.80), and RC-MSK-002 implanted mice treated with FOLFOX had significantly lower fold change compared to vehicle-treated tumors (Two-tailed Mann-Whitney: U=8, p=0.0028). h, RC-MSK-023 (rapid clinical progression: progression-free survival [PFS] = 3.4 mon) and RC-MSK-001 (slower clinical progression: PFS=14.2 mon) implanted endoluminally into mice as in a-f. RC-MSK-023 (n=8 for vehicle, n=6 for FOLFOX) implanted mice showed no difference was observed between vehicle and FOLFOX-treated groups (Two-tailed Mann-Whitney: U=22, p=0.85). RC-MSK-001 (n=8 per condition) implanted mice with FOLFOX-treated tumors had significantly lower fold change compared to vehicle-treated tumors (Mann-Whitney: U=0, p=0.0002). Error bars in figure: middle line = mean, end lines = s.d.

Comment in

References

    1. Siegel RL, Miller KD & Jemal A Cancer statistics, 2019. CA. Cancer J. Clin 69, 7–34 (2019). - PubMed
    1. Deborah Freedman-Cass N et al. NCCN Guidelines Version 2.2017 Panel Members Rectal Cancer Continue NCCN Guidelines Panel Disclosures.
    1. Smith JJ et al. Assessment of a Watch-and-Wait Strategy for Rectal Cancer in Patients With a Complete Response After Neoadjuvant Therapy. JAMA Oncol. e185896 (2019). doi:10.1001/jamaoncol.2018.5896 - DOI - PMC - PubMed
    1. van der Valk MJM et al. Long-term outcomes of clinical complete responders after neoadjuvant treatment for rectal cancer in the International Watch & Wait Database (IWWD): an international multicentre registry study. Lancet 391, 2537–2545 (2018). - PubMed
    1. Martens MH et al. Long-term Outcome of an Organ Preservation Program After Neoadjuvant Treatment for Rectal Cancer. J. Natl. Cancer Inst 108, djw171 (2016). - PubMed

Methods-only References:

    1. Sato T et al. Long-term Expansion of Epithelial Organoids From Human Colon, Adenoma, Adenocarcinoma, and Barrett’s Epithelium. Gastroenterology 141, 1762–1772 (2011). - PubMed
    1. Dow LE et al. Apc Restoration Promotes Cellular Differentiation and Reestablishes Crypt Homeostasis in Colorectal Cancer. Cell (2015). doi:10.1016/j.cell.2015.05.033 - DOI - PMC - PubMed
    1. O’Rourke KP et al. Transplantation of engineered organoids enables rapid generation of metastatic mouse models of colorectal cancer. Nat. Biotechnol (2017). doi:10.1038/nbt.3837 - DOI - PMC - PubMed
    1. Robinson SM et al. The potential contribution of tumour-related factors to the development of FOLFOX-induced sinusoidal obstruction syndrome. Br. J. Cancer 109, 2396–2403 (2013). - PMC - PubMed
    1. Sanjana NE, Shalem O & Zhang F Improved vectors and genome-wide libraries for CRISPR screening. Nat. Methods 11, 783–4 (2014). - PMC - PubMed

Publication types

MeSH terms

LinkOut - more resources