. 2019 Oct;25(10):1540-1548.
doi: 10.1038/s41591-019-0595-z. Epub 2019 Oct 7.

A clonal expression biomarker associates with lung cancer mortality

Collaborators, Affiliations

A clonal expression biomarker associates with lung cancer mortality

Dhruva Biswas et al. Nat Med. 2019 Oct.

Erratum in

  • Publisher Correction: A clonal expression biomarker associates with lung cancer mortality.
    Biswas D, Birkbak NJ, Rosenthal R, Hiley CT, Lim EL, Papp K, Boeing S, Krzystanek M, Djureinovic D, La Fleur L, Greco M, Döme B, Fillinger J, Brunnström H, Wu Y, Moore DA, Skrzypski M, Abbosh C, Litchfield K, Al Bakir M, Watkins TBK, Veeriah S, Wilson GA, Jamal-Hanjani M, Moldvay J, Botling J, Chinnaiyan AM, Micke P, Hackshaw A, Bartek J, Csabai I, Szallasi Z, Herrero J, McGranahan N, Swanton C; TRACERx Consortium. Biswas D, et al. Nat Med. 2020 Jul;26(7):1148. doi: 10.1038/s41591-020-0899-z. Nat Med. 2020. PMID: 32494065

Abstract

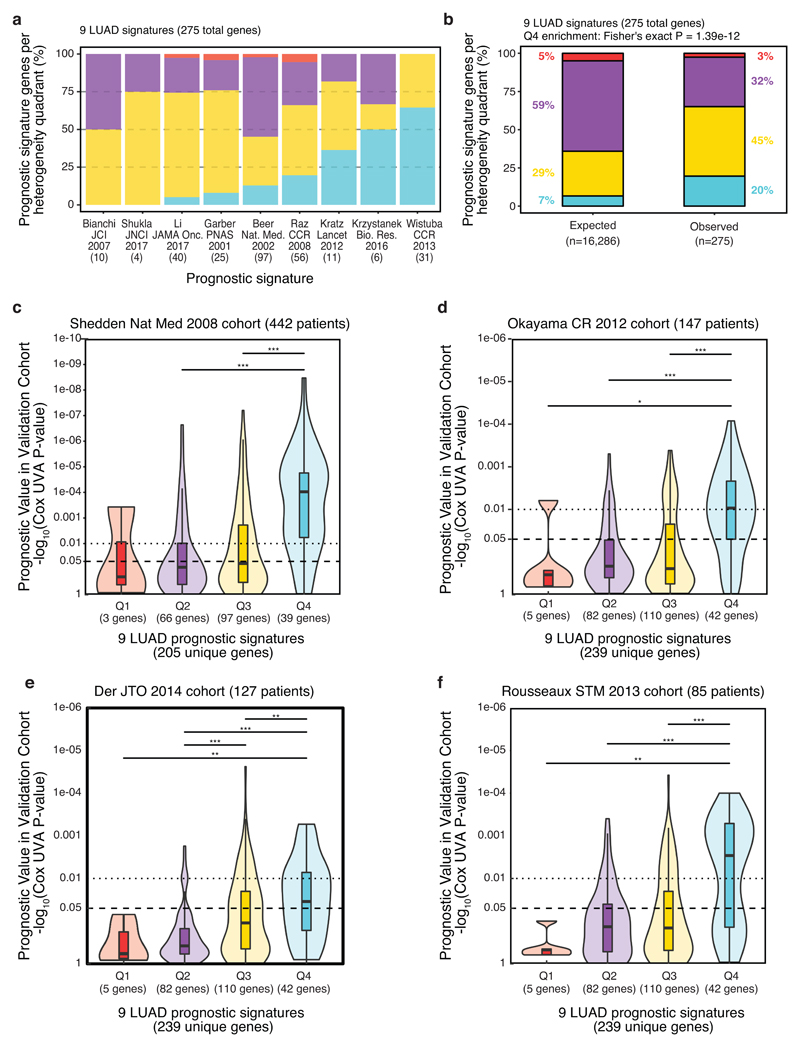
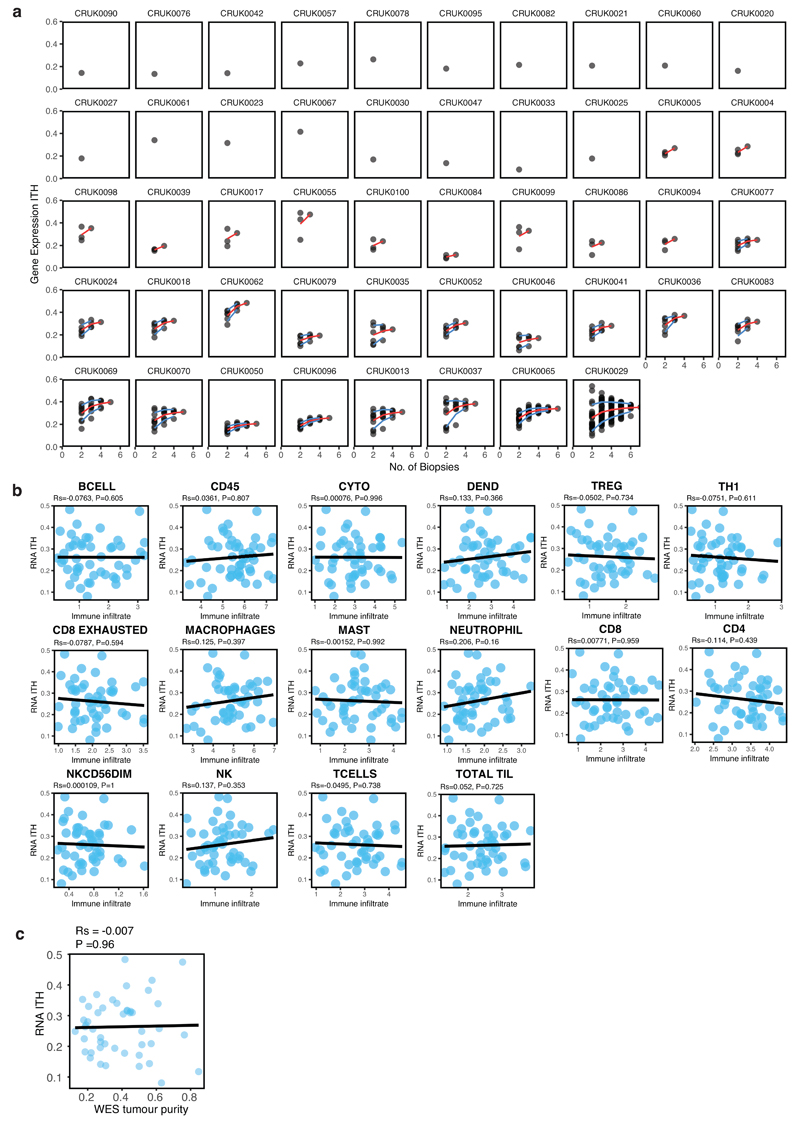
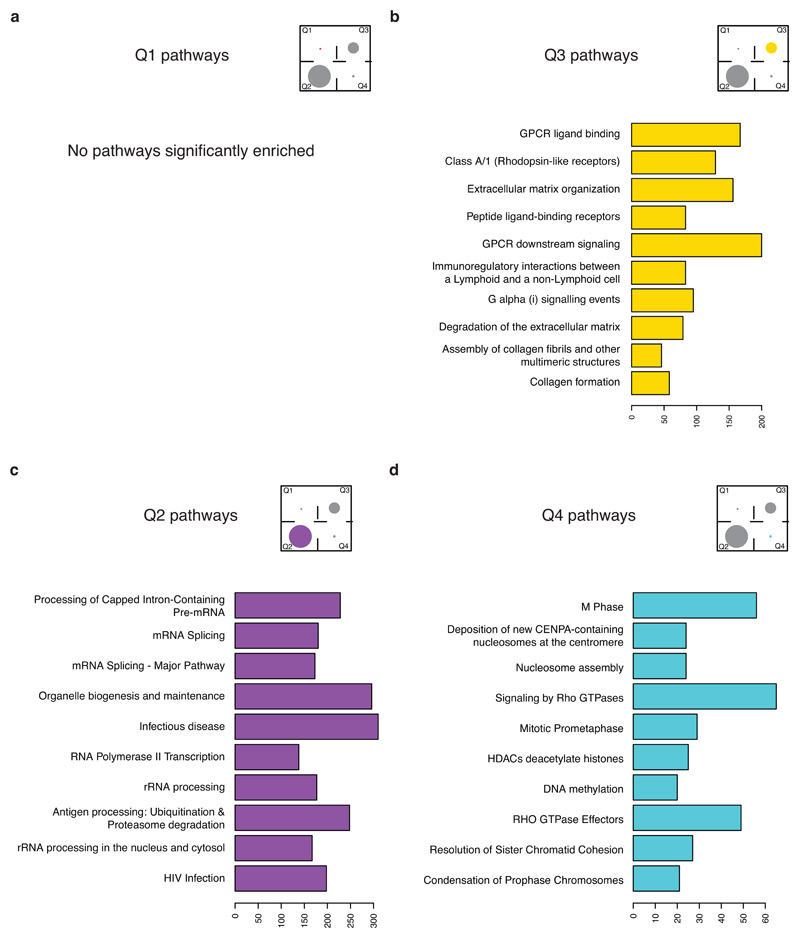
An aim of molecular biomarkers is to stratify patients with cancer into disease subtypes predictive of outcome, improving diagnostic precision beyond clinical descriptors such as tumor stage1. Transcriptomic intratumor heterogeneity (RNA-ITH) has been shown to confound existing expression-based biomarkers across multiple cancer types2-6. Here, we analyze multi-region whole-exome and RNA sequencing data for 156 tumor regions from 48 patients enrolled in the TRACERx study to explore and control for RNA-ITH in non-small cell lung cancer. We find that chromosomal instability is a major driver of RNA-ITH, and existing prognostic gene expression signatures are vulnerable to tumor sampling bias. To address this, we identify genes expressed homogeneously within individual tumors that encode expression modules of cancer cell proliferation and are often driven by DNA copy-number gains selected early in tumor evolution. Clonal transcriptomic biomarkers overcome tumor sampling bias, associate with survival independent of clinicopathological risk factors, and may provide a general strategy to refine biomarker design across cancer types.


Conflict of interest statement

Competing Interests

C.S. receives grant support from Pfizer, AstraZeneca, BMS, Roche and Ventana. C.S. has consulted for Pfizer, Novartis, GlaxoSmithKline, MSD, BMS, Celgene, AstraZeneca, Illumina, Genentech, Roche-Ventana, GRAIL, Medicxi, the Sarah Cannon Research Institute and is an Advisor for Dynamo Therapeutics. C.S. is a shareholder of Apogen Biotechnologies, Epic Bioscience, GRAIL, and has stock options in and is co-founder of Achilles Therapeutics. R.R. has stock options in and has consulted for Achilles Therapeutics. C.A. has received speaking honorarium or expenses from Novartis, Roche, AstraZeneca and BMS. M.A.B. has consulted for Achilles Therapeutics. G.A.W. is a shareholder of Achilles Therapeutics. M.J.-H. has consulted for and is an advisor for Achilles Therapeutics. D.B., N.J.B., N.M., and C.S. are co-inventors on a UK patent application (1901439.8) filed by Cancer Research Technology relating to methods of predicting survival rates for cancer patients.

Figures

Extended Data 1
Extended Data 1. Patient cohorts included in the study
a, CONSORT diagram for patient recruitment (left) and composition by tumour stage (right) of the TRACERx cohort. b, Patient composition of two RNAseq datasets: The Cancer Genome Atlas cohort (left), and the Uppsala cohort (right). c, Patient composition of four microarray datasets: Der et al, GSE50081 (top left); Okayama et al, GSE31210 (top right); Rousseaux et al, GSE30219 (bottom left); Shedden et al, GSE68465 (bottom right). Tumour stage (x-axis) and therapy status (colour) is indicated for all patient composition bar charts. LUAD = lung adenocarcinoma, LUSC = lung squamous cell carcinoma.
Extended Data 2
Extended Data 2. Analysis of the most variably expressed genes in TRACERx
a, The dendrogram and coloured heatmap (top) shows the hierarchical clustering of tumour regions (columns) in the TRACERx multi-region RNAseq cohort (156 tumour regions, 48 NSCLC patients, stage I-III) according to the top 500 variably expressed genes (rows). The sparse heatmap (bottom) shows tumour regions (coloured by histology) per patient (rows). b, Kaplan-Meier survival analysis of the largest two patient clusters from the dendrogram in (a). Statistical significance was tested with a two-sided log-rank test. c, The hierarchical clustering approach taken to quantify discordance rates for published signatures is illustrated for a non-RNAseq signature, Kratz et al, in TRACERx (n = 28 LUAD patients, stage I-III). As previously described by Gyanchandani et al, this clustering approach provides a metric that is invariant of gene expression profiling platform. For a given number of clusters, clustering concordance was quantified as the percentage of TRACERx patients with all tumour regions in the same cluster. This analysis was run iteratively from 2 to 28 clusters; 28 is the total number of TRACERx LUAD patients, hence clustering concordance of 100% at 28 clusters is the theoretical upper limit using this metric. The dendrogram and coloured heatmap (top) shows the clustering of tumour regions (columns) according to the expression pattern of genes comprising the prognostic signature (rows). The grayscale heatmap (bottom left) shows tumour regions per patient (rows). For a range of clusters (2, 3, 14, 28), the coloured bars (middle left) show the assignment of tumour regions to clusters, the grayscale bars (bottom right) show which patients have their tumour regions discordantly assigned (gray) across clusters, and the pie charts (middle right) show the percentage of discordantly classified patients. d, Discordance rates for 9 published LUAD prognostic signatures plotted as the percentage of patients with tumour regions clustering together against the number of clusters. Vertical dashed lines mark a range of clusters (2, 3, 14, 28) as highlighted in (c).
Extended Data 3
Extended Data 3. Intra- and inter-tumour RNA heterogeneity scores
a, Gene-wise and patient-wise RNA-ITH scores were calculated using multi-region RNAseq data (normalized count values) from TRACERx tumours (n=28 LUAD patients, 89 tumour regions, stage I-III). For a given tumour, the standard deviation of expression values for a particular gene across tumour regions was calculated yielding a gene-specific, patient-specific measure of RNA-ITH (σg,p). This was repeated for all genes, then all tumours, generating a matrix of σg,p values. Gene-wise RNA-ITH values are summarised as the average (median) value per gene across all tumours in the cohort (σg). Conversely, patient-wise RNA-ITH values are summarised as the average (median) value per tumour across all expressed genes (σp). Dashed lines indicate mean values. b, The scatter plots show the Spearman correlation between the chosen metric of intra-tumour expression variability (standard deviation) and alternative metrics, median absolute deviation (left) or coefficient of variation (right), as calculated in the TRACERx cohort (n=28 LUAD patients, 89 tumour regions, stage I-III). c, Diagram illustrating the calculation of gene-wise inter-tumour RNA heterogeneity scores through the random sampling of tumour regions from the TRACERx cohort (n=28 LUAD patients, 89 tumour regions, stage I-III; see Methods). d, The scatter plot shows the Spearman correlation between inter-tumour RNA heterogeneity scores calculated in TRACERx (n=28 LUAD patients, 89 tumour regions, stage I-III), randomly sampled to yield a sham single-biopsy cohort, and TCGA (n = 469 LUAD patients, stage I-III), a true single-biopsy cohort.
Extended Data 4
Extended Data 4. Clustering concordance and published prognostic signatures
a, Clustering concordance scores calculated in TRACERx (n=28 LUAD patients, 89 tumour regions, stage I-III) using the same method taken to estimate the sampling bias of microarray signatures as described by Gyanchandani et al (see Extended Data 2c-d). For each gene, a curve is calculated for the number of patients with all regions in the same cluster against the number of clusters (2-28 clusters). Curves for five genes (minimum = CKMT2, lower quartile = CYSLTR2, median = MCM2, upper quartile = MFSD1, maximum = HOXC11) are shown (top), in addition to summarised clustering concordance scores for all genes (bottom). b, Gene-wise clustering concordance scores stratified by RNA heterogeneity quadrant, both calculated in TRACERx (n=28 LUAD patients, 89 tumour regions, stage I-III). Boxplots represent the median, 25th and 75th percentiles and the vertical bars span the 5th to the 95th percentiles. Statistical significance was tested with a two-sided Wilcoxon signed rank sum test. “*” indicates a P-value < 0.05, “**” indicates a P-value < 0.01, “***” indicates a P-value < 0.001.
Extended Data 5
Extended Data 5. Analysis of published prognostic signatures for LUAD by RNA heterogeneity quadrant
a, The composition of published prognostic signatures by RNA heterogeneity quadrant, plotted in order of increasing percentage of Q4 genes (low intra- and high inter-tumour heterogeneity). b, Percentage of genes expected (total no. genes, as indicated in Fig. 2a) versus observed (in 9 published LUAD prognostic signatures) per RNA heterogeneity quadrant. Statistical significance was tested with a two-sided Fisher’s exact test. The ability of published prognostic genes for LUAD (the combined gene list from nine published signatures, 242 unique genes) to maintain prognostic value across patient cohorts is assessed (using Cox univariate survival analysis) in four microarray datasets: Shedden et al, GSE68465 (c); Okayama et al, GSE31210 (d); Der et al, GSE50081 (e); Rousseaux et al, GSE30219 (f). Boxplots represent the median, 25th and 75th percentiles and the vertical bars span the 5th to the 95th percentiles. Statistical significance was tested with a two-sided Wilcoxon signed rank sum test. “*” indicates a P-value < 0.05, “**” indicates a P-value < 0.01, “***” indicates a P-value < 0.001.
Extended Data 6
Extended Data 6. Prognostic signature design
a, Biomarkers are designed using state-of-the-art signature construction methods, replicated from Shukla et al (signature A and B), Chen et al (signature C), Reka et al (Signature D) and Kratz et al (signature E). In parallel, the “prognostic significance” filters (present in each signature construction method) were substituted with “clonal expression” filters, generating corresponding clonal signatures (signatures A-clonal, B-clonal, C-clonal, D-clonal, and E-clonal). Published signature construction methods are indicated in orange, novel methods integrating clonal biomarker design are indicated in blue. All signatures are developed in TCGA LUAD patients (n=469, stage I-III) as the training dataset. b, Flow diagram illustrating the gene selection steps for ORACLE. Criteria to identify prognostic and clonally expressed genes, and the number of genes selected at each step are indicated. c, Optimization of the number of genes to select at the clustering concordance step through 10-fold cross-validation in the training cohort (TCGA, n=469 LUAD patients, stage I-III). The optimal number of genes, with the lowest cross-validation error, is shown by the vertical red line. d, The cut-off to dichotomize the ORACLE risk-score into ‘high’ and ‘low’ risk groups is optimized in the training cohort (TCGA, n=469 LUAD patients, stage I-III). The horizontal blue line indicates a log-rank P-value = 0.01 and the optimal cut-off is shown by the vertical red line. Statistical significance was tested with a two-sided log-rank test. e, Tumour sampling bias of the ORACLE signature assessed using multi-region RNAseq data from TRACERx (n=28 LUAD patients, 89 tumour regions, stage I-III). Each point represents a single tumour region, vertical lines display the range for each patient, and patients are ordered by predicted survival risk score. Points are coloured according to the risk classification of tumour regions within a patient: concordant low-risk (blue), concordant high-risk (red), or discordant (gray).
Extended Data 7
Extended Data 7. Risk stratification using ORACLE
a, Kaplan-Meier plot of ORACLE in the RNAseq-based validation cohort (Uppsala, n=103 LUAD patients, stage I-III). Statistical significance was tested with a two-sided log-rank test. The ability of substaging criteria (b) and ORACLE (c) to split patients into prognostically informative groups is tested in stage I patients using the updated TNM version 8 criteria, shown as Kaplan-Meier plots for the Uppsala RNAseq dataset (n=53 LUAD patients, stage I, TNMv8). Statistical significance was tested with a two-sided log-rank test. d, The distribution of ORACLE risk scores by disease stage, shown for the Uppsala cohort (n=103 LUAD patients, stage I-III) and the MET500 cohort (n=8 metastatic samples from patients with LUAD primary tumours). Boxplots represent the median, 25th and 75th percentiles and the vertical bars span the 5th to the 95th percentiles. Statistical significance was tested with a Wilcoxon signed rank sum test. No corrections were made for multiple comparisons. e, The scatter plot shows the Spearman correlation between Ki67 staining % and ORACLE risk-scores in the TRACERx cohort (n=28 LUAD patients, 89 tumour regions, stage I-III).
Extended Data 8
Extended Data 8. ORACLE as a cancer cell expression signature
a, Spearman correlations between the infiltration of immune cell subsets, calculated from RNAseq data using the method described by Danaher et al, and ORACLE risk-scores in the TCGA dataset (n=469 patients, stage I-III). b, The scatter plot shows the Spearman correlation between ORACLE risk score and tumour purity assessed from whole-exome sequencing data using ASCAT, as described by Van Loo et al, in TRACERx (n=28 LUAD patients, 84 tumour regions, stage I-III). c, Lambrechts et al performed single-cell RNAseq on 52,698 cells sourced from 5 NSCLC patients, then defined 7 clusters of stromal cell genes and provided a per-cluster expression measure for every gene. The relative expression levels (y-axis) for each stromal cluster (coloured by cell-type, see figure legend) is plotted for all 23 genes comprising the ORACLE signature (bottom 3 rows). To aid interpretation, a marker gene for each of the 7 stromal cell clusters is also plotted (top row) for comparison: alveolar (AGER), B cell (MS4A1), epithelial (EPCAM), fibroblast (COL6A2), myeloid (CD68), T cell (CD3D), and vascular (FLT1) cell-types. d, Pearson correlations between the expression of individual ORACLE genes and copy-number state at the corresponding gene locus in the TRACERx cohort (n=28 LUAD patients, 89 tumour regions, stage I-III). Significant correlations (P<0.05) are marked in red, non-significant correlations are marked in blue.
Extended Data 9
Extended Data 9. Patient-level estimates of RNA-ITH and association with tumour cellular composition
a, RNA-ITH scores calculated from each tumour by sampling one to N biopsies (where N is the total number of biopsies yielded by that tumour) in TRACERx (n=48 NSCLC patients, 156 tumour regions, stage I-III). For each patient the RNA-ITH score (y-axis) is plotted for all possible subgroups of tumour regions against the number of biopsies (x-axis). The mean (red line) and standard deviation (blue lines) are shown for each tumour. b, The scatter plots show the Spearman correlation between patient-level RNA-ITH scores and RNAseq-based immune infiltration measures, calculated from RNAseq data using the method described by Danaher et al in TRACERx (n=48 NSCLC patients, 156 tumour regions, stage I-III). c, The scatter plot shows the Spearman correlation between patient-level RNA-ITH scores and tumour purity assessed from whole-exome sequencing data using ASCAT, as described by Van Loo et al, in TRACERx (n=48 NSCLC patients, 156 tumour regions, stage I-III).
Extended Data 10
Extended Data 10. Pathway analysis by RNA heterogeneity quadrant
The top 10 Reactome pathways for each RNA heterogeneity quadrant are plotted: low inter- and high intra- (Q1, a), low inter- and low intra- (Q2, b), high inter- and high intra- (Q3, c), high inter- and low intra- (Q4, d).
Fig. 1
Fig. 1. Tumour sampling bias confounds lung cancer biomarkers
a, Prognostic biomarkers classify tumour biopsies as high (red) or low risk (blue). The TRACERx trial samples multiple biopsies from each tumour (R1-4), however diagnosis is typically made using a single tumour biopsy (dashed triangle) in routine clinical practice. The hypothetical biomarker illustrated here exhibits discordant risk classification of tumour regions, thus the molecular read-out of the diagnostic biopsy (blue circle) is vulnerable to tumour sampling bias. b, Applied to a diagnostic biopsy (1) a prognostic biomarker stratifies lung cancer patients into more precise disease subtypes based on estimated survival risk (2), which may help inform therapeutic decision-making (3). For example correctly distinguishing high-risk patients (red), in need of adjuvant chemotherapy, from low-risk patients (blue) for whom surgery alone is curative. However, patients vulnerable to tumour sampling bias (gray) may be incorrectly stratified, resulting in assignment to a sub-optimal treatment and follow-up strategy. c, A published RNAseq prognostic signature for LUAD is evaluated in TRACERx (n = 28 LUAD patients, stage I-III). Each point represents a single tumour region and the vertical lines display the range for each patient. Points are coloured according to the risk classification of tumour regions within a patient: concordant low-risk (blue), concordant high-risk (red), or discordant (gray). d, Percentages of TRACERx patients (n = 28 LUAD patients, stage I-III) classified as concordant low-risk (blue), concordant high-risk (red), or discordant (gray) using two published RNAseq prognostic signatures for LUAD: Shukla et al (left), Li et al (right).
Fig. 2
Fig. 2. RNA inter- and intra-tumour heterogeneity quadrants
a, RNA heterogeneity quadrants calculated in TRACERx (n = 28 LUAD patients, stage I-III). RNA intra-tumour (y-axis) and inter-tumour heterogeneity (x-axis) are plotted on the axes as density curves. The plot is divided into quadrants by the mean intra-tumour (dashed horizontal line) and mean inter-tumour (dashed vertical line) heterogeneity scores. The quadrants are numbered and coloured (Q1=red, Q2=purple, Q3=yellow, Q4=blue) with the number of genes per quadrant indicated. b, Composition of published prognostic genes. Radar plot of the percentage of genes observed in 9 published LUAD prognostic signatures per quadrant (as indicated in Extended Data 5a-b), divided by the percentage of genes expected per quadrant (total no. genes, as indicated in Fig. 2a). c, Reproducible survival association of published prognostic genes. The ability of genes from published signatures to maintain prognostic value in an independent patient cohort (TCGA, n = 469 LUAD patients, stage I-III) was assessed as the gene-wise Cox univariate P-value (y-axis), stratified by RNA heterogeneity quadrant (x-axis). Boxplots represent the median, 25th and 75th percentiles and the vertical bars span the 5th to the 95th percentiles. Statistical significance was tested with a two-sided Wilcoxon signed-rank test. d, Cross-cohort prognostic significance of random signatures. 1000 random signatures were developed in the TCGA RNAseq cohort (n = 469 LUAD patients, stage I-III), derived using 20 genes randomly sampled from each RNA heterogeneity quadrant, then tested for prognostic ability across four microarray cohorts comprised of stage I-III LUAD patients (Shedden et al n = 442, Okayama et al n = 147, Der et al n = 127, Rousseaux et al n = 85).
Fig. 3
Fig. 3. Clonal gene selection improves prognostic accuracy over conventional biomarker design and beyond clinicopathological risk factors
a, Prognostic value of conventional versus clonal biomarker design. Prognostic signature development requires gene selection, followed by the application of a machine learning algorithm (see Extended Data 6a). Several conventional methods are replicated from published studies,,, (orange), and a clonal version of each signature is generated in parallel (blue). In addition, a de novo strategy, prioritizing the selection of clonally expressed genes (see Extended Data 6b-d and Methods for details), is used to derive the Outcome Risk Associated Clonal Lung Expression (ORACLE) biomarker. All signatures are developed in the TCGA RNAseq dataset (n=469 LUAD patients, stage I-III). Prognostic accuracy of the resulting signatures was assessed in the Uppsala RNAseq dataset (n=103 LUAD patients, stage I-III) as an independent cohort of patients. b, Prognostic value of ORACLE assessed in a meta-analysis across five validation cohorts of LUAD patients. Univariate Cox analysis was performed in one RNAseq dataset (Uppsala) and four microarray datasets (Shedden et al, Okayama et al, Der et al, Rousseaux et al). Hazard ratios with a 95% confidence interval are shown for each cohort and are plotted on a natural log scale. The diamond indicates the hazard ratio for the meta-analysis of five validation cohorts. c, Prognostic value over known risk factors. Multivariate Cox analysis was performed in the Uppsala RNAseq dataset (n=103 LUAD patients, stage I-III), incorporating ORACLE risk score, tumour stage, therapy status, patient age, WHO performance status, smoking status, patient gender and Ki67 staining percentage. Hazard ratios with a 95% confidence interval are shown for each variable and are plotted on a natural log scale. d, Prognostic value in stage I patients. The ability of substaging criteria (left) versus ORACLE (right) to split patients into prognostically informative groups is tested in stage I patients. Kaplan-Meier plots with log-rank P-values calculated in the Uppsala RNAseq dataset (n=60 stage I LUAD patients). All statistical tests were two-sided.
Fig. 4
Fig. 4. Pan-cancer prognostic relevance and the genomic underpinning of RNA heterogeneity quadrants
a, Survival association of RNA heterogeneity quadrants across cancer types. Gene-wise pan-cancer survival associations are evaluated by NSCLC RNA heterogeneity quadrants. Z-scores were sourced from the PRECOG database (n = 17,808 tumours from 39 malignant histologies). A |z| score > 1.96 is equivalent to a two-sided P < 0.05. Boxplots represent the median, 25th and 75th percentiles and the vertical bars span the 5th to the 95th percentiles. Statistical significance was tested with a two-sided t-test. b, Survival association of RNA heterogeneity quadrants for individual cancer types. Each point corresponds to 1 out of 33 cancer types sourced from the PRECOG database (n = 17,808 tumours from 39 malignant histologies). The number of prognostically significant genes (|z| score > 1.96, equivalent to a P value < 0.05) per NSCLC RNA heterogeneity quadrant is indicated for each cancer type as non-significant (gray), significantly enriched (red, odds ratio > 1) or significantly depleted (blue, odd ratio < 1). Odds ratios are plotted on a natural log scale. Statistical significance was tested with a two-sided Fisher’s exact test. No corrections were made for multiple comparisons. c, Gene expression ITH correlated with copy-number ITH. The scatter plot shows the Spearman correlation between patient-wise RNA-ITH scores and patient-wise SCNA-ITH scores calculated in the TRACERx cohort (n = 28 LUAD patients, stage I-III).d, Association between subclonal chromosomal copy-number changes and gene expression. This analysis was performed using 118,943 paired SCNA and RNA values in TRACERx (143 regions from 44 NSCLC tumours; sample selection criteria described in Methods). Boxplots represent the median, 25th and 75th percentiles and the vertical bars span the 5th to the 95th percentiles. Statistical significance was tested with a two-sided paired t-test. e, Enrichment or depletion of specific copy number states by heterogeneity quadrant. All genes were assigned a copy number state across all samples (clonal/subclonal gain or loss, or no change). Genes were then tested for enrichment or depletion of a specific category by RNA heterogeneity quadrant. Odds ratios are plotted on a natural log scale. Statistical significance was tested with a two-sided Fisher’s exact test. f, Pathway analysis on Q4 genes using Reactome, showing the top 5 pathways most significantly enriched in Q4 genes (low intra- and high inter-tumour heterogeneity).

Comment in

References

    1. Vargas AJ, Harris CC. Biomarker development in the precision medicine era: lung cancer as a case study. Nat Rev Cancer. 2016;16:525–537. - PMC - PubMed
    1. Lee W-C, et al. Multiregion gene expression profiling reveals heterogeneity in molecular subtypes and immunotherapy response signatures in lung cancer. Mod Pathol. 2018:1. doi: 10.1038/s41379-018-0029-3. - DOI - PubMed
    1. Gerlinger M, et al. Intratumor Heterogeneity and Branched Evolution Revealed by Multiregion Sequencing. N Engl J Med. 2012;366:883–892. - PMC - PubMed
    1. Gulati S, et al. Systematic Evaluation of the Prognostic Impact and Intratumour Heterogeneity of Clear Cell Renal Cell Carcinoma Biomarkers. Eur Urol. 2014;66:936–948. - PMC - PubMed
    1. Gyanchandani R, et al. Intratumor Heterogeneity Affects Gene Expression Profile Test Prognostic Risk Stratification in Early Breast Cancer. Clin Cancer Res. 2016;22:5362–5369. - PMC - PubMed

Publication types

Substances