. 2019 Oct;25(10):1576-1588.
doi: 10.1038/s41591-019-0590-4. Epub 2019 Oct 7.

Single-cell immune landscape of human atherosclerotic plaques

Affiliations

Single-cell immune landscape of human atherosclerotic plaques

Dawn M Fernandez et al. Nat Med. 2019 Oct.

Abstract

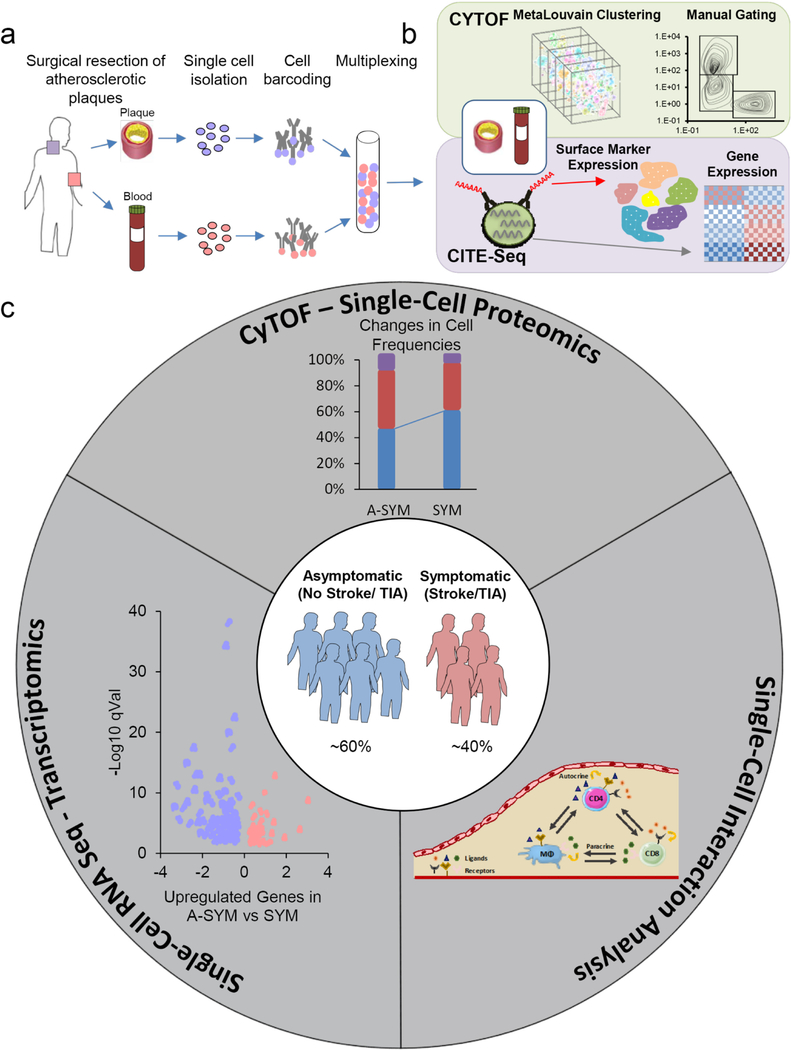
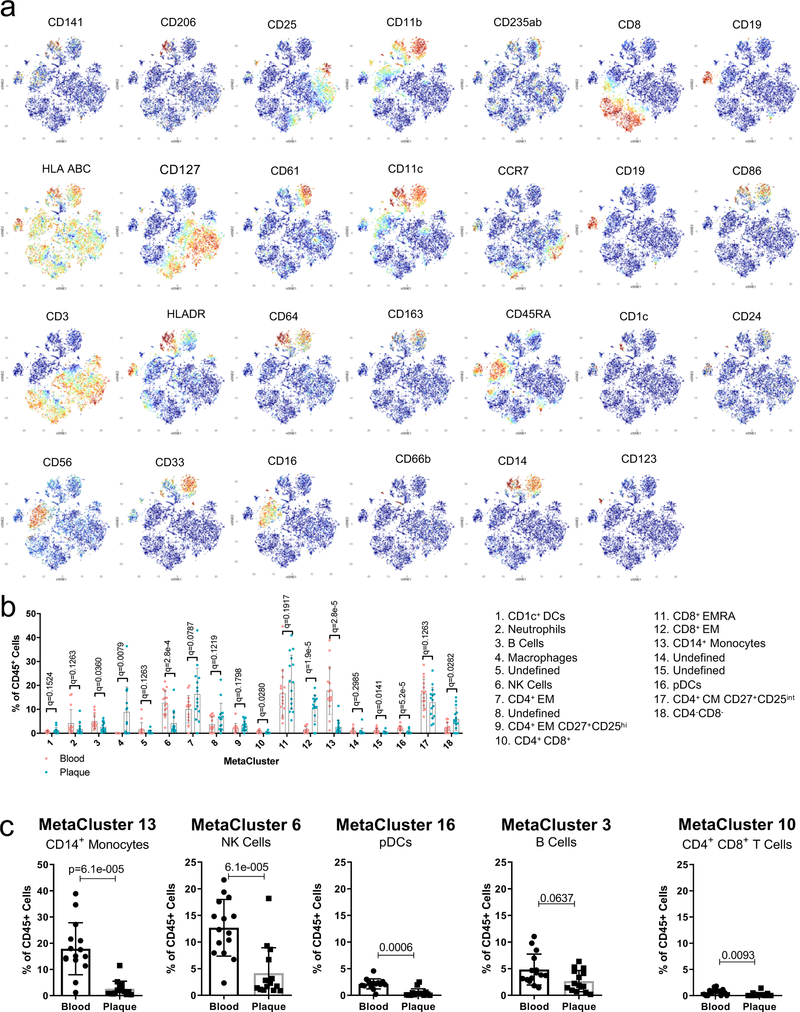
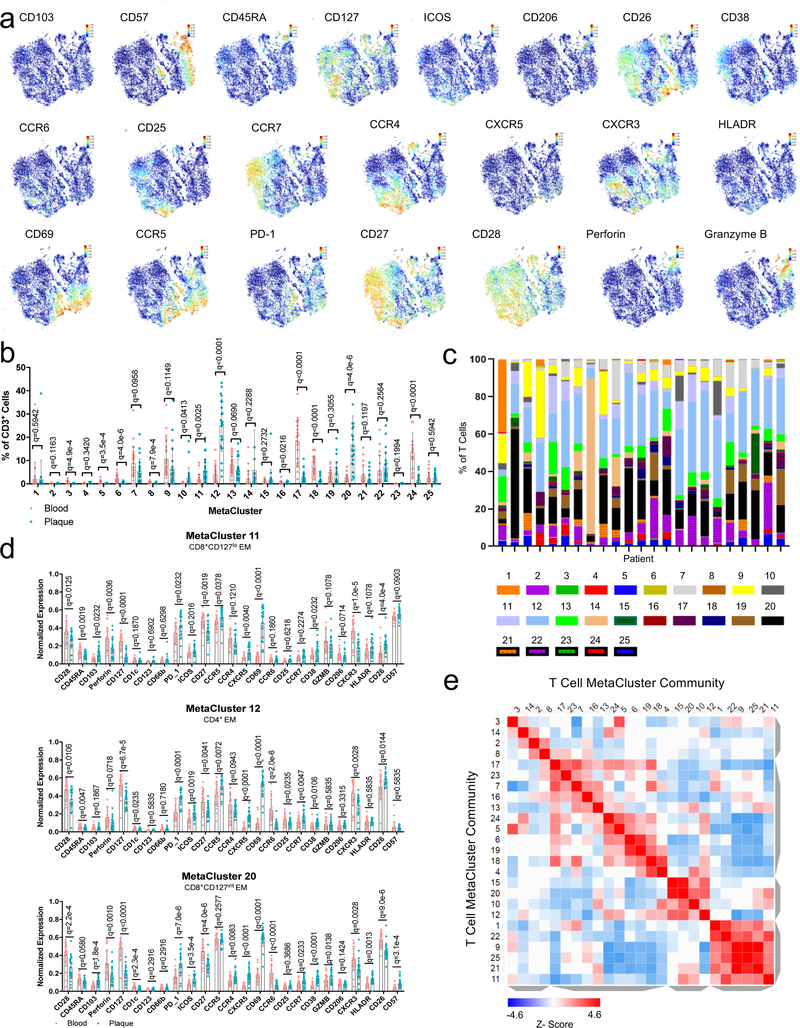
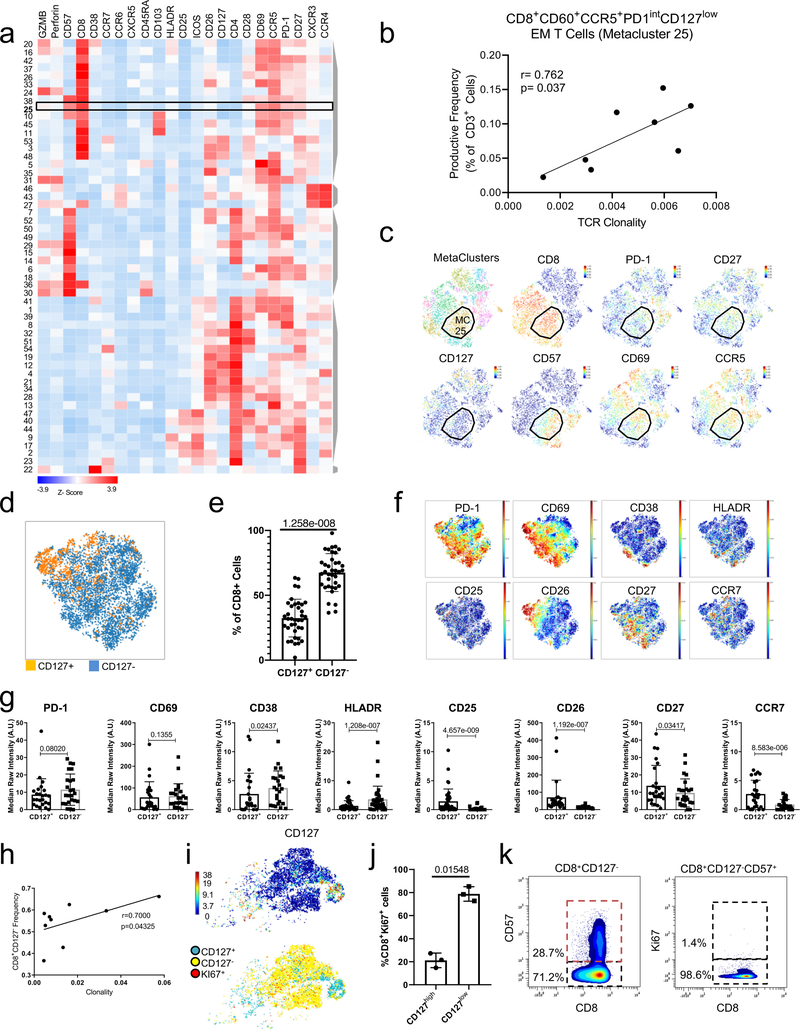
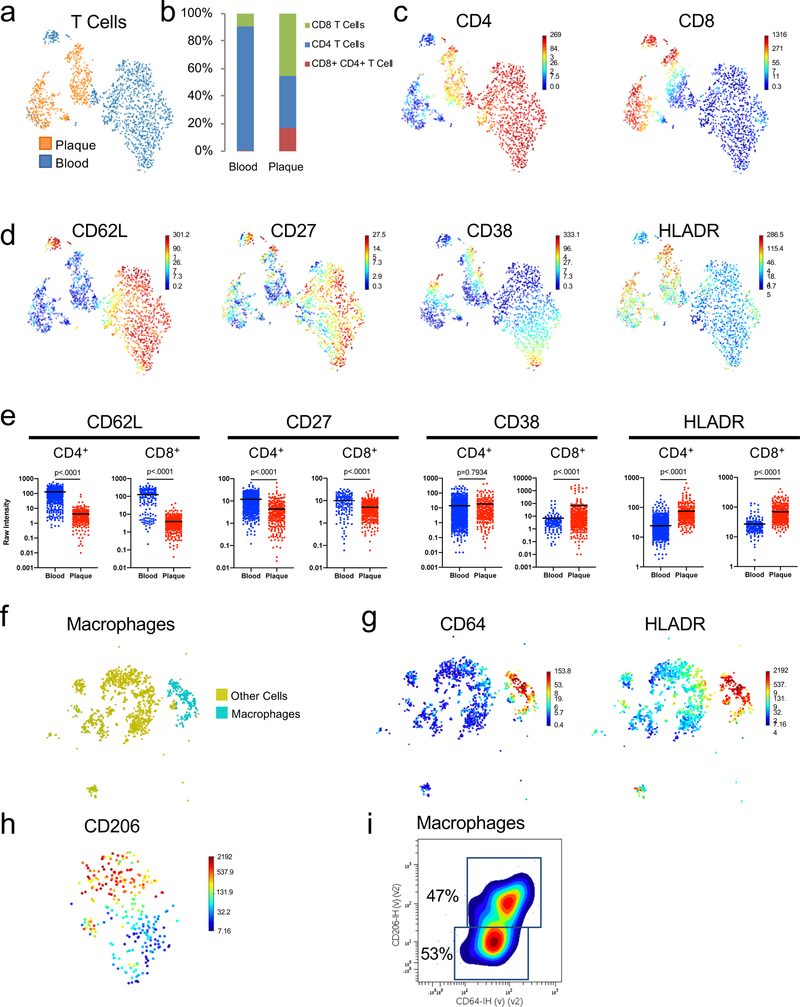
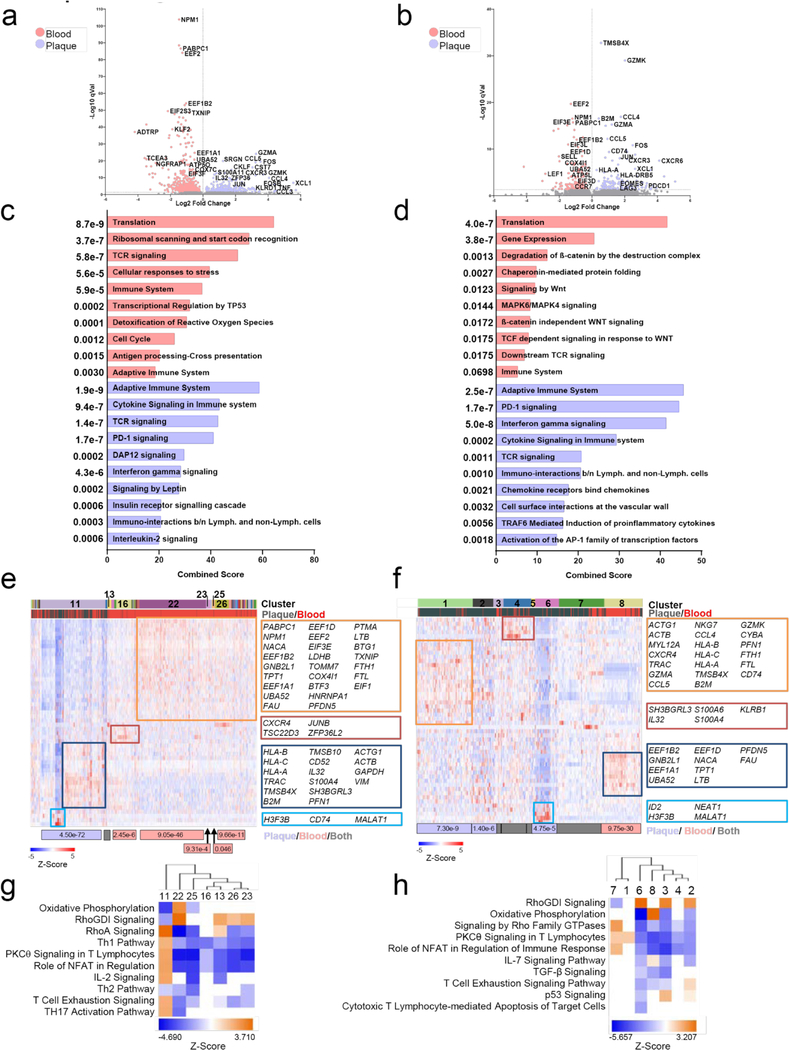
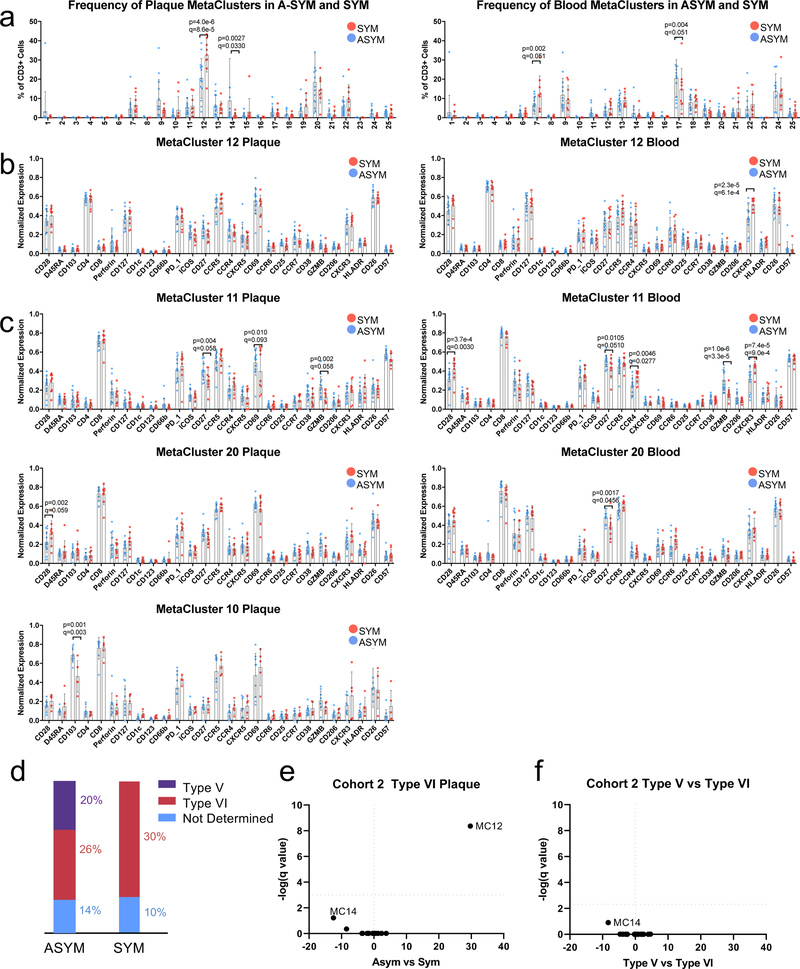
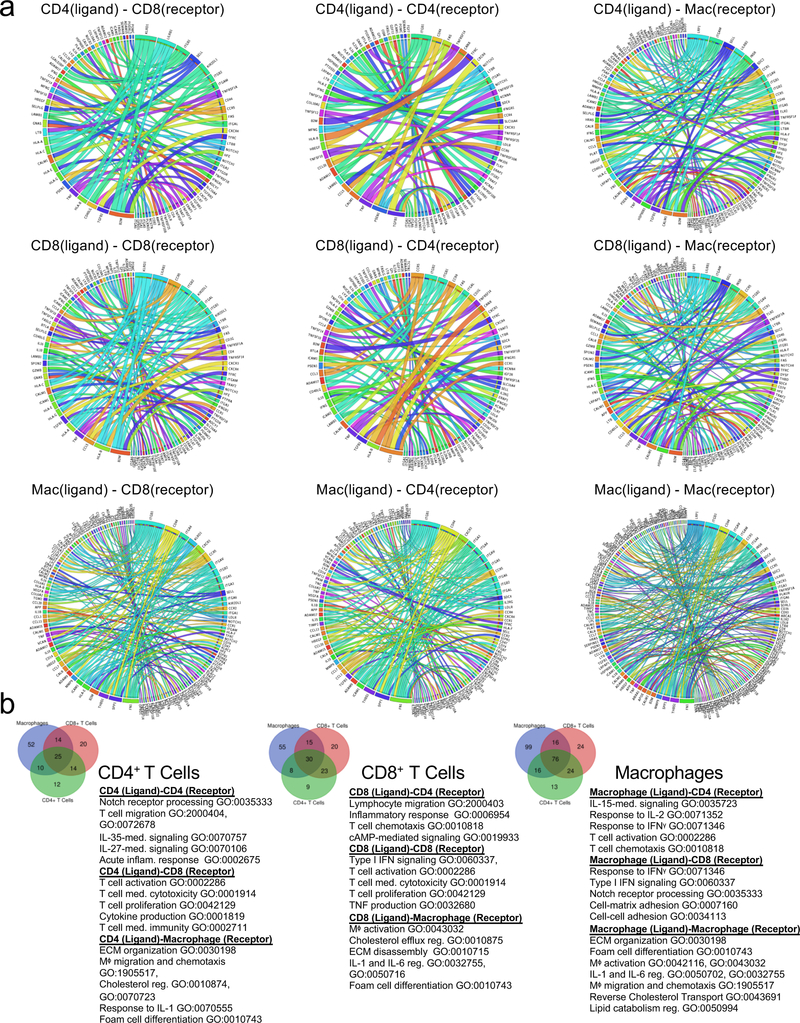
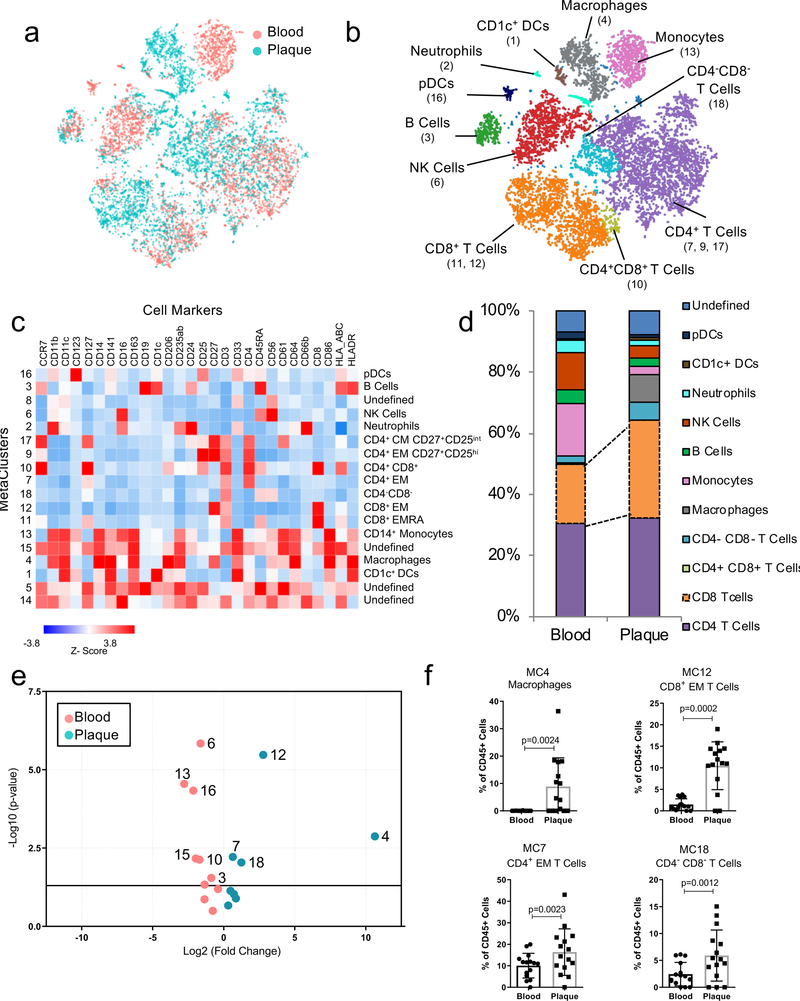
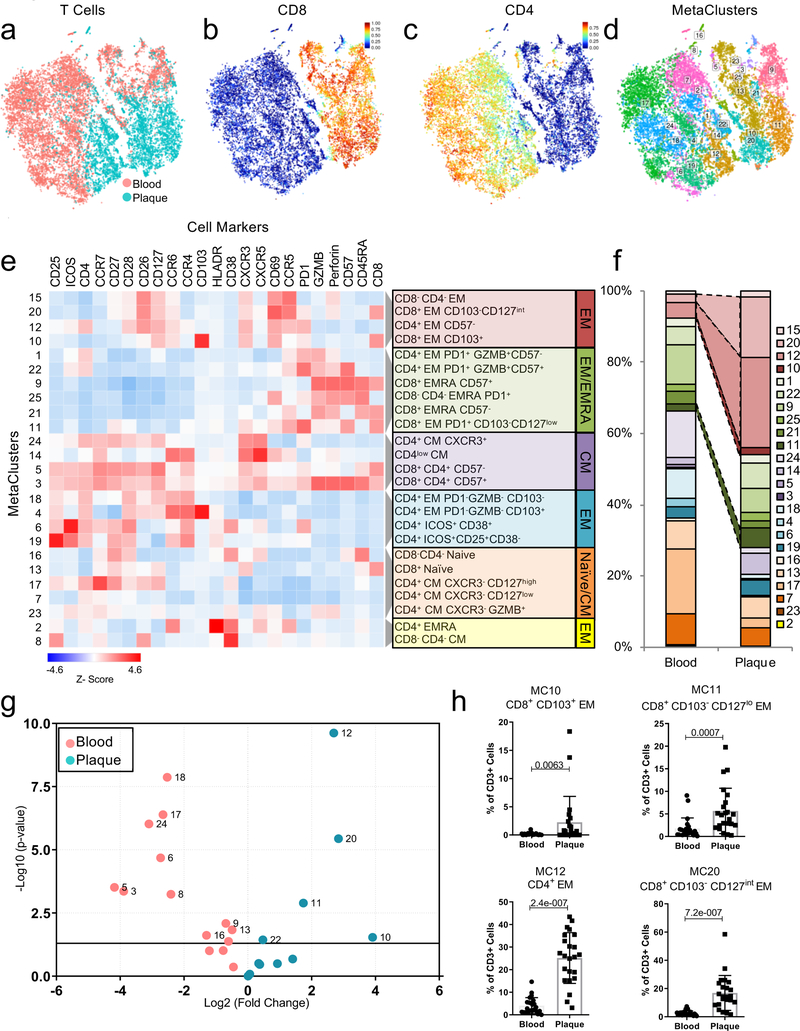
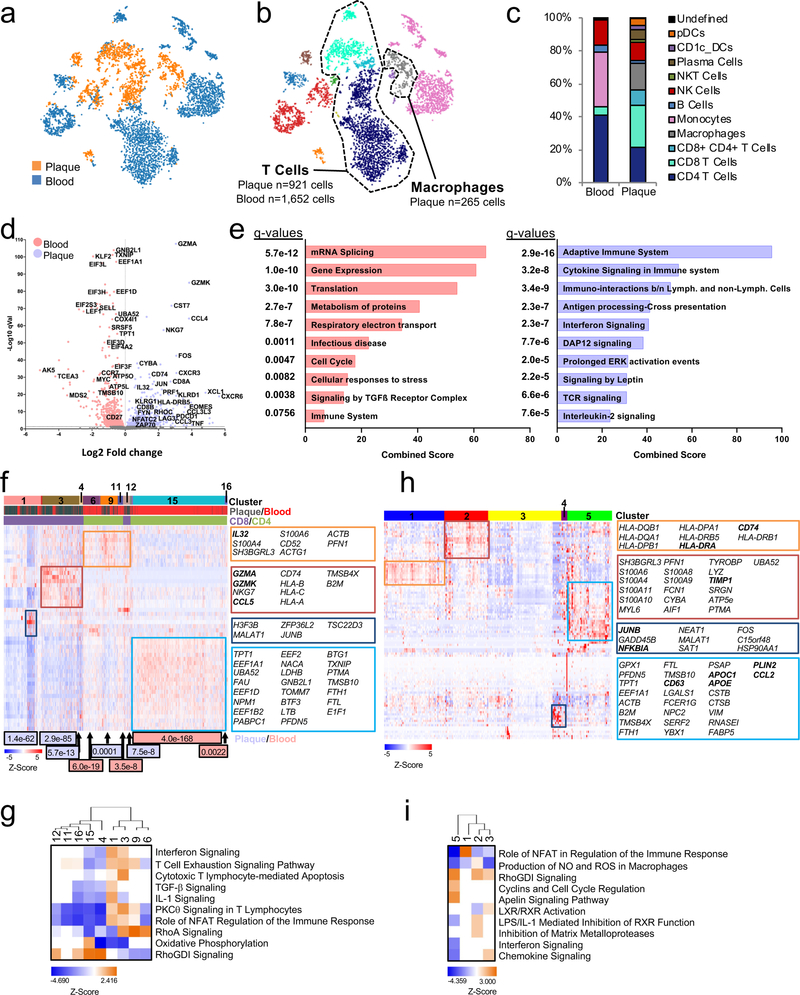
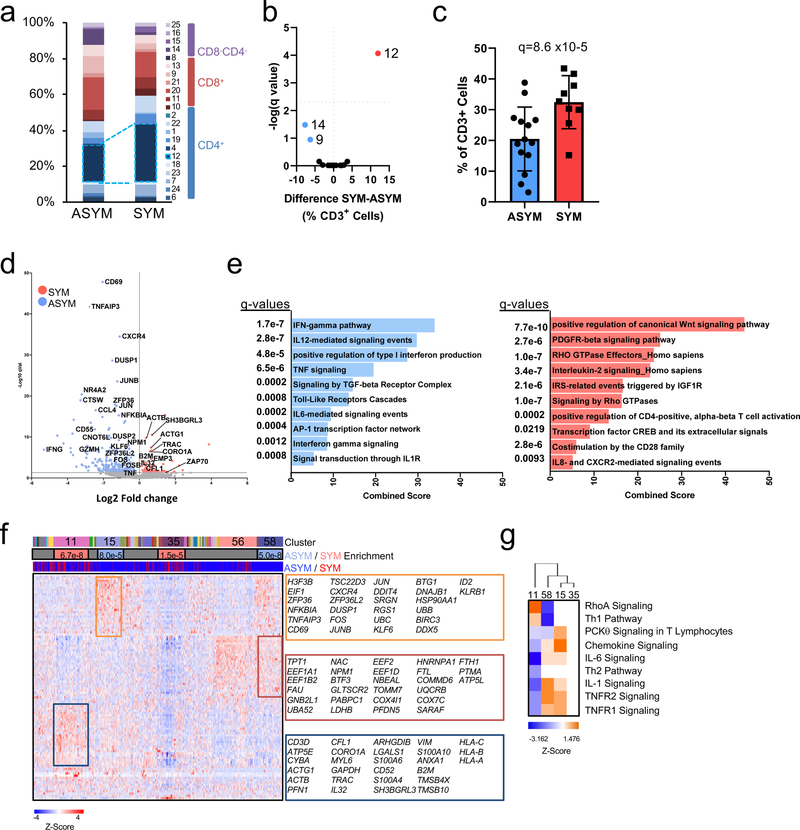
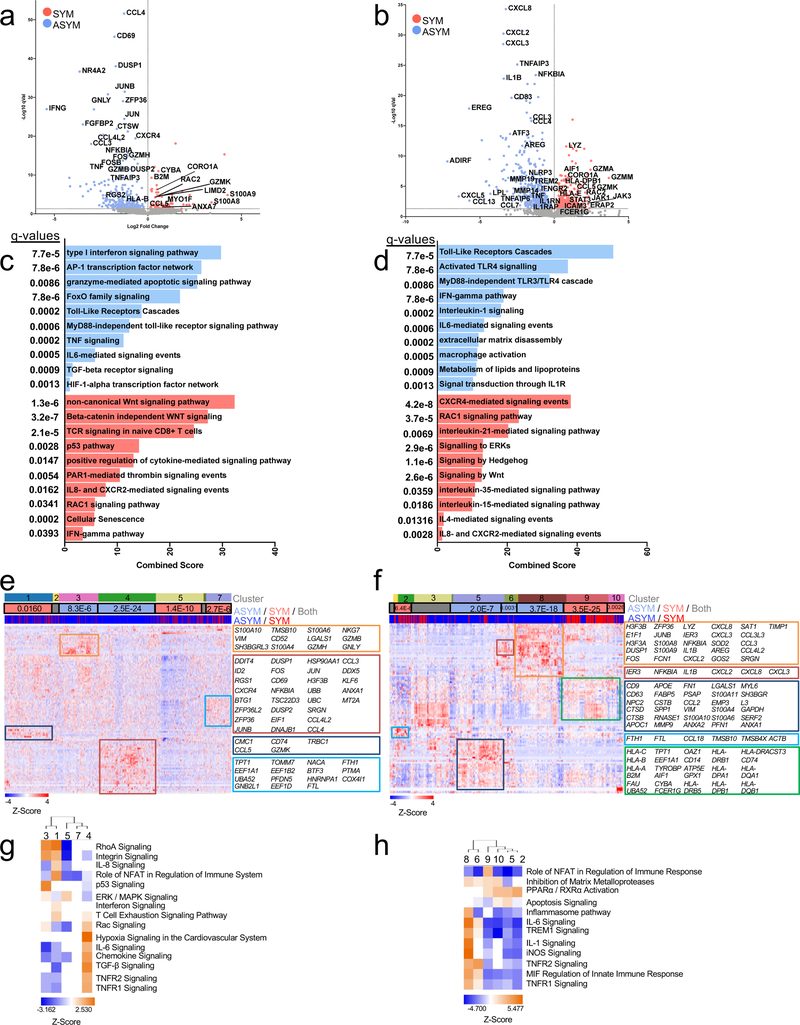
Atherosclerosis is driven by multifaceted contributions of the immune system within the circulation and at vascular focal sites. However, specific characteristics of dysregulated immune cells within atherosclerotic lesions that lead to clinical events such as ischemic stroke or myocardial infarction are poorly understood. Here, using single-cell proteomic and transcriptomic analyses, we uncovered distinct features of both T cells and macrophages in carotid artery plaques of patients with clinically symptomatic disease (recent stroke or transient ischemic attack) compared to asymptomatic disease (no recent stroke). Plaques from symptomatic patients were characterized by a distinct subset of CD4+ T cells and by T cells that were activated and differentiated. Moreover, some T cell subsets in these plaques presented markers of T cell exhaustion. Additionally, macrophages from these plaques contained alternatively activated phenotypes, including subsets associated with plaque vulnerability. In plaques from asymptomatic patients, T cells and macrophages were activated and displayed evidence of interleukin-1β signaling. The identification of specific features of innate and adaptive immune cells in plaques that are associated with cerebrovascular events may enable the design of more precisely tailored cardiovascular immunotherapies.


Figures

Extended Data Fig. 1.
Extended Data Fig. 1.. Study overview.
(a) Schematic illustration of the collection and processing of paired atherosclerotic plaque and blood from each patient. (b) Schematic illustration of the CyTOF and CITE-seq studies of paired atherosclerotic tissue and blood. Immune cells from blood and plaque were used in CyTOF mass cytometry studies where data were defined using MetaLouvain clustering and Manual Gating. CITE-seq on blood and plaque cells related the surface marker expression of individual cells to the cell’s transcriptome. (c) Schematic illustration of single-cell analysis of plaques from patients with symptomatic disease (stroke or TIA) as compared to patients without symptomatic disease (no recent stroke): a three tier approach. The analysis included single-cell proteomic data from CyTOF studies, gene expression data from scRNA-seq studies, and cell-cell interaction studies based on patterns of ligand and receptor expression. ADT: Antibody-tag data from CITE-seq; GEX: gene expression data from CITE-seq.
Extended Data Fig. 2.
Extended Data Fig. 2.. Definition of MetaClusters from Cohort 1.
(a) Representative ViSNE plots of Louvain clustered immune cells (n=9,490 cells) overlaid by protein expression in spectral colors. (b) Scatter bar plot of MC frequencies in blood and plaque from 15 patients. Statistical significance was determined using a two-sided unpaired t-test with multiple comparisons corrected by two-stage linear step procedure of Benjamini, Krieger and Yekuteli with FDR=0.5%. Annotated MC communities are shown on the right. (c) Scatter bar plots of blood-enriched MCs from 15 patients, showing the MC frequency stratified by tissue type. MCs are annotated by their cell type. Data were analyzed with the two-sided Wilcoxon test. Values are mean ± SD.
Extended Data Fig. 3.
Extended Data Fig. 3.. Tissue–specific MetaClustering and canonical T cell definition by manual gating.
(a) MetaLouvain Clustering of CD45+ cells from atherosclerotic plaque tissue from n=15 patients. (b) Average population frequency of plaque-derived MCs. (c, d) Representative Louvain clustered viSNE plot of n=4,386 cells overlaid by MC distribution (c), and selected myeloid surface marker expression in spectral colors (d). (e) Volcano plot of the difference of MC frequencies in ASYM (n=8 patients, left) and SYM (n=7 patients, right) atherosclerotic plaques. Statistical significance was determined using two-sided unpaired t-test with multiple comparisons corrected using the two-stage linear step up procedure of Benjamini, Krieger, and Yekutieli with FDR=0.5% (f-h) Manual gating analysis of the T-cell compartment from 24 patients. (f) viSNE plots of n=19,882 T cells overlaid by tissue origin (top left), CD4 and CD8 population (top right), effector status (bottom left), or classical definition (bottom right). (g,h) Scatter bar plots of manually gated cell populations from n=24 patients. Values are mean ± SD, p values were determined by two-sided Wilcoxon test.
Extended Data Fig. 4
Extended Data Fig. 4. Definition of the T cell compartment from Cohort 2.
(a) viSNE plots of Louvain clustered T cells (n=10,000 cells) overlaid by the protein marker expression in spectral colors. (b,) Scatter bar plots of T-cell MC frequencies in blood and plaque of n=23 patients. (c) Bar chart of MC frequencies per patient of the 23 patients. (d) Scatter bar plots of normalized surface marker expression of plaque-enriched MCs in blood and plaque. Statistical significance for (b) and (d) were determined using multiple unpaired two-sided Student’s t-tests corrected by two-stage linear step procedure of Benjamini, Krieger and Yekuteli with FDR=0.5%. For all scatter bar plots, values are mean ± SD. (e) Similarity matrix of T cell MetaClusters based on the cosine distance method
Extended Data Fig. 5.
Extended Data Fig. 5.. Unique T-Cell Signature in Atherosclerotic Plaques.
Scatter bar plots of normalized protein marker expression in plaque-enriched T cell MetaClusters (MCs) across 23 patients, and stratified by tissue type (a-d), and comparison of MCs 10, 11, and 20 in plaque tissue (e). Statistical analysis used an unpaired two sided Student’s t-test (a-d), and One-Way ANOVA test with Bonferroni’s post-hoc correction (e). Values are mean ± SD
Extended Data Fig. 6.
Extended Data Fig. 6.. Tissue–specific T cell Metaclustering identifies a replicative senescent CD8+ T cell population.
(a) Heatmap of MetaCluster communities of CD3+ T cells from atherosclerotic plaque by surface marker expression tissue (n=23). (b) Correlations between TCR clonality in plaque and the frequency of MetaCluster 25 in 8 patients by two-sided Pearson correlation test. (c) Representative viSNE plots of n=10,000 cells showing the MC distribution and expression of selected markers. (d-e) Analysis of manually gated CD8+ T cells from cohorts 1 and 2 combined (n=37 patients). (d) Representative viSNE plot overlaid by CD8+CD127+ and CD8+CD127 populations. (e) Scatter bar plot of CD8+CD127+/− frequencies from 37 patients, assessed by two-sided paired Student’s t test. Values are mean ± SD. (f) viSNE plots of n=8,086 cells overlaid with expression of T cell functional markers. (g) Scatter bar plots of the median values of T cell functional markers available between cohorts 1 and 2. CCR7, CD26, CD38, PD1, CD69 were available from 24 patients; CD27 from 25 patients, CD25, HLADR from 37 patients. p values were determined using Wilcoxon test, and values are mean ± SD. (h) Correlations between TCR clonality and CD8+CD127- cell frequency from 9 patients. Two-sided Spearman correlation test was used. (i) ViSNE plots of representative CD8+ T cell population in plaque of n=9,025 cells overlaid with CD127 expression (top), or by subpopulation: CD127+ (blue), CD127- (yellow), and Ki67+ (red) (bottom). (j) Percent of Ki67+ cells in CD127 subpopulations from 3 independent experiments (n=3). Statistic determined using a two-sided paired Student’s t test. Values are mean ± SD. (k) Representative contour plots of CD8+CD127- plaque T cells gated for CD57 expression, and the CD8+CD127-CD57+ subpopulation gated for Ki67 expression.
Extended Data Fig. 7.
Extended Data Fig. 7.. Analysis of the CITE-seq ADT Expression.
viSNE plots of T cells (n=2,315 cells) clustered using the ADT data, and overlaid by (a) tissue type, or expression of canonical (c) or functional (d) T cell markers. (b) Frequency of T cell subtypes per tissue. (e) Functional surface marker expression in individual cells per tissue type. For CD8+ T cells, n=379 plaque cells and n=159 blood cells. For CD4+ T cells, n=287 plaque cells and n=1,387 blood cells. The approximate P values were determined using a two-sided Mann-Whitney test, lines indicate the mean. (f, g) viSNE plots of plaque cells (n=1,708 cells) overlaid to indicate macrophage population (f), or expression of macrophage markers (g). (h) viSNE plot of clustered macrophages (n=300 cells) overlaid with CD206 expression. (i) Macrophage population of the CITE-seq experiment gated for expression of CD206 and CD64.
Extended Data Fig. 8
Extended Data Fig. 8. Single-Cell Gene Expression analysis of CD8+ and CD4+ T Cells in paired blood and plaque.
(a, b) Volcano plot of the top 5000 Differentially Expressed Genes (DEGs) (determined by two-sided Welch’s T- Test and Benjamini-Hochberg correction) in (a) CD4+ T Cells and (b) CD8+ T Cells T cells of plaque or blood. (c, d) Pathway analysis of (c) CD4+ and (d) CD8+ T cell DEGs with q<0.05 (CD4+, n=930 genes; CD8+, n=310 genes) upregulated in blood (left) and plaque (right). The combined score metric corresponds to the P value (two-sided Fisher’s exact test) multiplied by the Z-score of the deviation from the expected rank, and q values determined by Benjamini-Hochberg correction. (e, f) Heatmap of hierarchically clustered top 50 variable genes across (e) CD4+ (n=1,830 total cells, n=347 plaque cells, n=1,483 blood cells) and (f) CD8+ (n=579 total cells, n=420 plaque cells, n=159 blood cells) T cells in plaque and blood. Rows: z-scored gene expression values; columns: individual cells. Above the heatmap, categories of identified cell clusters (top) cell’s origin from plaque or blood (bottom). Below the heatmap, cluster enrichment in tissue type is displayed with p values (two-sided binomial proportions test). Boxes (right) list key genes found in clusters. (g, h) Canonical signaling pathway analysis of the top 5000 DEGs in the indicated cell clusters from (g) CD4+ and (h) CD8+ T cells.
Extended Data Fig. 9.
Extended Data Fig. 9.. Dysregulation of T cells between SYM and ASYM patients.
Scatter bar plots of MetaCluster (MC) frequencies and protein expression in plaque-enriched MCs from 23 patients. (a) T cell MC frequencies and MC marker expression (b-c) in plaque enriched CD4+ (b) or CD8+ (c) T cell MCs. Blood (right) and plaque (left). Asymptomatic patients (A-SYM, blue) and symptomatic patients (SYM, red). Statistics were determined by two-sided multiple t-test and FDR (1%) correction using the two-stage step up procedure of Benjamini, Krieger, and Yekuteli. Values are mean ± SD. (d) AHA plaque type classification in SYM and ASYM plaques of cohort 2 (n=23). (e, f) Volcano plot of T cell MCs (n=23 patients) according to clinical phenotype in type VI plaques from SYM and ASYM patients (e), or according to plaque type (type VI vs. type IV) in all 23 patients (f). q values determined by two-sided multiple t-test with FDR=0.5% corrected using Benjamini, Krieger and Yekuteli method.
Extended Data Fig. 10.
Extended Data Fig. 10.. Protein-Ligand Interactions.
(a) Circos plots of the significant ligand-receptor interactions between cell types, mediated by CD4+ T cells (top row), CD8+ T Cells (middle row), or macrophages (bottom row). (b) Venn diagrams of ligand-receptor pairs from the top 5000 genes (>0.5 Log2 fold change) show unique and overlapping paired between cell-types. Gene Ontology terms were identified for each group using Enrichr.
Figure 1.
Figure 1.. T cells and macrophages dominate the atherosclerotic plaque immune landscape.
MetaLouvain clustering of CD45+ cells derived from blood and plaque tissue (n=15 patients). Representative ViSNE plots of Louvain clustered immune cells (n= 9,490) overlaid with tissue type (a) or immune cell populations (b). Parentheses indicate the MetaCluster (MC) Community. (c) Heatmap of normalized, Z-scored protein expression of MC data, relating the MC communities (left) found across both tissue types to the expression of protein markers (top) and the annotated cell types (right). (d) Bar chart of the relative frequency of immune cell types derived from aggregated MC data in blood and plaque. pDC, plasmacytoid dendritic cell; DC, dendritic cell. (e) Volcano plot of the fold change of MC frequency in plaque and blood from 15 patients. P values were calculated using a paired, two-sided Student’s t-Test and FDR corrected using Benjamini-Hochberg. (f) Scatter bar plots of plaque-enriched MCs from 15 patients, showing the MC frequency stratified by tissue type. MCs are annotated by their cell type. Data were analyzed with the two-sided Wilcoxon test. Values are mean ± SD.
Figure 2.
Figure 2.. Diversity of the T cell compartment in human atherosclerosis.
(a-d) MetaLouvain clustering of CD3+ T cells from blood and plaque tissue from 23 patients. Representative viSNE plots of Louvain clustered T cells (n=10,000 cells) overlaid with tissue type (a), spectral colors indicating protein expression of the T-cell markers CD8 (b) and CD4 (c), and with the respective MetaLouvain clustered (MetaCluster, MC) communities that are found numbered in boxes on top. (e) Clustergrammer heatmap showing protein marker expression (top) in each MC (left) and the canonical annotation of these communities (right). The dendrogram bars (light gray) indicate the clustering of MCs based on the cosine distance method in Clustergrammer. (f) Bar chart of the relative frequency of T cell MCs in blood and plaque. (g) Volcano plot of the fold change of MC frequency in blood (left) and atherosclerotic plaque (right). P values were calculated using a paired, two-sided Student’s t-Test and FDR corrected using Benjamini-Hochberg (h) Scatter bar plots of plaque-enriched T cell MCs from 23 patients, showing that MC frequency stratified by tissue type. MCs are annotated by their cell type. Data were analyzed with the two-sided Wilcoxon test. Values are mean ± SD.
Figure 3.
Figure 3.. Combined epitope and transcriptomic analysis of paired atherosclerotic plaque and blood using CITE-seq.
(a, b) viSNE plots (n=5,362 cells) clustered by Antibody Derived Tag (ADT) expression and overlaid with tissue (a) or immune cell (b) type. (c) Bar chart of cell type frequencies in blood and plaque. (d-i) CITE-Seq gene expression data from T cells (plaque n=921; blood n=1,652) and macrophages (n=265). (d) Volcano plot of the top 5000 Differentially Expressed Genes (DEGs) (determined by two-sided Welch’s T- Test and Benjamini-Hochberg correction) in T cells of plaque or blood. (e) Pathway analysis of T cell DEGs with q<0.05 (n=1,570 genes) upregulated in blood (left) and plaque (right). The combined score metric corresponds to the P value (two-sided Fisher’s exact test) multiplied by the Z-score of the deviation from the expected rank, and q values determined by Benjamini-Hochberg correction. Heatmap of hierarchically clustered (f) top 50 variable genes across T cells (n=2,573 cells) in plaque and blood, and (h) top 100 variable genes across macrophages (n=265 cells). Rows: z-scored gene expression values; columns: individual cells. Heatmap categories (above) of identified cell clusters. (f), the middle category indicates the cell’s origin from plaque or blood; the bottom category indicates the cluster’s identity as CD8+ or CD4+ T cells. Cluster enrichment in tissue type is displayed below the heatmap with p values (two-sided binomial proportions test). Boxes (right) list key genes found in clusters. (g, i) Canonical signaling pathway analysis of the top 5000 DEGs in the indicated cell clusters from T cells (g) and macrophages (i).
Figure 4.
Figure 4.. Dysregulation of CD4+ T cells associated with cerebrovascular events.
(a-c) Cohort 2 MC analyses on 23 patients stratified by asymptomatic (ASYM, n=14) and symptomatic (SYM, n=9). (a) Frequencies of MCs in plaque, sidebar (right) indicates MC T cell subtype(b) Volcano plot of MCs enriched in SYM (red) or ASYM (blue). (c) Frequency of T cells belonging to MC12 in plaques from ASYM and SYM patients. Values are mean ± SD. For (b, c) q values determined by two-sided multiple t-test with FDR=0.5% corrected using the Benjamini, Krieger and Yekuteli method. (d-g) Single-cell gene expression data of CD4+ T cells (n=1,200) from atherosclerotic plaques of both SYM (n=2) and ASYM (n=4) patients. (d) Volcano plot of the top 5000 Differentially Expressed Genes (DEGs), determined by two-sided Welch’s T- Test and Benjamini-Hochberg correction, that were upregulated in SYM and ASYM(e) Pathway analysis of CD4+ T cell DEGs (n=5,000 genes) in plaques upregulated in SYM (right) and ASYM (left). The combined score metric corresponds to the P value (two-sided Fisher’s exact test) multiplied by the Z-score of the deviation from the expected rank, and q values determined by Benjamini-Hochberg correction. (f) Heatmap of hierarchically clustered top 100 variable genes across CD4+ T cells (n=1,200 cells) in SYM and ASYM patients. Rows: z-scored gene expression values; columns: individual cells. The top category of the heatmap shows identified cell clusters, the middle category indicates the cluster’s enrichment in SYM/ ASYM patients (p values determined by the two-sided binomial proportions test), and the bottom category indicates the cell’s origin from SYM or ASYM subjects. Boxes (right) list key genes found in corresponding clusters. (g) Canonical signaling pathway analysis of the top 5000 DEGs in the indicated cell clusters from plaques from SYM or ASYM patients.
Figure 5.
Figure 5.. Transcriptional dysregulation of CD8+ T cells and macrophages associated with cerebrovascular events.
Volcano plots of the top 5000 Differentially Expressed Genes (DEGs) upregulated in SYM (red) and ASYM (blue) patients in (a) CD8+ T cells (n=1,747 cells) and (b) macrophages (n=747 cells)DEGs were statistically derived using a two-sided Welch’s T- Test combined with Benjamini-Hochberg correction. Pathway analysis of the top 5000 DEGs of (c) CD8+ T cells and (d) macrophages in plaques upregulated in SYM and ASYM patients. The combined score corresponds to the P value (two-sided Fisher’s exact test) multiplied by the Z-score of the deviation from the expected rank, and q values were determined using the Benjamini-Hochberg multiple hypothesis correction. Heatmap of the top 100 variable genes hierarchically clustered in (e) CD8+ T cells and (f) macrophages across SYM and ASYM patients. Rows: z-scored gene expression values; columns: individual cells. Above the heatmap, the top category shows identified cell clusters, the middle category indicates the cluster’s enrichment in SYM/ ASYM patients (p values determined by the two-sided binomial proportions test), and the bottom category indicates the cell’s origin from SYM or ASYM subjects. Boxes (right) list key genes found in clusters. (g) Canonical signaling pathway analysis of the top 5000 DEGs in the indicated cell clusters from plaques from SYM or ASYM patients.
Figure 6.
Figure 6.. Cell-cell interactions associated with cerebrovascular events.
(a-c) Heat maps of the top 30 differentially-expressed ligand-receptor interactions between Symptomatic (SYM) and Asymptomatic (ASYM) plaques based on the log2 fold change across ligands and visualized using Clustergrammer. Gene ontology terms associated with the functions of the ligands and receptors are labeled to the left. Ligand-receptor interactions are shown for T cell-T cell interactions (a), T cell-macrophage interactions and macrophage-T cell interactions (b), and macrophage-macrophage interactions (d). Interactions are presented as (ligand-receptor). (d) Schematic illustrating the key innate and adaptive immune functional alterations and main differences in cell-cell communications identified in plaques from ASYM and SYM patients, see text for details.

Comment in

References

    1. Tabas I & Lichtman AH Monocyte-Macrophages and T Cells in Atherosclerosis. Immunity 47, 621–634 (2017). - PMC - PubMed
    1. Libby P. Superficial erosion and the precision management of acute coronary syndromes: not one-size-fits-all. European heart journal 38, 801–803 (2017). - PubMed
    1. Moreno PR, et al. Macrophage infiltration in acute coronary syndromes. Implications for plaque rupture. Circulation 90, 775–778 (1994). - PubMed
    1. Jawien J. The role of an experimental model of atherosclerosis: apoE-knockout mice in developing new drugs against atherogenesis. Current pharmaceutical biotechnology 13, 2435–2439 (2012). - PubMed
    1. van der Heiden K, Hoogendoorn A, Daemen MJ & Gijsen FJ Animal models for plaque rupture: a biomechanical assessment. Thrombosis and haemostasis 115(2015). - PubMed

Publication types

MeSH terms