. 2019 Oct;25(10):1549-1559.
doi: 10.1038/s41591-019-0592-2. Epub 2019 Oct 7.

Spatial heterogeneity of the T cell receptor repertoire reflects the mutational landscape in lung cancer

Collaborators, Affiliations

Spatial heterogeneity of the T cell receptor repertoire reflects the mutational landscape in lung cancer

Kroopa Joshi et al. Nat Med. 2019 Oct.

Erratum in

  • Publisher Correction: Spatial heterogeneity of the T cell receptor repertoire reflects the mutational landscape in lung cancer.
    Joshi K, de Massy MR, Ismail M, Reading JL, Uddin I, Woolston A, Hatipoglu E, Oakes T, Rosenthal R, Peacock T, Ronel T, Noursadeghi M, Turati V, Furness AJS, Georgiou A, Wong YNS, Ben Aissa A, Sunderland MW, Jamal-Hanjani M, Veeriah S, Birkbak NJ, Wilson GA, Hiley CT, Ghorani E, Guerra-Assunção JA, Herrero J, Enver T, Hadrup SR, Hackshaw A, Peggs KS, McGranahan N, Swanton C; TRACERx consortium; Quezada SA, Chain B. Joshi K, et al. Nat Med. 2020 Jul;26(7):1148. doi: 10.1038/s41591-020-0866-8. Nat Med. 2020. PMID: 32494063

Abstract

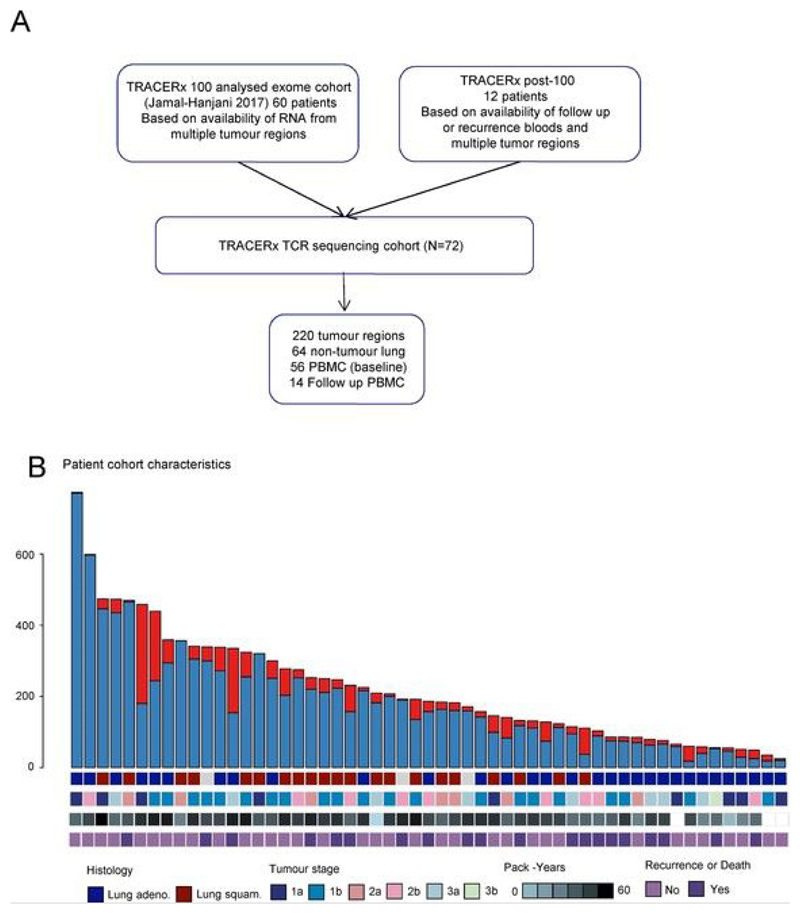
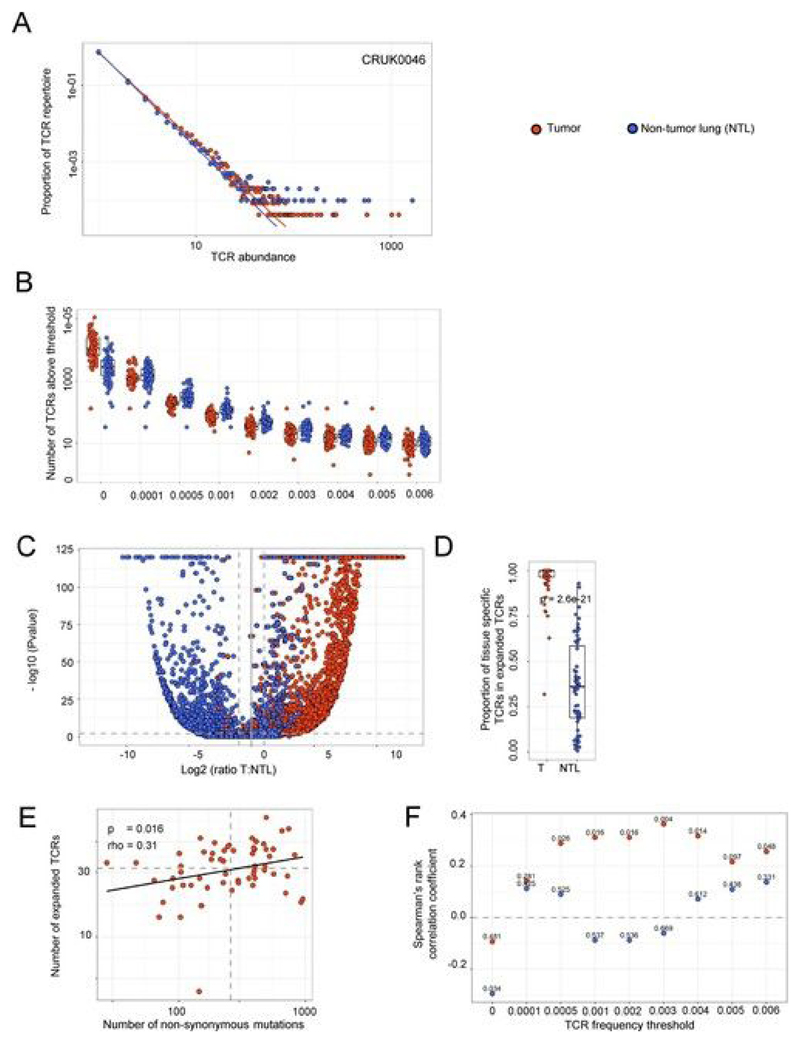
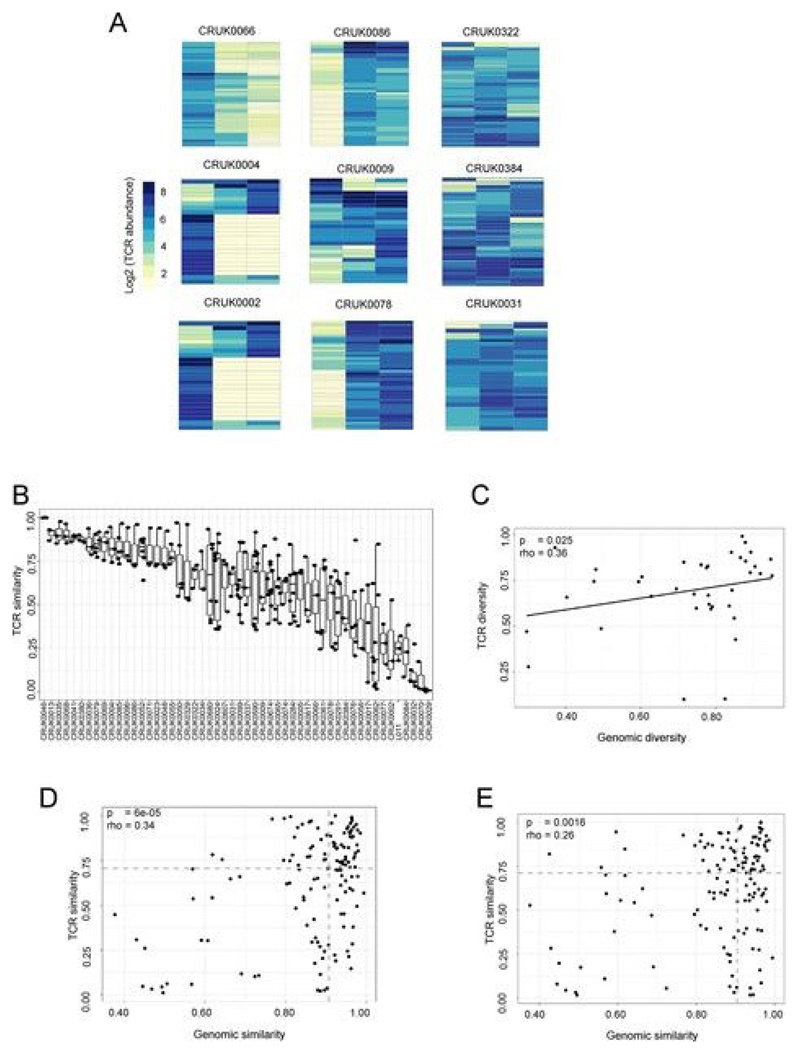
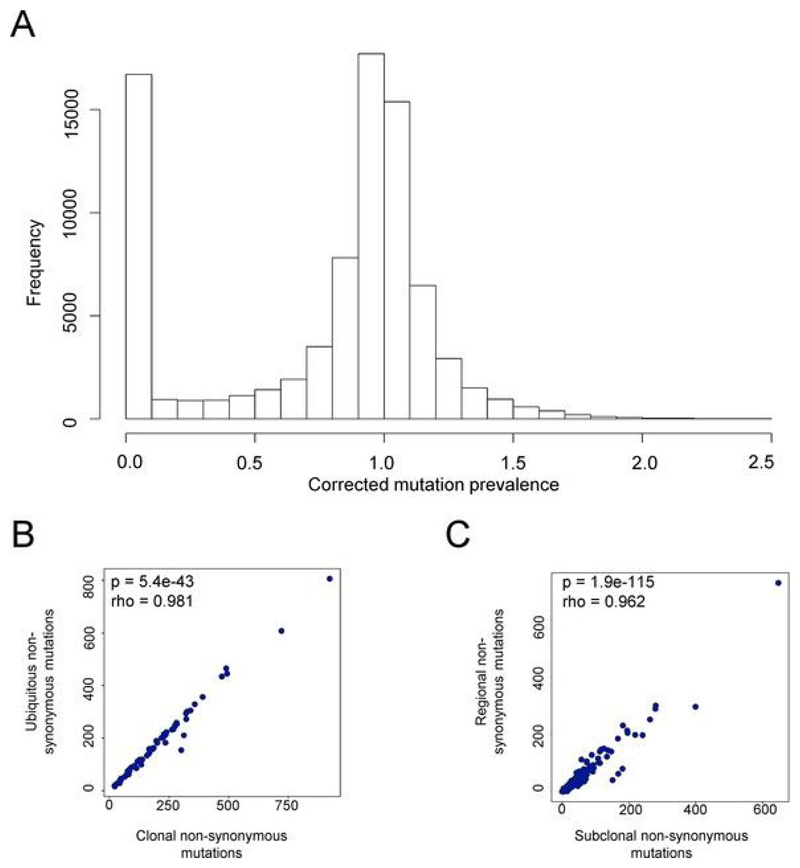
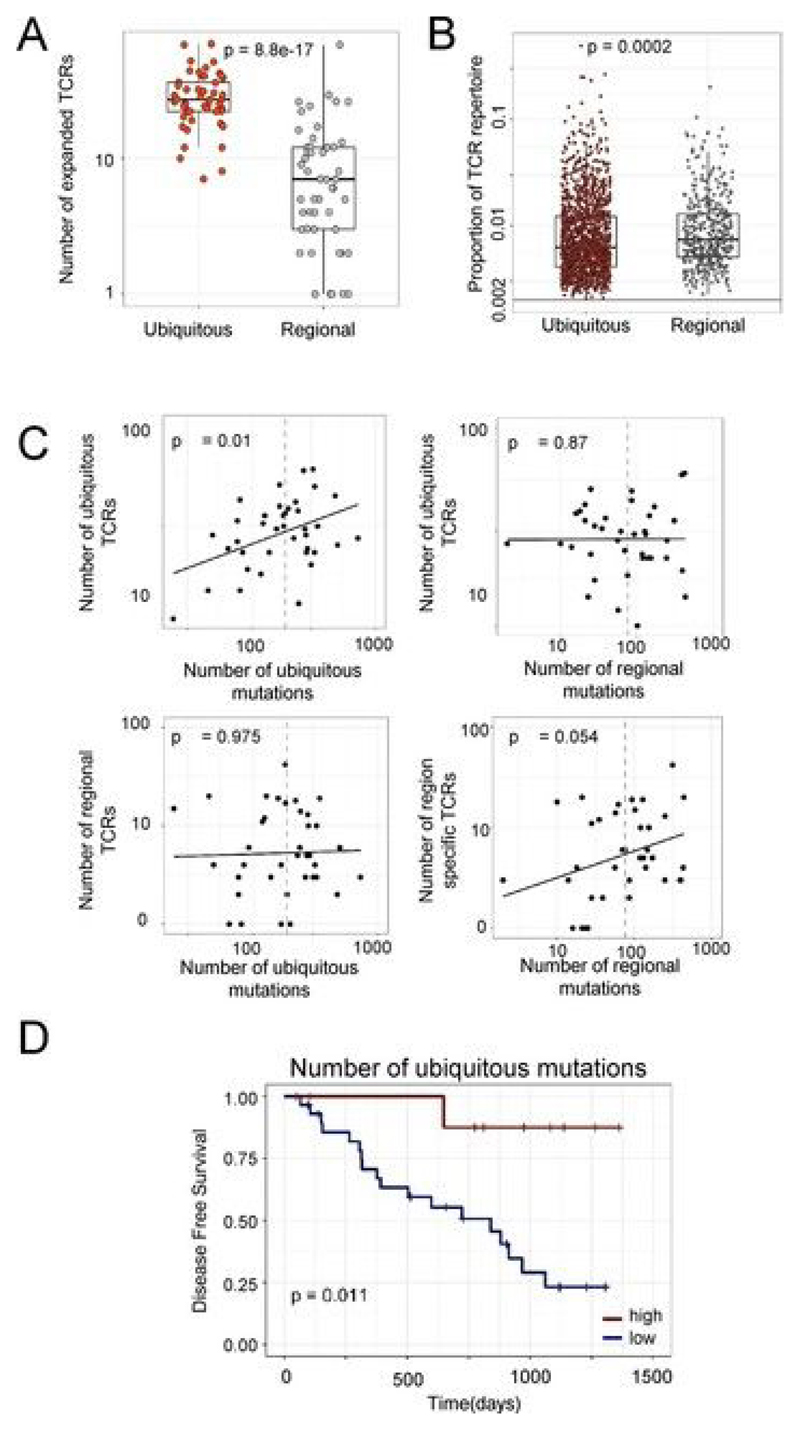
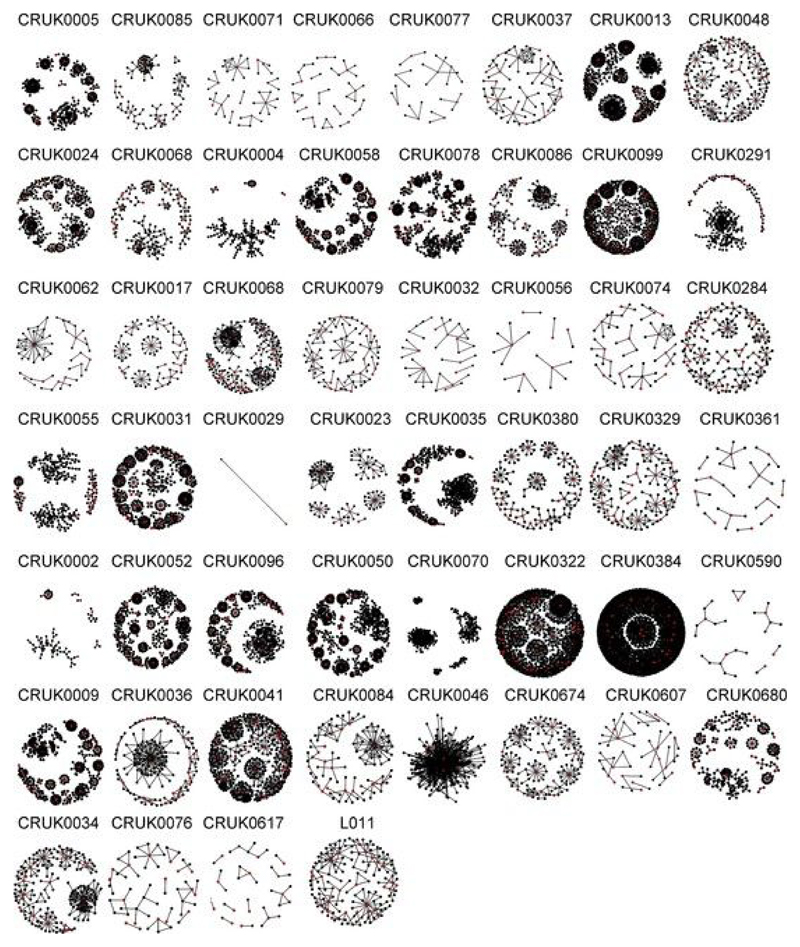
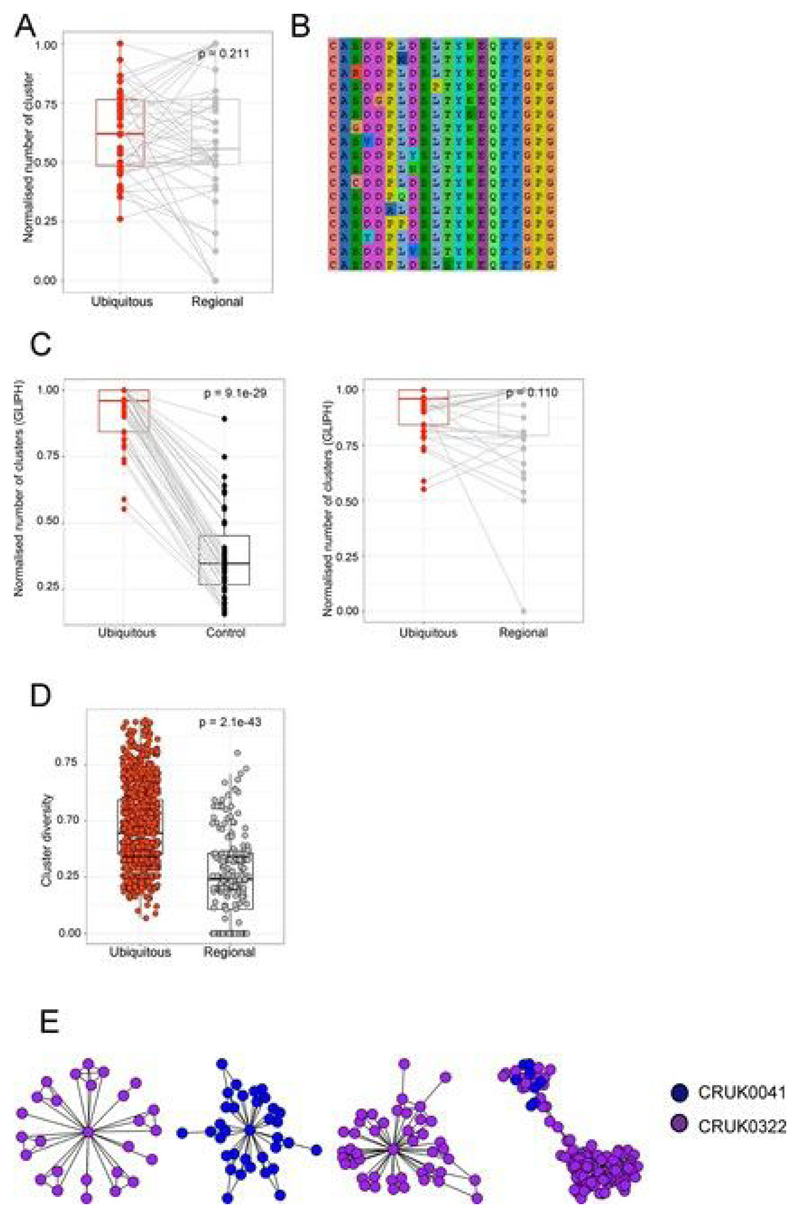
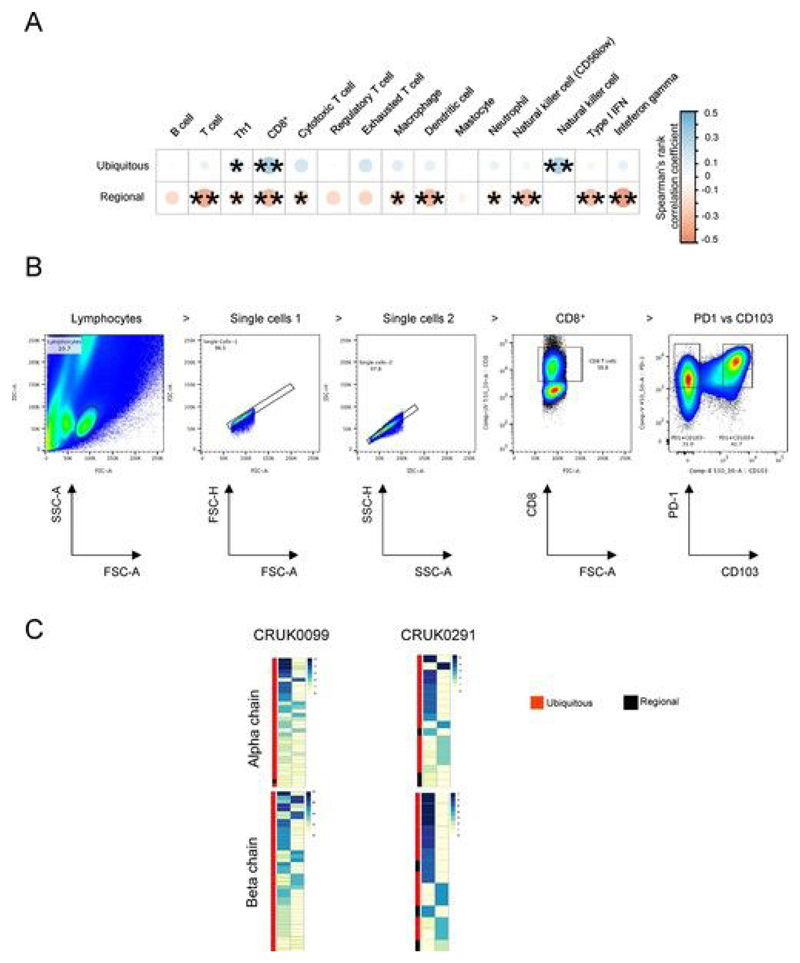
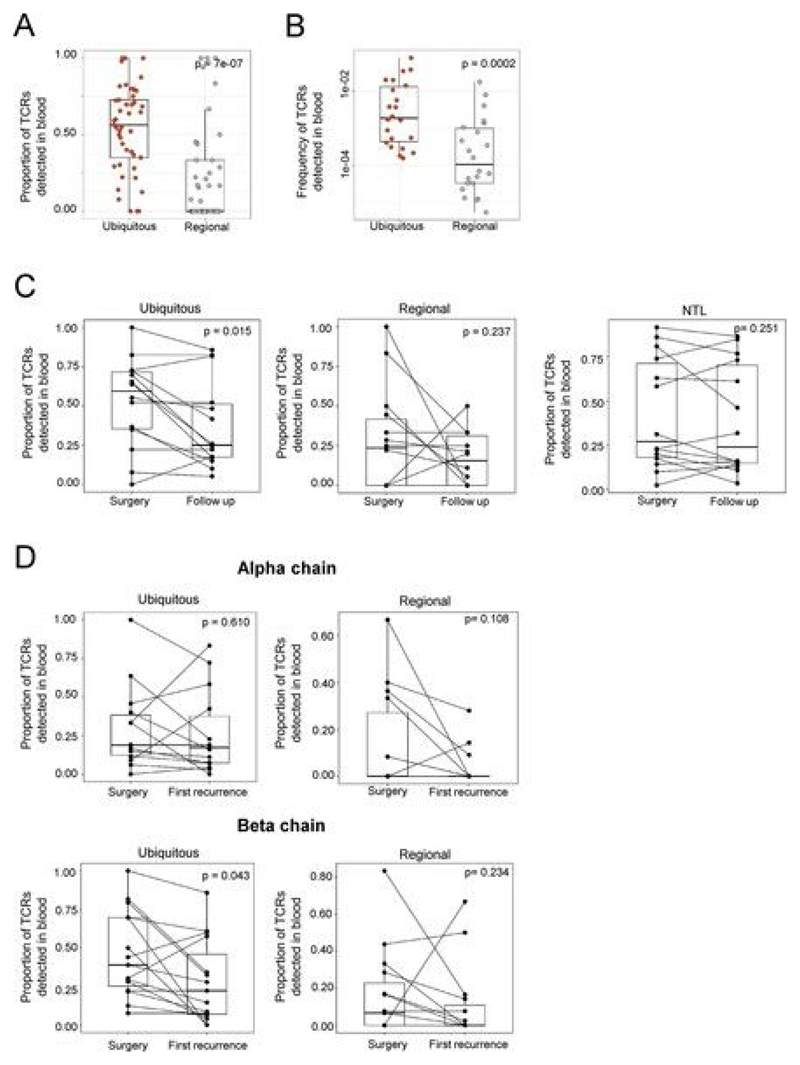
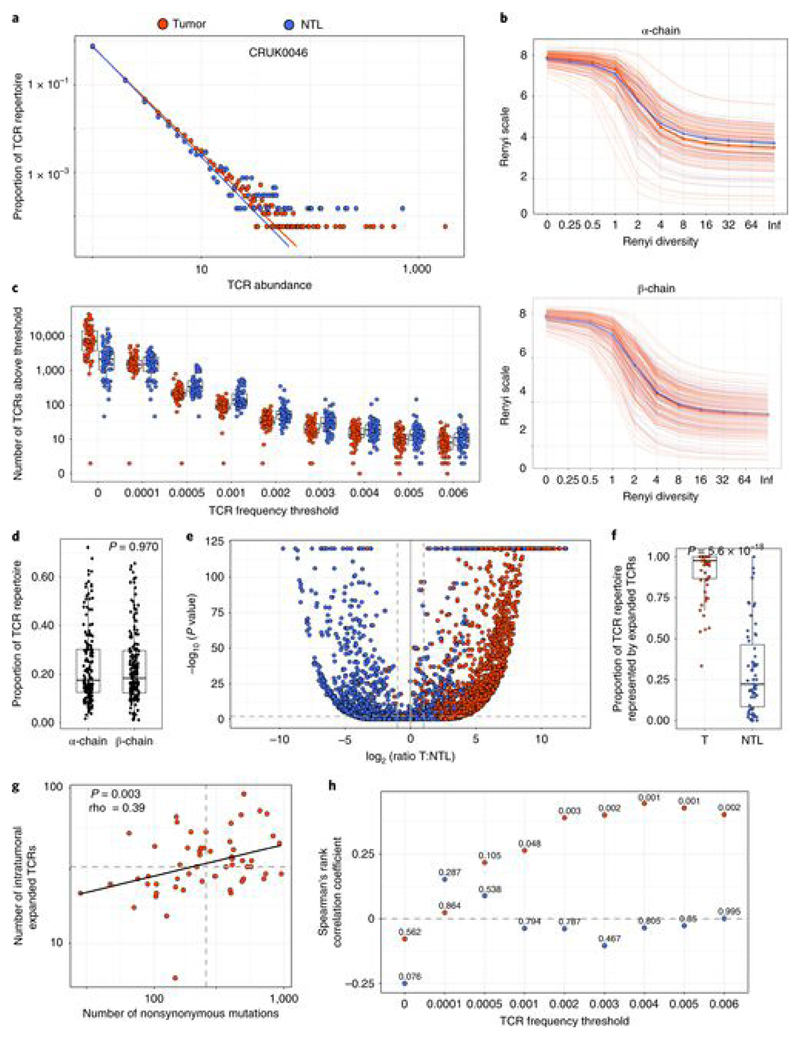
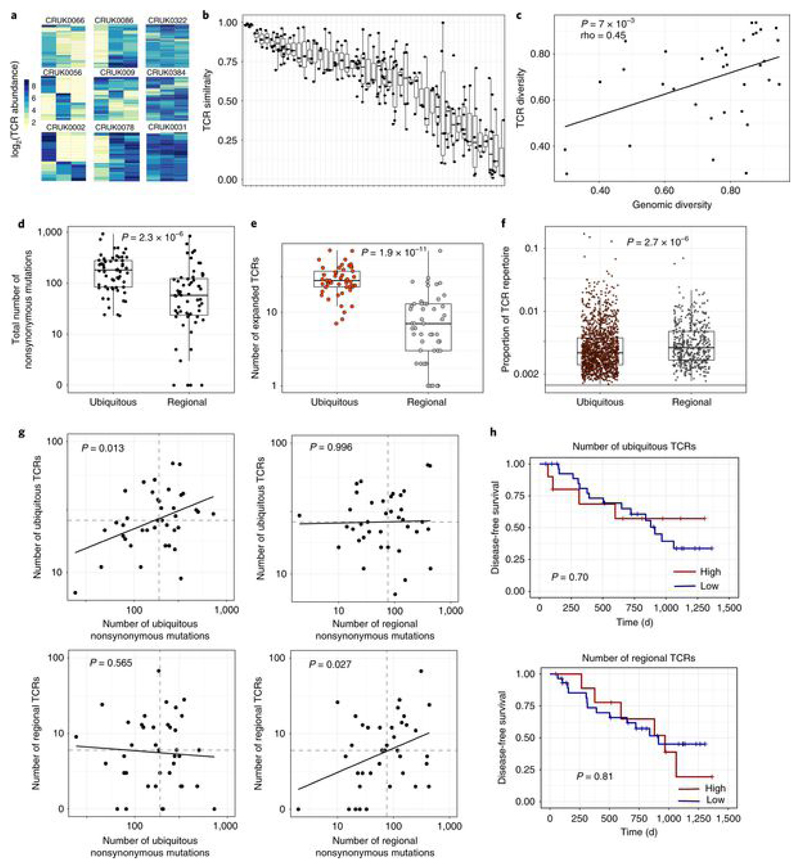
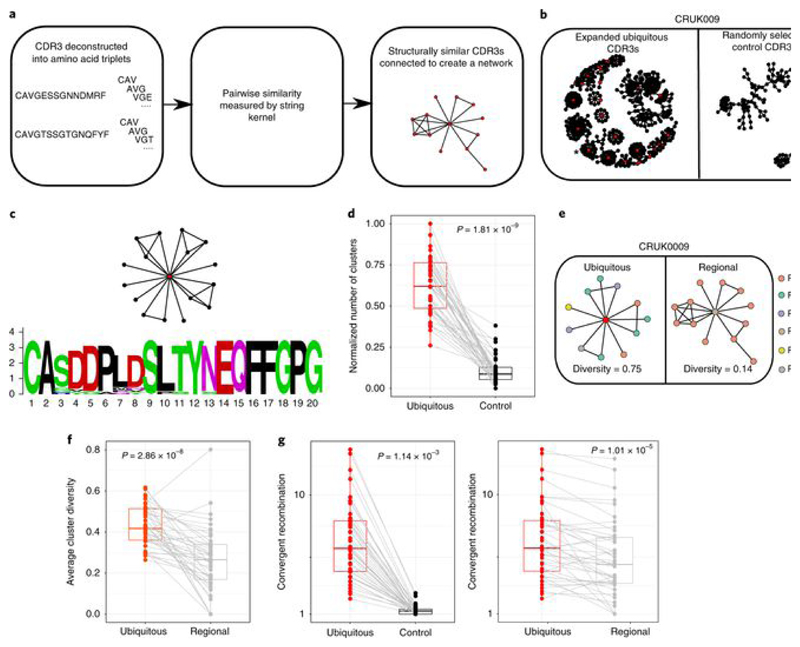
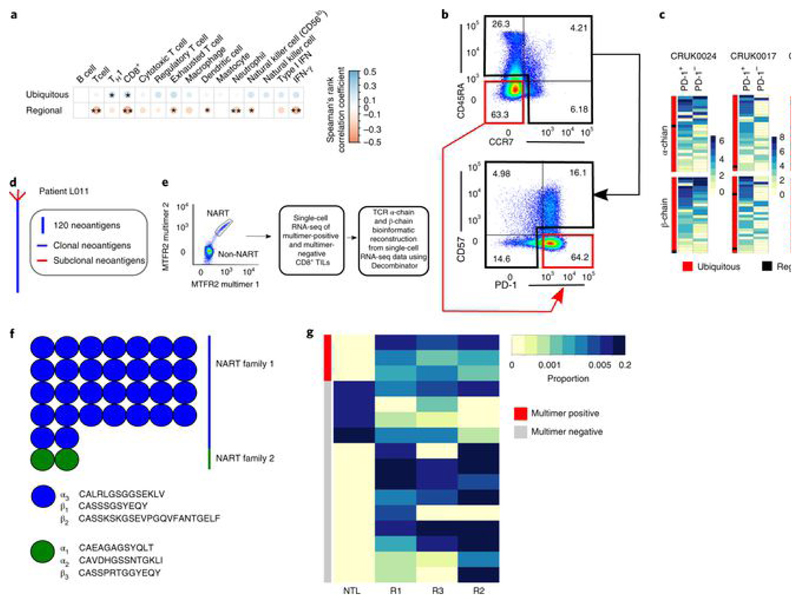
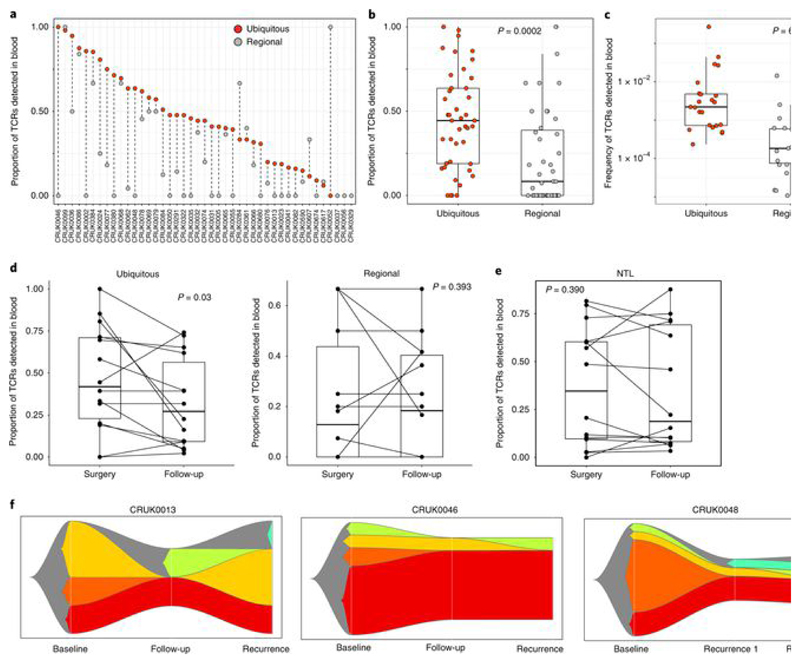
Somatic mutations together with immunoediting drive extensive heterogeneity within non-small-cell lung cancer (NSCLC). Herein we examine heterogeneity of the T cell antigen receptor (TCR) repertoire. The number of TCR sequences selectively expanded in tumors varies within and between tumors and correlates with the number of nonsynonymous mutations. Expanded TCRs can be subdivided into TCRs found in all tumor regions (ubiquitous) and those present in a subset of regions (regional). The number of ubiquitous and regional TCRs correlates with the number of ubiquitous and regional nonsynonymous mutations, respectively. Expanded TCRs form part of clusters of TCRs of similar sequence, suggestive of a spatially constrained antigen-driven process. CD8+ tumor-infiltrating lymphocytes harboring ubiquitous TCRs display a dysfunctional tissue-resident phenotype. Ubiquitous TCRs are preferentially detected in the blood at the time of tumor resection as compared to routine follow-up. These findings highlight a noninvasive method to identify and track relevant tumor-reactive TCRs for use in adoptive T cell immunotherapy.


Conflict of interest statement

Competing interests C.S. receives grant support from Pfizer, AstraZeneca, BMS and Ventana and has consulted for Boehringer Ingelheim, Eli Lilly, Servier, Novartis, Roche-Genentech, GlaxoSmithKline, Pfizer, BMS, Celgene, AstraZeneca, Illumina and the Sarah Cannon Research Institute. C.S. is a shareholder of Apogen Biotechnologies, Epic Bioscience and GRAIL and has stock options in and is co-founder of Achilles Therapeutics. S.A.Q. is a co-founder of Achilles Therapeutics. R.R., N.M. and G.A.W. have stock options in and have consulted for Achilles Therapeutics. J.L.R. has consulted for Achilles Therapeutics.

Figures

Extended Data Fig. 1
Extended Data Fig. 1. Patient selection, mutational burden and clinical characteristics.
a, CONSORT diagram showing the selection of TRACERx patients for TCR sequencing. b, The total number of nonsynonymous mutations (clonal and subclonal) and patient clinical characteristics (histology, stage, smoking status and clinical outcome) for the TCR sequencing cohort are shown.
Extended Data Fig. 2
Extended Data Fig. 2. Tumor and nontumor regions contain a highly diverse polyclonal TCR repertoire.
a–c, Graphs depicting the total number of TCR α-chain and β-chain segments sequenced (left), the number of unique TCR sequences detected (middle) and the correlation between the total number of TCR α-chain and β-chain segments sequenced (right) in multiregion tumors (n = 220) (a), nontumor lung (n = 64) (b) and PBMCs (n = 56) (c). Spearman’s rank correlation P values are shown. d, The relationship between the total number of TCRs in each region (expressed as log2) and the transcriptional score for a set of genes specifically expressed in T cells (see Methods). The Spearman’s rank correlation coefficient and P value are shown; n = 99.
Extended Data Fig. 3
Extended Data Fig. 3. NSCLC tumors contain expanded TCR β-chain sequences that are differentially expressed in tumor as compared to nontumor lung and whose numbers correlate with tumor mutational burden.
a, The frequency distribution of TCR β-chain abundance was fitted to a power law (f=kα) with maximum likelihood. The figure shows a representative plot (patient CRUK0046) for β-chain sequences from pooled tumor regions (red circles) and the matched nontumor lung sample (blue circles). The average power law parameter α, which corresponds to the slope on a log–log plot, was 2.5 ± 0.05 for tumor and 2.6 ± 0.03 for nontumor. The x axis refers to TCR abundance (size of clone), and the y axis refers to the proportion of the repertoire. b, The number of β-chain sequences detected above a given frequency threshold is shown for tumor (n = 72, multiple tumor regions were pooled from an individual patient; red circles) and matched nontumor lung samples (n = 64; blue circles). c, A volcano plot showing the likelihood (−log10 (P value)) of a β-chain sequence being sampled from two populations of equal mean in tumor and nontumor lung, plotted against the differential expression in tumor versus nontumor lung. If the log likelihood was >120, it was given a value of 120 for plotting purposes. Blue circles represent β-chain sequences expanded (>0.002) in nontumor lung; red circles represent β-chain sequences expanded in tumor lung. d, The proportion of expanded tumor α-chain sequences (T) or expanded nontumor lung β-chain sequences (NTL) that are specific to their respective tissue; this is defined on the volcano plot as TCRs that have a P value <0.01 and a differential abundance of at least two between the tissues. The two proportions are significantly different, with the Mann–Whitney P value shown; n(tumor) = 72; n(nontumor lung) = 64. e, The correlation between the number of unique intratumoral expanded β-chain sequences (frequency ≥2/1,000) and the number of nonsynonymous mutations is shown for all patients. The Spearman’s rank correlation and P value are shown (n = 62). f, The Spearman’s rank correlation coefficient and P value (shown above each point; n = 62) are shown for the relationship between the number of unique intratumoral expanded β-chain sequences at different frequencies (ranging from all TCRs (threshold of zero) up to those found at frequency ≥ 8/1,000) and the number of nonsynonymous mutations.
Extended Data Fig. 4
Extended Data Fig. 4. The heterogeneity of TCR repertoires across different regions of tumors differs between patients and correlates with genomic heterogeneity.
a, The heat maps show the abundance (log2 of the number of times each TCR is found) of expanded intratumoral β-chain sequences (frequency ≥ 2/l,000) in different tumor regions for several patients. Patient ID is shown above each heat map. Each row represents one unique sequence. Each column represents one tumor region. b, The TCR repertoire of multiple regions of a patient’s tumor were sequenced and a pairwise comparison of the repertoires of different regions of the same tumor was performed by using the cosine similarity (see Methods). The pairwise intratumoral TCR repertoire similarity (β-chain sequences) is shown for each patient. Each circle represents a comparison between two regions of the same patient’s tumor. Patients are ordered by descending rank of mean intratumoral TCR similarity. c, TCR repertoire (β-chain sequences) diversity plotted against genomic diversity for each patient. The diversity measurement is calculated as the normalized Shannon entropy as described in the Methods. The Spearman’s rank correlation and P value are shown; n = 41. d,e, TCR repertoire for α-chain (d) and β-chain (e) sequence pairwise similarity plotted against genomic similarity for each pair of tumor regions (within patient comparison). The TCR and mutational pairwise similarities are both measured as cosine similarity, as described in the Methods. The Spearman’s rank correlation and P value are shown; n = 226. Dashed lines represent median values.
Extended Data Fig. 5
Extended Data Fig. 5. Mutation prevalence defines ubiquitous and regional mutations in NSCLC.
a, The frequency histogram of corrected mutation prevalence for all mutations in the TRACERx patient cohort analyzed in this paper. Mutation prevalence (number of mutant reads/number of wild-type reads) was corrected for tumor purity and local genomic copy number as described in the Methods. The distribution is bimodal, with peaks at zero (0–10%, very few mutant reads) and 1 (corresponding to every cell in a tumor region carrying the mutation on one chromosome). b, The number of ubiquitous mutations defined as described in the Methods is plotted against the number of clonal mutations, calculated as described in Jamal-Hanjani et al.[39] for all patients analyzed in this study. c, The number of regional mutations defined as described in the Methods is plotted against the number of subclonal mutations, calculated as described in Jamal-Hanjani et al.[39].
Extended Data Fig. 6
Extended Data Fig. 6. The number of ubiquitous and regional TCRs correlates with the number of ubiquitous and regional nonsynonymous mutations, respectively.
a, The numbers of expanded (frequency ≥ 2/l,000) ubiquitous (red circles) and regional TCR (β-chain) sequences (gray circles) is shown for each tumor region. The number of ubiquitous mutations is greater than the number of regional mutations, with the Mann–Whitney P value shown; n = 52. b, The frequency distribution of the intratumoral expanded β-chain ubiquitous (red circles) and regional (gray circles) TCRs is shown. The two distributions were not significantly different when compared by the Kolmogorov–Smirnov test, P = 0.78. c, The number of expanded ubiquitous (top) or regional (bottom) β-chain sequences is plotted against the number of ubiquitous or regional nonsynonymous mutations for each tumor region. The Spearman's rank correlation coefficient and associated P value are shown; the dashed lines indicate median values. n = 42. d, Patients were stratified according to the number of ubiquitous mutations. The red line indicates a ratio above the top quartile and the blue line indicates a ratio below the top quartile. The Kaplan–Meier statistical P value is shown.
Extended Data Fig. 7
Extended Data Fig. 7. Expanded intratumoral ubiquitous TCRs are associated with a TH1 and CD8+ T cell transcriptional signature in the tumor and have a phenotype consistent with tumor antigen reactivity.
a, Correlation between the numbers of expanded intratumoral ubiquitous and regional TCR β-chain sequences and the transcriptional expression score (geometric mean) for various immune-related gene sets, characterizing cell types or functional states (names indicated above heat map). Details of how the transcriptional scores are calculated are in the Methods. The area and color of the circles correspond to the magnitude of the correlation coefficient. The color key indicates Spearman’s rank correlation coefficient. *P < 0.05; **P < 0.0l; after Bonferroni correction. b, CD8+ TILs from CRUK0291 and CRUK0099 were sorted into two populations, PD-1+CD103+ and PD-1+CD103 cells. The flow cytometry gating strategy for a representative patient is shown (pre-gated on live > singlets > CD3+ > CD8+ T cells). RNA was extracted and sequenced from sorted populations as described in the Methods. c, The RNA-seq data were mined for the presence of expanded ubiquitous and regional α-chain and β-chain sequences. The heat maps show the number of times each expanded ubiquitous or regional TCR CDR3 sequence was found in each of the RNA-seq data from PD-1+CD103+ or PD-1+CD103 cells, as a proportion of the number of times a constant region sequence of the same length was detected. These proportions are scaled for each row and color coded. Each row represents a distinct expanded TCR sequence.
Extended Data Fig. 8
Extended Data Fig. 8. Network diagram of clusters of intratumoral CDR3 β-chain sequences shown for all patient CDR3 repertoires.
All panels show the network of TCR CDR3 β-chain sequences that are connected to at least one other expanded intratumoral ubiquitous TCR (shown as red circles). Clusters are defined as networks with at least two nodes. Only those patients with at least one cluster are shown.
Extended Data Fig. 9
Extended Data Fig. 9. Further analysis of TCR clusters.
a, The clustering algorithm was run on all patients, and the number of distinct clusters containing expanded ubiquitous and regional TCRs are shown. The number is normalized for the munber of expanded TCRs of each type. The Mann–Whitney P value is shown; n =46. b, A full alignment of the cluster shown in Fig. 3b,c. c, The GLJPH (https://github.com/immunoengineer/gliph) clustering algorithm was run on all patients. The panels show the number of distinct GLIPH clusters containing expanded ubiquitous, expanded regional and randomly selected CDR3 β-chain sequences. The number is normalized for the number of TCRs of each type. The ubiquitous TCRs show greater clustering than randomly selected TCRs (left), with the Mann–Whitney P value shown; n = 46. There was no significant difference between GLIPH clustering of normalized ubiquitous and regional expanded TCRs (right), with the Mann–Whitney P value shown; n = 46. d, The cluster Shannon diversity (see Methods) for all clusters containing ubiquitous or regional expanded TCRs. The Mann–Whitney P value is shown; n = 46. e, As an additional control in the TCR clustering analysis, we took expanded ubiquitous TCRs from patients CRUK0041 and CRUK0322 and mixed them in silico, and we then looked to see whether the resulting clusters were primarily composed of TCRs from individual patients.We analyzed three pairs of patients in whom we observed prominent clustering in this way. One representative example is shown.
Extended Data Fig. 10
Extended Data Fig. 10. Dynamic occurrence of expanded intratumoral ubiquitous TCRs in blood.
a, The proportion of expanded intratumoral ubiquitous (red circles) and regional (gray circles) TCRs (β-chain) detected within the blood for all patients (the Mann–Whitney P value is shown; n = 45). b, The frequency (number of TCR sequences detected, as a proportion of the total number of TCRs) of expanded intratumoral ubiquitous (red circles) and regional (gray circles) TCRs (β-chain) in the peripheral blood at the time of primary NSCLC surgery (the Mann–Whitney P value is shown; n = 42 for ubiquitous, n = 22 for regional). c, The proportion of expanded intratumoral ubiquitous (left), expanded intratumoral regional (middle) and expanded nontumor lung (right) TCRs (β-chain) that were detected in the blood at the time of primary NSCLC surgery and at routine follow-up (the median time to follow-up was just under 2 years) (the Mann–Whitney P value is shown; n = 14 for ubiquitous, regional and nontumor lung). d, The proportion of expanded intratumoral ubiquitous (left) and regional (right) α-chain (top) and β-chain (bottom) sequences that were detected in the blood at the time of primary NSCLC surgery and at disease recurrence (the median time to first recurrence was 350 d) (the Mann–Whitney P value is shown; n = 14 for α-chains and n = 15 for β-chains).
Fig. 1
Fig. 1. NSCLC tumors contain expanded TCRs that are differentially expressed in tumor as compared to nontumor lung and whose numbers correlate with tumor mutational burden.
a, The frequency distribution of TCR α-chain abundance (TCR β-chains are shown in Extended Data Fig. 3a) was fitted to a discrete power law (f(k) = Ckα) by maximum likelihood. The Figure shows a representative plot (from patient CRUK0046) for TCR α-chain sequences in tumor (red circles) and matched nontumor lung (NTL; blue circles). The average power law parameter α was 2.43 ± 0.05 for tumor and 2.59 ± 0.05 for nontumor TCR α-chains. The parameters for the patient shown were 2.43 for tumor and 2.53 for nontumor lung. The distribution parameters fitted to tumor and to nontumor samples did not differ significantly: P = 0.16, two-sided Mann–Whitney test. The x axis represents TCR abundance (size of clone), and the y axis represents the proportion of the repertoire. b, The Rényi entropies of order 0 to infinity for the α-chain (top) and β-chain (bottom) TCR repertoires of tumor regions (multiple tumor regions were pooled from an individual patient; red) and nontumor lung samples (blue). Each repertoire was subsampled to 5,000 TCRs 100 times before calculating the Rényi entropy (see Methods). The Rényi index of order 1 corresponds to the Shannon diversity index. c, The number of α-chain sequences detected above a given frequency threshold is shown for tumor (n = 72 patients, with multiple tumor regions pooled from an individual patient; red circles) and matched nontumor lung (n = 64 patients; blue circles). The minimum and maximum are indicated by the extreme points of the box plot; the median is indicated by the thick horizontal line; and the first and third quartiles are indicated by box edges. d, The proportion of the total intratumoral TCR repertoire (total number of TCRs, with pooled tumor regions from each patient) accounted for by the expanded (frequency ≥ 2/1,000) α-chain and β-chain TCRs. The minimum and maximum are indicated by the extreme points of the box plot; the median is indicated by the thick horizontal line; and the first and third quartiles are indicated by box edges. The proportions for α-chain and β-chain sequences were not significantly different (two-sided Mann–Whitney test); n = 204 tumor regions from 49 patients for α-chains and 214 tumor regions from 52 patients for β-chains. e, A volcano plot showing the likelihood (–log10 (P value)) of a TCR being sampled from two populations of equal mean in tumor and nontumor lung, plotted against differential expression in tumor versus nontumor lung. If the log likelihood was >120, it was given a value of 120 for plotting purposes. Blue circles represent α-chain sequences expanded (>0.002) in nontumor lung (n = 3,197 TCRs from 59 patients) and red circles represent α-chain sequences expanded in tumor (n = 2,193 TCRs from 59 patients); the equivalent plot for TCR β-chain sequences is shown in Extended Data Fig. 3c. The horizontal dashed line corresponds to P = 0.01; the vertical dashed lines indicate a twofold differential in expression between the tissues. f, The proportion of expanded tumor or nontumor lung α-chain sequences that are specific to their respective tissue, defined on the volcano plot as TCRs that had P < 0.01 and a differential abundance of at least two between the tissues. The minimum and maximum are indicated by the extreme points of the box plot; the median is indicated by the thick horizontal line; and the first and third quartiles are indicated by box edges. The two proportions were significantly different, with the two-sided Mann–Whitney test P value shown; n = 59 patients (tumor) and n = 59 patients (nontumor lung). The equivalent plot for TCR β-chain sequences is shown in Extended Data Fig. 3d. g, The correlation between the number of nonsynonymous mutations and the number of unique intratumoral expanded α-chain sequences (frequency ≥ 2/1,000) for each patient. The Spearman’s rank correlation coefficient and P value are shown (n = 59 patients). The equivalent plot for β-chain sequences is shown in Extended Data Fig. 3e. h, The Spearman’s rank correlation coefficient and P value (shown above each point; n = 59 patients) for the relationship between the number of nonsynonymous mutations and the number of unique intratumoral (red circles) or nontumor lung (blue circles) expanded α-chain sequences at different frequencies (ranging from all TCRs (threshold of zero) up to those found at a frequency of ≥ 8/1,000). The equivalent plot for β-chain sequences is shown in Extended Data Fig. 3f.
Fig. 2
Fig. 2. NSCLC tumors contain expanded ubiquitous and regional TCRs, which reflect the tumor mutational landscape.
a, Heat maps showing the abundance (log2 of the number of times each TCR was found) of expanded intratumoral α-chain sequences (frequency ≥ 2/1,000) in different tumor regions for several patients. Patient ID is shown above each heat map. Each row represents one unique sequence, and each column represents one tumor region. Equivalent plots for β-chain sequences are shown in Extended Data Fig. 4a. b, The TCR repertoires of multiple regions from a patient’s tumor were sequenced and a pairwise comparison of the repertoires of different regions from the same tumor was performed by using the cosine similarity (see Methods). The pairwise intratumoral TCR repertoire similarity (α-chain sequences; the equivalent plot for β-chain sequences is in Extended Data Fig. 4b) is shown for each patient. Each circle represents a comparison between two regions from the same patient’s tumor (n = 226 total comparisons from 49 patients). For all box plots, the minimum and maximum are indicated by the extreme points of the box plot; the median is indicated by the thick horizontal line; and the first and third quartiles are indicated by box edges. Patients are ordered along the x axis by descending mean intratumoral TCR similarity. c, TCR repertoire (α-chain sequences) diversity plotted against genomic diversity for each patient. The diversity measurement was calculated as the normalized Shannon entropy (see Methods). The Spearman’s rank correlation coefficient and P value are shown; n = 38 patients. The equivalent plot for β-chain sequences is shown in Extended Data Fig. 4c. d, The numbers of ubiquitous and regional nonsynonymous mutations for each tumor region. The minimum and maximum are indicated by the extreme points of the box plot; the median is indicated by the thick horizontal line; and the first and third quartiles are indicated by box edges. The number of ubiquitous mutations is greater than the number of regional mutations, with the two-sided Mann–Whitney test P value shown; n = 60 patients. e, The numbers of expanded (frequency ≥ 2/1,000) ubiquitous (red circles) and regional (gray circles) α-chain sequences for each tumor region. The minimum and maximum are indicated by the extreme points of the box plot; the median is indicated by the thick horizontal line; and the first and third quartiles are indicated by box edges. The number of ubiquitous TCRs is greater than the number of regional TCRs, with the two-sided Mann–Whitney test P value shown; n = 49 patients. The equivalent plot for β-chain sequences is shown in Extended Data Fig. 6a. f, The frequency distribution of the intratumoral expanded α-chain ubiquitous (red circles; n = 1,379 individual TCRs combined from 49 patients) and regional (gray circles; n = 446 individual TCRs from 44 patients) TCRs. The minimum and maximum are indicated by the extreme points of the box plot; the median is indicated by the thick horizontal line; and the first and third quartiles are indicated by box edges. Expanded regional TCRs are expressed at a higher abundance than ubiquitous TCRs when compared by two-sided Mann–Whitney test (P = 2.7 × 10⁻⁶). The equivalent plot for β-chain sequences is shown in Extended Data Fig. 6b. g, The number of expanded ubiquitous (top) or regional (bottom) α-chain sequences plotted against the number of ubiquitous (left) or regional (right) nonsynonymous mutations for each tumor region. The Spearman’s rank correlation and associated P value are shown; dashed lines correspond to median values. n = 39 patients. The equivalent plot for β-chain sequences is shown in Extended Data Fig. 6c. h, Patients were stratified according to the number of expanded intratumoral ubiquitous α-chain sequences (top) or the number of expanded intratumoral regional α-chain sequences (bottom). n = 39 patients. The red line indicates a ratio above the median, and the blue line indicates a ratio below the median. Kaplan–Meier P values are shown.
Fig. 3
Fig. 3. Expanded intratumoral TCR CDR3 sequences identify clusters of related TCRs and show enhanced convergent recombination.
a, Diagram illustrating the CDR3 similarity network construction process. Individual CDR3s are deconstructed into overlapping series of contiguous amino acid triplets, and the pairwise similarity between two CDR3s is calculated as the normalized string (triplet) kernel. CDR3s that have a pairwise similarity of >0.82 are connected by an edge. b, Representative network diagrams of intratumoral CDR3 β-chain sequences for patient CRUK0009. Both panels show the network of TCR CDR3 β-chain sequences that are connected to at least one other TCR within the tumor. Left, clustering around expanded intratumoral ubiquitous TCRs (red circles). An asterisk indicates a cluster whose CDR3 sequences are analyzed in c. Right, clustering around a random sample of TCRs from the same repertoire (same numbers as for the expanded ubiquitous TCRs). c, A representative example of alignment of CDR3 sequences from a single cluster (full alignment in Extended Data Fig. 8b). The alignment ts shown as a sequence logo (https://weblogo.berkeley.edu/logo.cgi). d, The clustering algorithm was run on all patients, and the number of clusters for the networks containing expanded ubiquitous and control randomly selected β-chain sequences is shown. The minimum and maximum are indicated by the extreme points of the box plot; the median is indicated by the thick horizontal line; and the first and third quartiles are indicated by box edges. The expanded TCRs exhibit greater clustering, with the one-sided Mann–Whitney test P value shown; n = 46 patients. e, Representative clustering around a ubiquitous or regional expanded TCR from CRUK0009, with nodes colored according to the regions in which each TCR was found. f, The average cluster Shannon diversity (see Methods) for clusters containing ubiquitous or regional expanded TCRs. The one-sided Mann–Whitney test P value is shown; n = 42 patients. The minimum and maximum are indicated by the extreme points of the box plot; the median is indicated by the thick horizontal line; and the first and third quartiles are indicated by box edges. g, The amount of convergent recombination was calculated as the average number of distinct DNA TCR sequences that contributed to each observed TCR CDR3 amino acid sequence for each expanded ubiquitous TCR, as compared to a randomly selected set of TCRs (left) or regional TCRs (right) from each patient intratumoral repertoire. One-sided Mann–Whitney P values are shown; n = 43 patients.The minimum and maximum are indicated by the extreme points of the box plot; the median is indicated by the thick horizontal line; and the first and third quartiles are indicated by box edges. All panels in this figure refer to TCR β-chain sequences, as these showed more diversity and a lower background rate of clustering.
Fig. 4
Fig. 4. Expanded intratumoral ubiquitous TCRs are associated with a TH1 and CD8+ T cell transcriptional signature in the tumor and have a phenotype consistent with tumor antigen reactivity.
a, Correlation between the numbers of expanded intratumoral ubiquitous and regional α-chain TCR sequences and the transcriptional expression score (geometric mean) for various immune-related gene sets, characterizing cell types or functional states (names appear above the heat map). Details of how the transcriptional scores are calculated are in the Methods. The area and color of the circles correspond to the magnitude of the Spearman’s rank correlation coefficient. *P < 0.05; **P < 0.01; after Bonferroni correction. n = 78 tumor regions. b, CD8+ TILs from CRUK0024, CRUK0017 and CRUK0069 were sorted into two populations: CD45RACCR7PD-1+CD57 and all other CD8+ TILs (referred to as PD-1+ and PD-1 subpopulations, respectively). The flow cytometry gating strategy for a representative patient is shown (pre-gated on live > singlets > CD3+ > CD8+ T cells). c, RNA from sorted populations was extracted and sequenced, and the RNA-seq data were mined for the presence of expanded ubiquitous and regional α-chain and β-chain sequences. The heat maps show the number of times each expanded ubiquitous or regional TCR CDR3 sequence was found in the RNA-seq data from PD-1+ or PD-1 cells, as a proportion of the number of times a constant region sequence of the same length was detected. The color key gives the proportions scaled for each row, where each row represents a distinct expanded TCR sequence. d, CD8+ T cells reactive to a clonal neoantigen were isolated from a patient with a high clonal nonsynonymous mutational load (patient L011). Phylogenetic tree of tumor adapted from ref. [3]. e, Representative dot plot of the TIL peptide:multimer sorting strategy (left) and the workflow for single-cell RNA-seq (right). CD8+ TILs were screened for neoantigen-reactive T cells (NARTs) reactive to a peptide arising from the mutated MTFR2 gene and sorted for single-cell RNA-seq (pre-gated on lymphocyte > single cell > viable > CD3+CD8+ T cells). f, TCR α-chain and β-chain sequences were bioinformatically reconstructed from the single cells with Decombinator (see Methods). The neoantigen-reactive T cells comprised two families of cells with distinct CDR3 sequences and abundances. g, Heat map showing the abundance of antigen-specific β-chain sequences in tumor regions (Rl–R3) and nontumor lung from multimer-positive (red) and multimer-negative (gray) cells within the bulk TCR sequencing data. Each row represents a unique TCR found in the multimer-positive or multimer-negative single cells.
Fig. 5
Fig. 5. Expanded intratumoral TCR sequences can be identified in matched blood samples at the time of primary tumor resection and can persist in the blood long term.
a, The proportion of expanded intratumoral ubiquitous and regional TCRs (α-chain) detected in peripheral blood from the same patient at the time of primary NSCLC surgery, with patients ordered by descending proportion. The proportions were obtained by dividing the number of TCRs found in the blood by the total number of TCRs for each category. We thus ensured that the difference observed was not due to the size of the input. b, Summary of the proportion of expanded intratumoral ubiquitous (red circles) and expanded intratumoral regional (gray circles) TCRs (α-chain) detected within the blood for all patients (the one-sided Mann–Whitney test P value is shown; n = 43 individual patients). The minimum and maximum are indicated by the extreme points of the box plot; the median is indicated by the thick horizontal line; and the first and third quartiles are indicated by box edges. The equivalent plot for β-chain sequences is shown in Extended Data Fig. 10a. c, The frequency (number of TCR sequences detected, as a proportion of the total number of TCRs) of expanded intratumoral ubiquitous (red circles) and regional (gray circles) TCRs (α-chain) in the peripheral blood at the time of NSCLC surgery (the one-sided Mann–Whitney test P value is shown; n = 23 individual patients). Only TCRs actually detected in blood were used for this analysis. The minimum and maximum are indicated by the extreme points of the box plot; the median is indicated by the thick horizontal line; and the first and third quartiles are indicated by box edges. The equivalent plot for β-chains is shown in Extended Data Fig. 10b. d, The proportion of expanded intratumoral ubiquitous (left) and regional (right) TCRs (α-chain) that were detected in the blood at the time of primary NSCLC surgery and at routine follow-up (median time to follow-up was just under 2 years; one-sided Mann–Whitney test P values are shown; n = 14 individual patients for ubiquitous and regional TCRs). The minimum and maximum are indicated by the extreme points of the box plot; the median is indicated by the thick horizontal line; and the first and third quartiles are indicated by box edges. The equivalent plot for β-chains is shown in Extended Data Fig. 10c. e, The proportion of expanded nontumor lung TCRs (α-chain) that were detected in the blood at the time of primary NSCLC surgery and at routine follow-up (the one-sided Mann–Whitney test P value is shown; n = 14 individual patients). The minimum and maximum are indicated by the extreme points of the box plot; the median is indicated by the thick horizontal line; and the first and third quartiles are indicated by box edges. The equivalent plot for β-chain sequences is shown in Extended Data Fig. 10c. f, The relative proportion of expanded intratumoral ubiquitous TCRs (α-chain) with different patterns of occurrence in peripheral blood taken at three longitudinal time points for patients CRUK0013 (left), CRUK0046 (middle) and CRUK0048 (right). Expanded intratumoral ubiquitous TCRs found at all three time points are shown in red. TCRs found in baseline blood only are shown in orange.

Comment in

References

    1. Anagnostou V, et al. Evolution of neoantigen landscape during immune checkpoint blockade in non-small cell lung cancer. Cancer Discov. 2017;7:264–276. - PMC - PubMed
    1. Rosenthal R, et al. Neoantigen-directed immune escape in lung cancer evolution. Nature. 2019;567:479–485. - PMC - PubMed
    1. McGranahan N, et al. Clonal neoantigens elicit T cell immunoreactivity and sensitivity to immune checkpoint blockade. Science. 2016;351:1463–1469. - PMC - PubMed
    1. Miao D, et al. Genomic correlates of response to immune checkpoint blockade in microsatellite-stable solid tumors. Nat Genet. 2018;50:1271–1281. - PMC - PubMed
    1. Jamal-Hanjani M, et al. Tracking genomic cancer evolution for precision medicine: the lung TRACERx study. PLoS Biol. 2014;12:e1001906. - PMC - PubMed

Publication types

MeSH terms

Substances