. 2020 Mar 1;36(5):1492-1500.
doi: 10.1093/bioinformatics/btz744.

Soft windowing application to improve analysis of high-throughput phenotyping data

Hamed Haselimashhadi  1 Jeremy C Mason  1 Violeta Munoz-Fuentes  1 Federico López-Gómez  1 Kolawole Babalola  1 Elif F Acar  2   3   4 Vivek Kumar  5 Jacqui White  5 Ann M Flenniken  2   6 Ruairidh King  7 Ewan Straiton  7 John Richard Seavitt  8 Angelina Gaspero  8 Arturo Garza  8 Audrey E Christianson  8 Chih-Wei Hsu  8 Corey L Reynolds  8 Denise G Lanza  8 Isabel Lorenzo  8 Jennie R Green  8 Juan J Gallegos  8 Ritu Bohat  8 Rodney C Samaco  8 Surabi Veeraragavan  8 Jong Kyoung Kim  9 Gregor Miller  10 Helmult Fuchs  10 Lillian Garrett  10 Lore Becker  10 Yeon Kyung Kang  11 David Clary  12 Soo Young Cho  13 Masaru Tamura  14 Nobuhiko Tanaka  14 Kyung Dong Soo  15 Alexandr Bezginov  2   3 Ghina Bou About  16 Marie-France Champy  16 Laurent Vasseur  16 Sophie Leblanc  16 Hamid Meziane  16 Mohammed Selloum  16 Patrick T Reilly  16 Nadine Spielmann  10 Holger Maier  10 Valerie Gailus-Durner  10 Tania Sorg  16 Masuya Hiroshi  14 Obata Yuichi  14 Jason D Heaney  8 Mary E Dickinson  8 Wurst Wolfgang  17 Glauco P Tocchini-Valentini  18 Kevin C Kent Lloyd  12 Colin McKerlie  2   3 Je Kyung Seong  15 Herault Yann  19 Martin Hrabé de Angelis  10 Steve D M Brown  7 Damian Smedley  20 Paul Flicek  1 Ann-Marie Mallon  7 Helen Parkinson  1 Terrence F Meehan  1
Affiliations

Soft windowing application to improve analysis of high-throughput phenotyping data

Hamed Haselimashhadi et al. Bioinformatics. .

Abstract

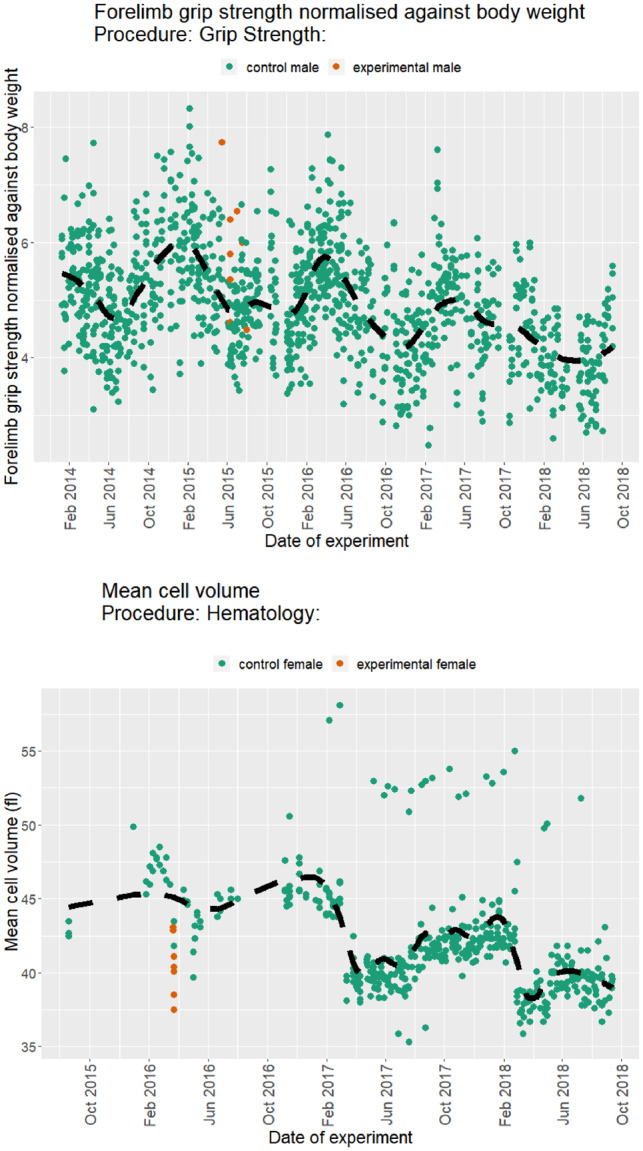
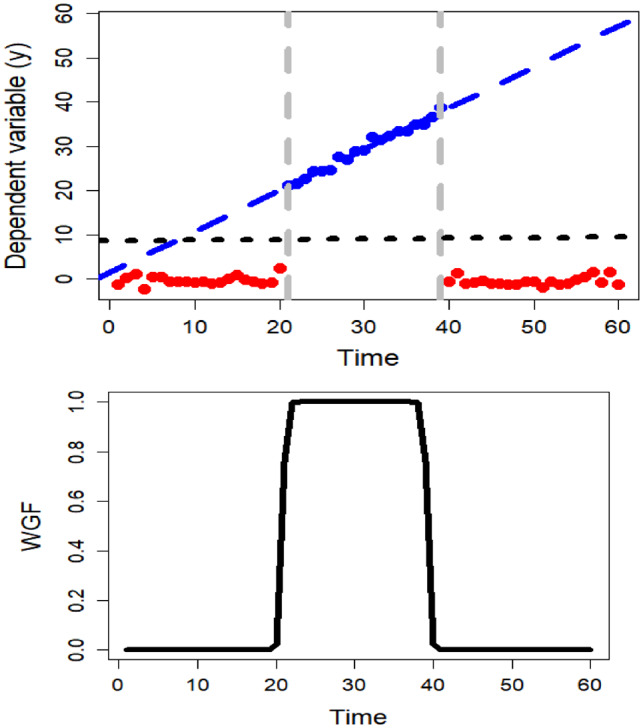
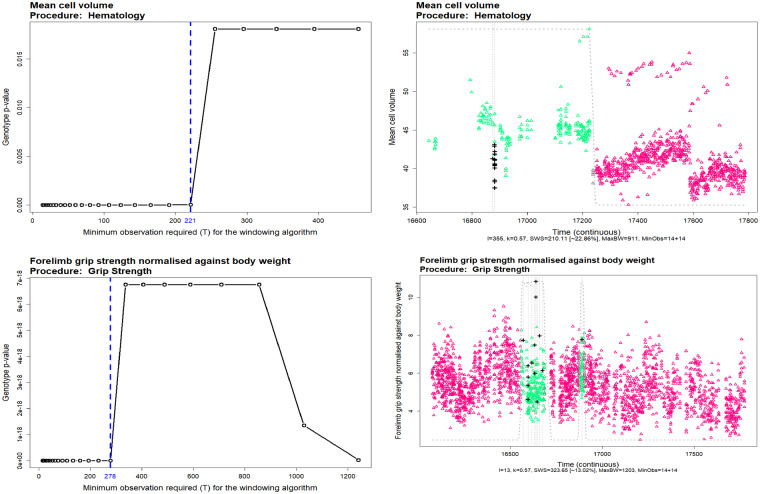
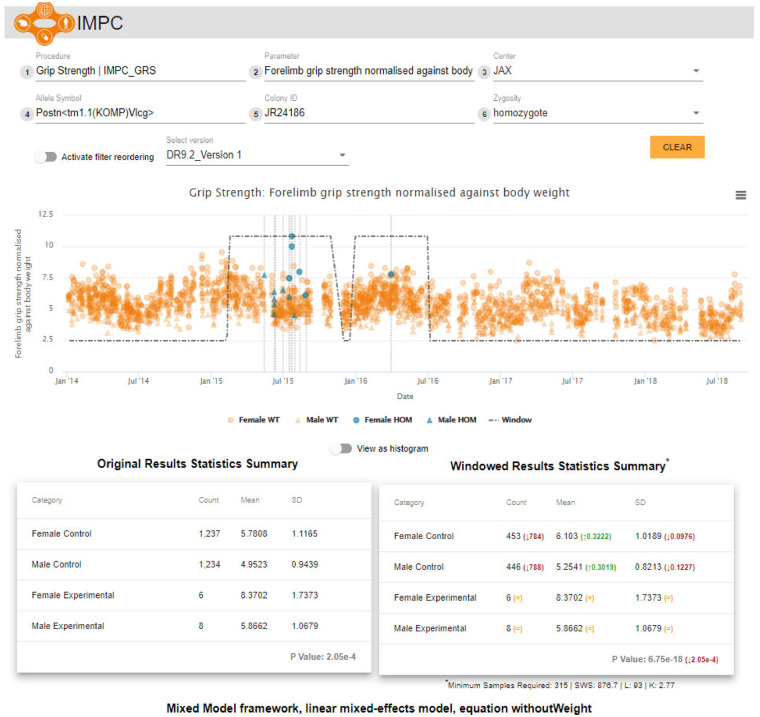
Motivation: High-throughput phenomic projects generate complex data from small treatment and large control groups that increase the power of the analyses but introduce variation over time. A method is needed to utlize a set of temporally local controls that maximizes analytic power while minimizing noise from unspecified environmental factors.

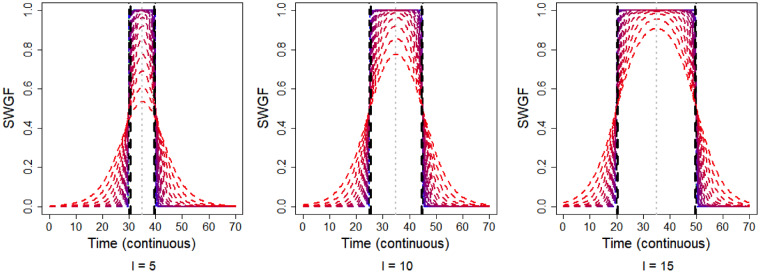
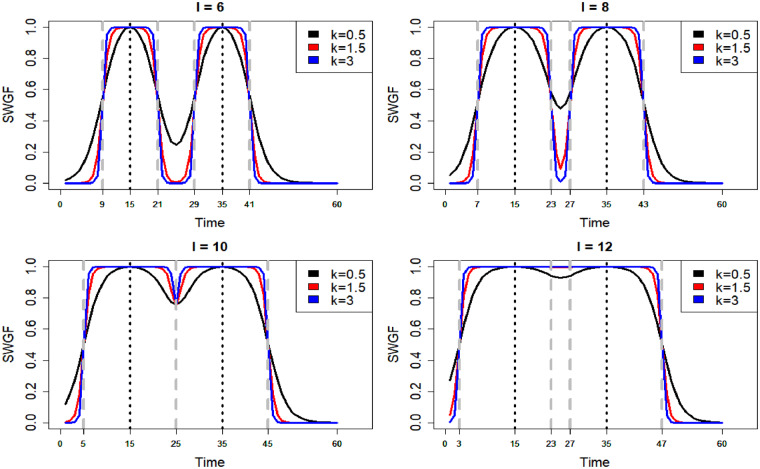
Results: Here we introduce 'soft windowing', a methodological approach that selects a window of time that includes the most appropriate controls for analysis. Using phenotype data from the International Mouse Phenotyping Consortium (IMPC), adaptive windows were applied such that control data collected proximally to mutants were assigned the maximal weight, while data collected earlier or later had less weight. We applied this method to IMPC data and compared the results with those obtained from a standard non-windowed approach. Validation was performed using a resampling approach in which we demonstrate a 10% reduction of false positives from 2.5 million analyses. We applied the method to our production analysis pipeline that establishes genotype-phenotype associations by comparing mutant versus control data. We report an increase of 30% in significant P-values, as well as linkage to 106 versus 99 disease models via phenotype overlap with the soft-windowed and non-windowed approaches, respectively, from a set of 2082 mutant mouse lines. Our method is generalizable and can benefit large-scale human phenomic projects such as the UK Biobank and the All of Us resources.

Availability and implementation: The method is freely available in the R package SmoothWin, available on CRAN http://CRAN.R-project.org/package=SmoothWin.

Supplementary information: Supplementary data are available at Bioinformatics online.


Figures

Fig. 1.
Fig. 1.
Examples of longitudinal data from the IMPC selected for high variance in control population. Scatter plot of the Forelimb grip strength normalized against body weight (top) and mean cell volume (bottom) from the IMPC Grip Strength and Haematology procedures, respectively. The dashed black lines represent the overall trend of the controls (dark green). Mutant mice are in orange
Fig. 2.
Fig. 2.
Behaviour of the symmetric weight generating function (SWGF) for a spectrum of values for the shape parameter, k, ranging from k=50 (blue) to k=0.2 (red), in intervals of t=1, 2,, 70, and for the different values of the bandwith l=5, 10, 15 (left to right). The black dashed lines show the hard windows corresponding to l. The grey dotted vertical lines show the window peaks. These plots show the capability of the WGF to generate different forms of the window
Fig. 3.
Fig. 3.
Merging behaviour of the SWGF for different values of the shape parameter k=0.5, 1.5, 3 and the bandwidth l=6, 8, 10, 12 on a sequence of time points t=1, 2,, 60. The vertical dashed grey lines show the corresponding hard windows to l. This plot shows the capability of SWGF to generate multimodal windows as well as merging individual windows
Fig. 4.
Fig. 4.
(Left) Comparison between the inferences from the windowed linear regression on the simulated data (blue dashed line) and without windowing (dotted black line). (Right) The corresponding weights from WGF centred on m=30. With windowing, we attempt to model the effective section of the data (blue dots)
Fig. 5.
Fig. 5.
The sensitivity analysis of the soft windowing approach to the minimum observation required in the window. The left plots show the variation of the final Genotype P-values with different values of T. The vertical dashed blue lines show the maximum toleration of the algorithm before including too much noise in the final fittings. The right plots show the optimal soft-windowed linear mixed model fitted to the data. The controls (triangles) weight are colour coded from green (inside the windows) to grey (on the window borders) and purple (outside the window). The mutants are shown with the black plus (+) on the plots
Fig 6.
Fig 6.
The soft windowing visualization in the IMPC website for the Forelimb grip strength normalized against body weight from the IMPC Grip Strength procedure. The plot shows the response over time as well as the fitted soft windows. The tables underneath show the comparison between the descriptive statistics obtained from the standard (non-windowed) analysis on the left and the soft-windowed approach on the right. The P-values correspond to the genotype effect after applying the statistical analyses taking the corresponding controls based on the non-window and soft-windowed approaches, respectively

References

    1. Akawi N. et al. (2015) Discovery of four recessive developmental disorders using probabilistic genotype and phenotype matching among 4,125 families. Nat. Genet., 47, 1363–1369. - PMC - PubMed
    1. Al-Tamimi N. et al. (2016) Salinity tolerance loci revealed in rice using high-throughput non-invasive phenotyping. Nat. Commun., 7, 13342. - PMC - PubMed
    1. Begley C.G., Ellis L.M. (2012) Drug development: raise standards for preclinical cancer research. Nature, 483, 531–533. - PubMed
    1. Blake J.A. et al. (2017) Mouse genome database (MGD)-2017: community knowledge resource for the laboratory mouse. Nucleic Acids Res., 45, D723–D729. - PMC - PubMed
    1. Bradley A. et al. (2012) The mammalian gene function resource: the International Knockout Mouse Consortium. Mamm. Genome, 23, 580–586. - PMC - PubMed

Publication types