Fluid responsiveness in the pediatric population
- PMID: 31591858
- PMCID: PMC6781210
- DOI: 10.4097/kja.19305
Fluid responsiveness in the pediatric population
Erratum in
-
Corrigendum: Fluid responsiveness in the pediatric population.Korean J Anesthesiol. 2019 Dec;72(6):624. doi: 10.4097/kja.19305.c1. Epub 2019 Nov 29. Korean J Anesthesiol. 2019. PMID: 31813206 Free PMC article. No abstract available.
-
Fluid responsiveness in the pediatric population.Korean J Anesthesiol. 2021 Apr;74(2):188. doi: 10.4097/kja.19305.e1. Epub 2021 Mar 26. Korean J Anesthesiol. 2021. PMID: 33794567 Free PMC article. No abstract available.
Abstract
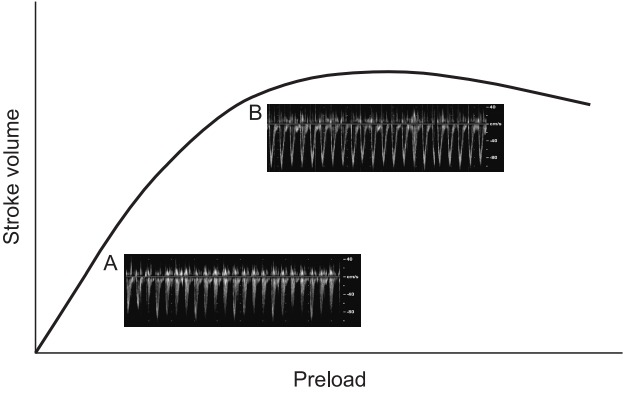
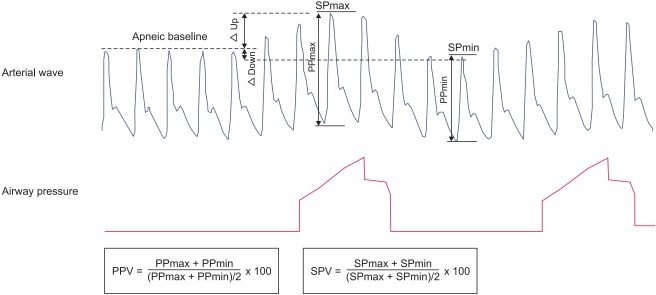
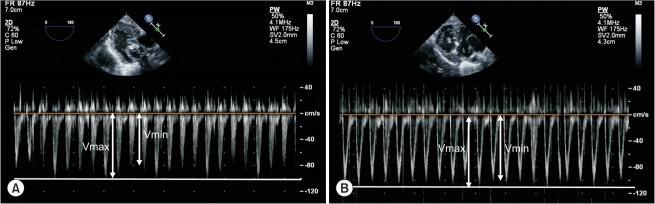
It is challenging to predict fluid responsiveness, that is, whether the cardiac index or stroke volume index would be increased by fluid administration, in the pediatric population. Previous studies on fluid responsiveness have assessed several variables derived from pressure wave measurements, plethysmography (pulse oximeter plethysmograph amplitude variation), ultrasonography, bioreactance data, and various combined methods. However, only the respiratory variation of aortic blood flow peak velocity has consistently shown a predictive ability in pediatric patients. For the prediction of fluid responsiveness in children, flow- or volume-dependent, noninvasive variables are more promising than pressure-dependent, invasive variables. This article reviews various potential variables for the prediction of fluid responsiveness in the pediatric population. Differences in anatomic and physiologic characteristics between the pediatric and adult populations are covered. In addition, some important considerations are discussed for future studies on fluid responsiveness in the pediatric population.
Keywords: Blood pressure; Cardiac output; Children; Doppler ultrasonography; Fluid therapy; Hemodynamic monitoring; Oximetry.
Conflict of interest statement
No potential conflict of interest relevant to this article was reported.
Figures
References
-
- Gan H, Cannesson M, Chandler JR, Ansermino JM. Predicting fluid responsiveness in children: a systematic review. Anesth Analg. 2013;117:1380–92. - PubMed
-
- Michard F. Changes in arterial pressure during mechanical ventilation. Anesthesiology. 2005;103:419–28. - PubMed
-
- Chung E, Cannesson M. Using non invasive dynamic parameters of fluid responsiveness in children: there is still much to learn. J Clin Monit Comput. 2012;26:153–5. - PubMed
-
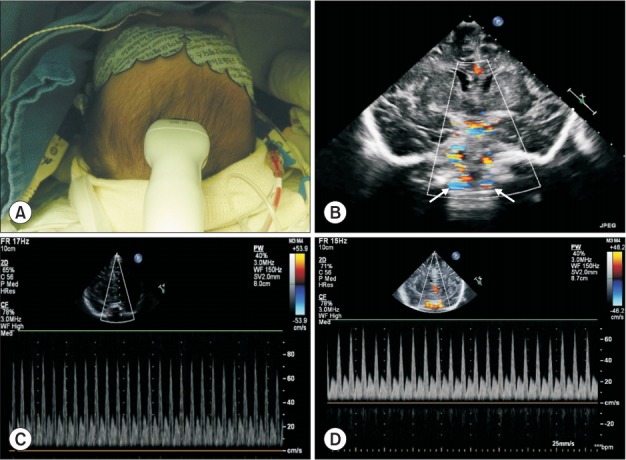
- Kim EH, Lee JH, Song IK, Kim HS, Jang YE, Kim JT. Respiratory variation of internal carotid artery blood flow peak velocity measured by transfontanelle ultrasound to predict fluid responsiveness in infants: a prospective observational study. Anesthesiology. 2019;130:719–27. - PubMed
-
- Morparia KG, Reddy SK, Olivieri LJ, Spaeder MC, Schuette JJ. Respiratory variation in peak aortic velocity accurately predicts fluid responsiveness in children undergoing neurosurgery under general anesthesia. J Clin Monit Comput. 2018;32:221–6. - PubMed
Publication types
MeSH terms
LinkOut - more resources
Full Text Sources