

Novel Lipid Long Intervening Noncoding RNA, Oligodendrocyte Maturation-Associated Long Intergenic Noncoding RNA, Regulates the Liver Steatosis Gene Stearoyl-Coenzyme A Desaturase As an Enhancer RNA
- PMID: 31592021
- PMCID: PMC6771395
- DOI: 10.1002/hep4.1413
Novel Lipid Long Intervening Noncoding RNA, Oligodendrocyte Maturation-Associated Long Intergenic Noncoding RNA, Regulates the Liver Steatosis Gene Stearoyl-Coenzyme A Desaturase As an Enhancer RNA
Abstract
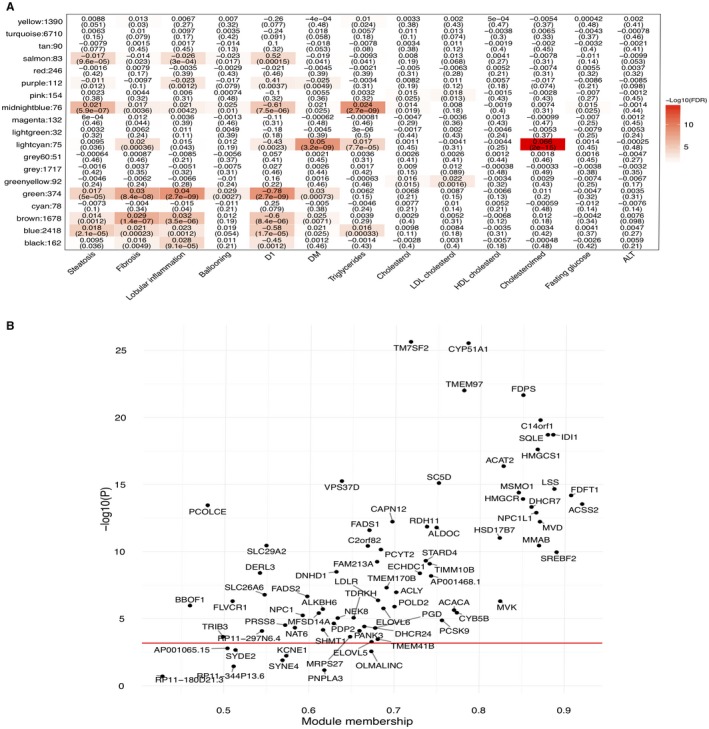
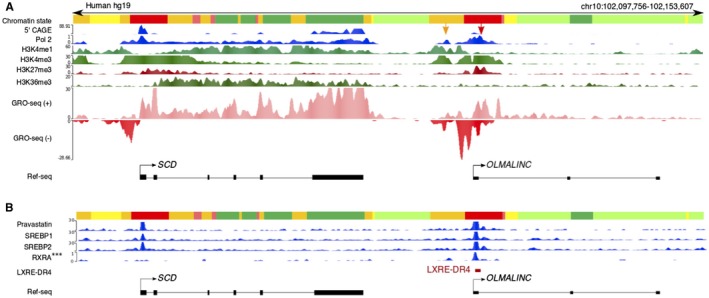
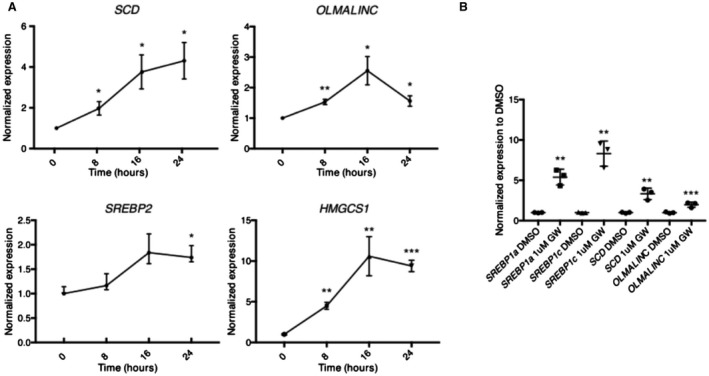
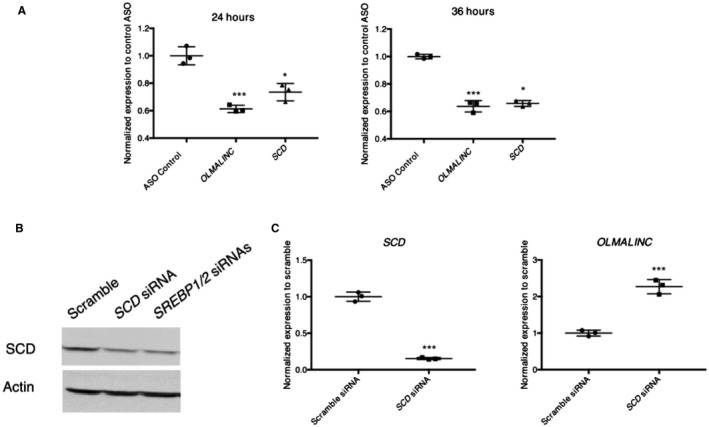
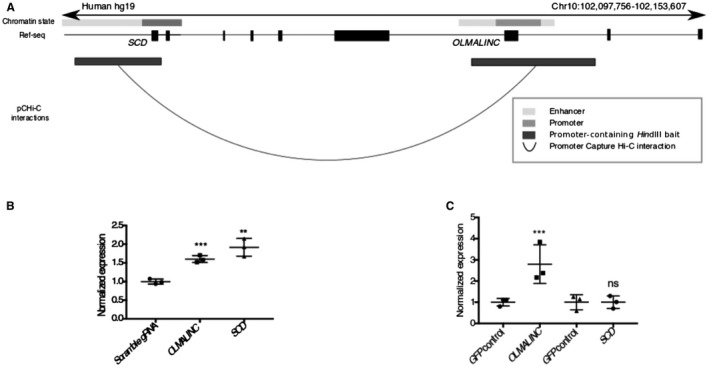
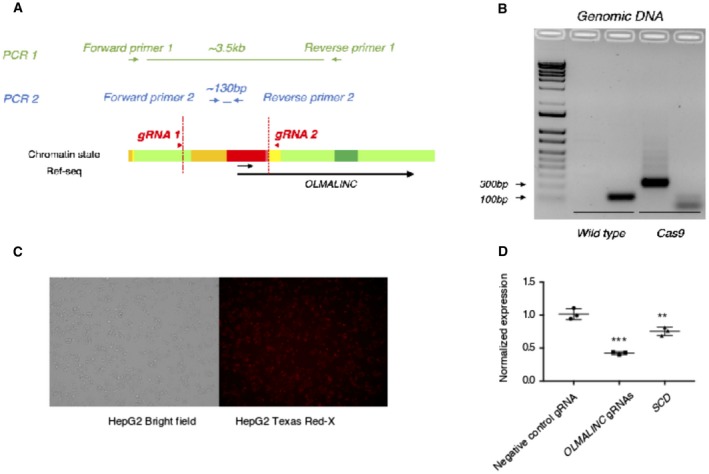
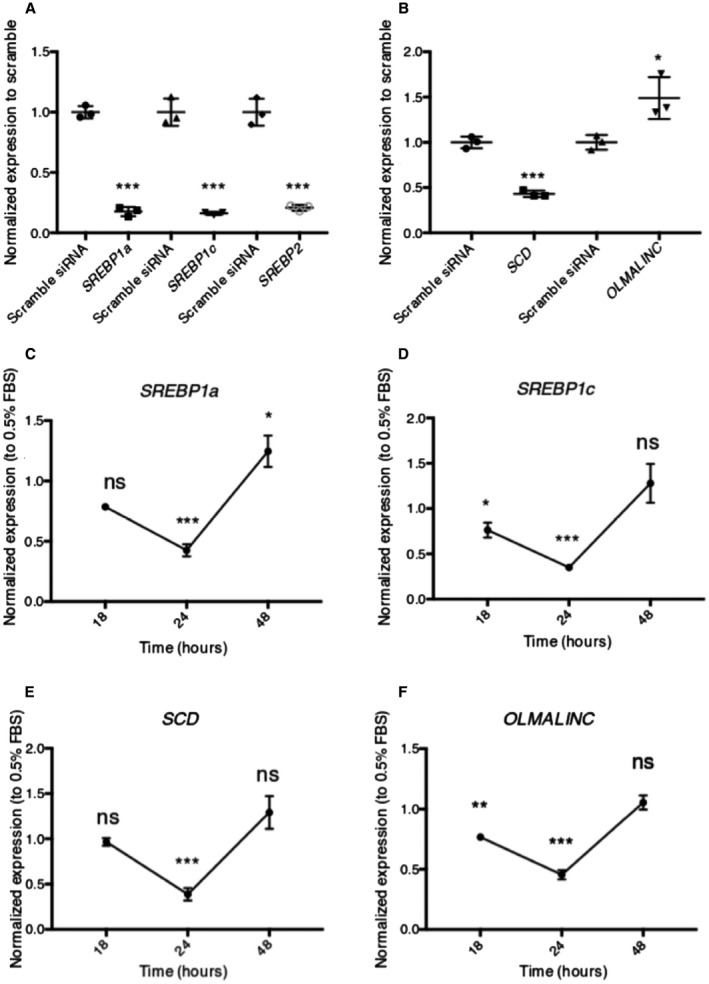
The global obesity epidemic is driving the concomitant rise in nonalcoholic fatty liver disease (NAFLD). To identify new genes involved in central liver functions, we examined liver RNA-sequence data from 259 patients who underwent morbidly obese bariatric surgery. Of these patients, 84 had normal liver histology, 40 simple steatosis, 43 nonalcoholic steatohepatitis, and the remaining 92 patients had varying degrees of NAFLD based on liver histology. We discovered oligodendrocyte maturation-associated long intergenic noncoding RNA (OLMALINC), a long intervening noncoding RNA (lincRNA) in a human liver co-expression network (n = 75 genes) that was strongly associated with statin use and serum triglycerides (TGs). OLMALINC liver expression was highly correlated with the expression of known cholesterol biosynthesis genes and stearoyl-coenzyme A desaturase (SCD). SCD is the rate-limiting enzyme in monounsaturated fatty acids and a key TG gene that is known to be up-regulated in liver steatosis and NAFLD and resides adjacent to OLMALINC on the human chromosome 10q24.31. Next, we functionally demonstrated that OLMALINC regulates SCD as an enhancer-RNA (eRNA), thus describing the first lincRNA that functions as an eRNA to regulate lipid metabolism. Specifically, we show that OLMALINC promotes liver expression of SCD in cis through regional chromosomal DNA-DNA looping interactions. Conclusion: The primate-specific lincRNA OLMALINC is a novel epigenetic regulator of the key TG and NAFLD gene SCD.
© 2019 The Authors. Hepatology Communications published by Wiley Periodicals, Inc., on behalf of the American Association for the Study of Liver Diseases.
Figures
Similar articles
-
High expression of long intervening non-coding RNA OLMALINC in the human cortical white matter is associated with regulation of oligodendrocyte maturation.Mol Brain. 2015 Jan 10;8:2. doi: 10.1186/s13041-014-0091-9. Mol Brain. 2015. PMID: 25575711 Free PMC article.
-
Intermittent hypoxia induces hyperlipidemia in lean mice.Circ Res. 2005 Sep 30;97(7):698-706. doi: 10.1161/01.RES.0000183879.60089.a9. Epub 2005 Aug 25. Circ Res. 2005. PMID: 16123334
-
A novel inhibitor of stearoyl-CoA desaturase-1 attenuates hepatic lipid accumulation, liver injury and inflammation in model of nonalcoholic steatohepatitis.Biol Pharm Bull. 2013;36(2):259-67. doi: 10.1248/bpb.b12-00702. Biol Pharm Bull. 2013. PMID: 23370355
-
Recent advances on stearoyl-Coa desaturase regulation in fatty liver diseases.Curr Drug Metab. 2012 Dec;13(10):1454-63. doi: 10.2174/138920012803762693. Curr Drug Metab. 2012. PMID: 22978399 Review.
-
Role of stearoyl-coenzyme A desaturase in lipid metabolism.Prostaglandins Leukot Essent Fatty Acids. 2003 Feb;68(2):113-21. doi: 10.1016/s0952-3278(02)00261-2. Prostaglandins Leukot Essent Fatty Acids. 2003. PMID: 12538075 Review.
Cited by
-
Statins and their impact on epigenetic regulation: insights into disease.Front Pharmacol. 2025 Jul 17;16:1621163. doi: 10.3389/fphar.2025.1621163. eCollection 2025. Front Pharmacol. 2025. PMID: 40746725 Free PMC article. Review.
-
Cholesterol-Related lncRNAs as Response Predictors of Atorvastatin Treatment in Chilean Hypercholesterolemic Patients: A Pilot Study.Biomedicines. 2023 Mar 1;11(3):742. doi: 10.3390/biomedicines11030742. Biomedicines. 2023. PMID: 36979720 Free PMC article.
-
Cross-tissue omics analysis discovers ten adipose genes encoding secreted proteins in obesity-related non-alcoholic fatty liver disease.EBioMedicine. 2023 Jun;92:104620. doi: 10.1016/j.ebiom.2023.104620. Epub 2023 May 22. EBioMedicine. 2023. PMID: 37224770 Free PMC article.
-
Downregulation of hepatic lipopolysaccharide binding protein improves lipogenesis-induced liver lipid accumulation.Mol Ther Nucleic Acids. 2022 Aug 5;29:599-613. doi: 10.1016/j.omtn.2022.08.003. eCollection 2022 Sep 13. Mol Ther Nucleic Acids. 2022. PMID: 36090751 Free PMC article.
-
Bioinformatics analysis of lncRNAs in the occurrence and development of osteosarcoma.Transl Pediatr. 2022 Jul;11(7):1182-1198. doi: 10.21037/tp-22-253. Transl Pediatr. 2022. PMID: 35958002 Free PMC article.
References
-
- Vernon G, Baranova A, Younossi ZM. Systematic review: the epidemiology and natural history of non‐alcoholic fatty liver disease and non‐alcoholic steatohepatitis in adults. Aliment Pharmacol Ther 2011;34:274‐285. - PubMed
-
- Younossi ZM, Koenig AB, Abdelatif D, Fazel Y, Henry L, Wymer M. Global epidemiology of nonalcoholic fatty liver disease‐meta‐analytic assessment of prevalence, incidence, and outcomes. Hepatology 2016;64:73‐84. - PubMed
Grants and funding
LinkOut - more resources
Full Text Sources
Molecular Biology Databases
Research Materials
Miscellaneous
