Review
. 2019 Oct;28(5):265-273.
doi: 10.1097/RMR.0000000000000212.

Challenges and Opportunities in Connectome Construction and Quantification in the Developing Human Fetal Brain

Affiliations
Review

Challenges and Opportunities in Connectome Construction and Quantification in the Developing Human Fetal Brain

David Hunt et al. Top Magn Reson Imaging. 2019 Oct.

Abstract

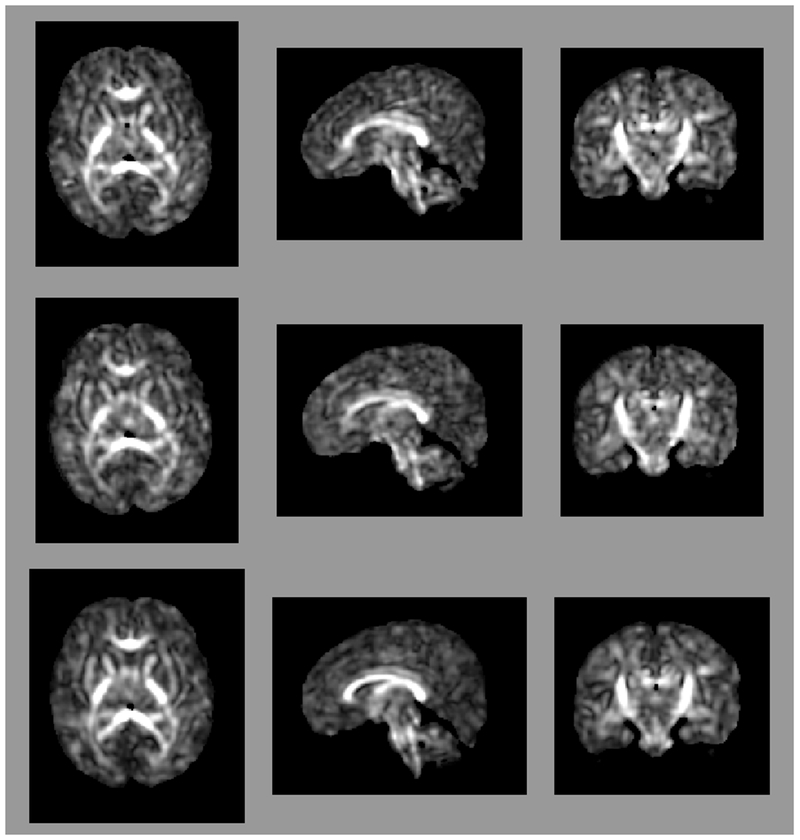
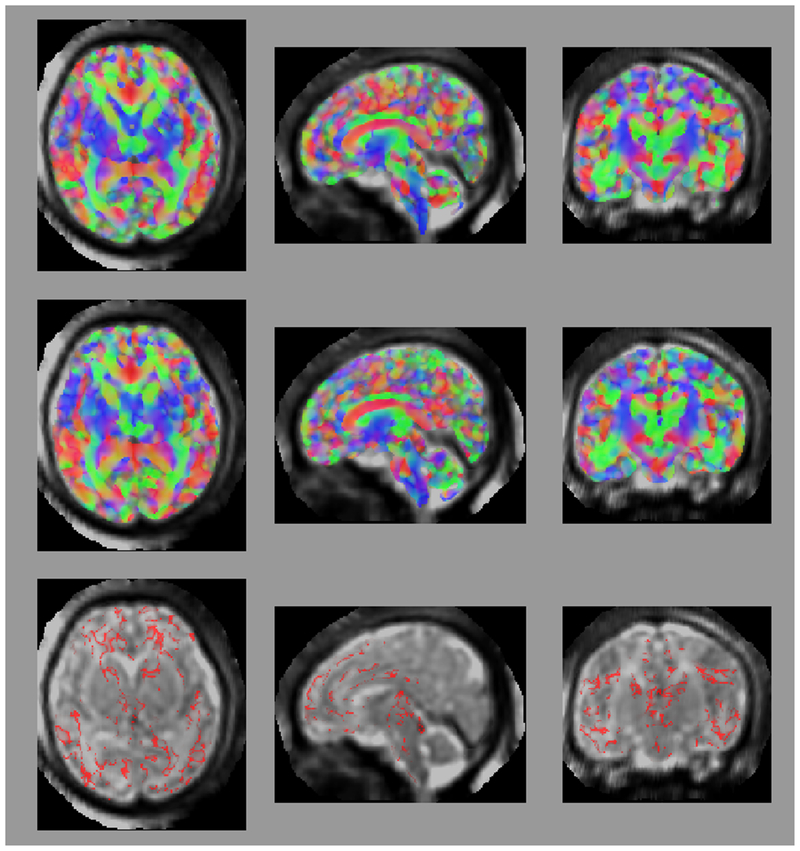
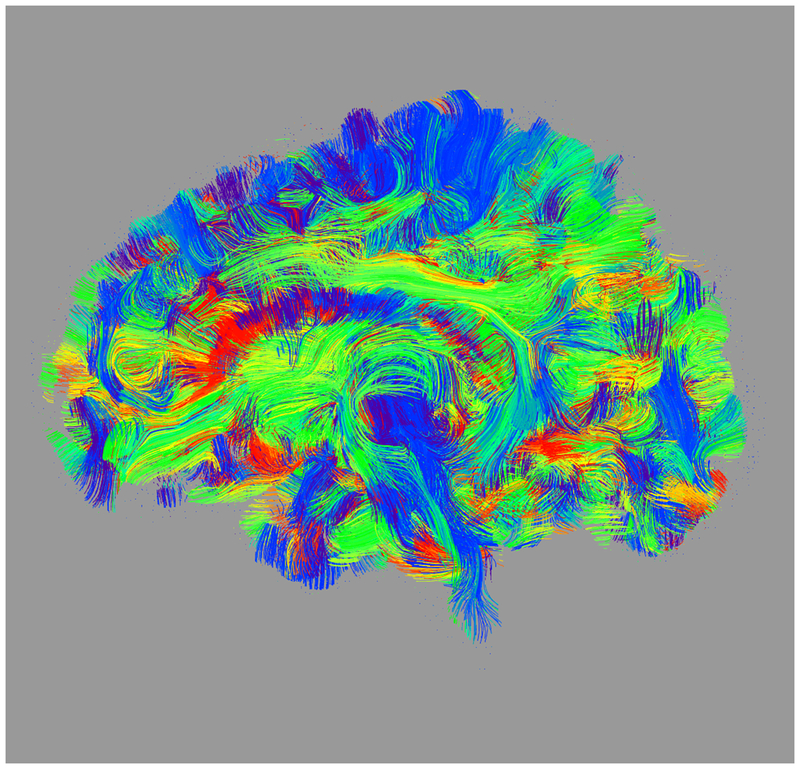
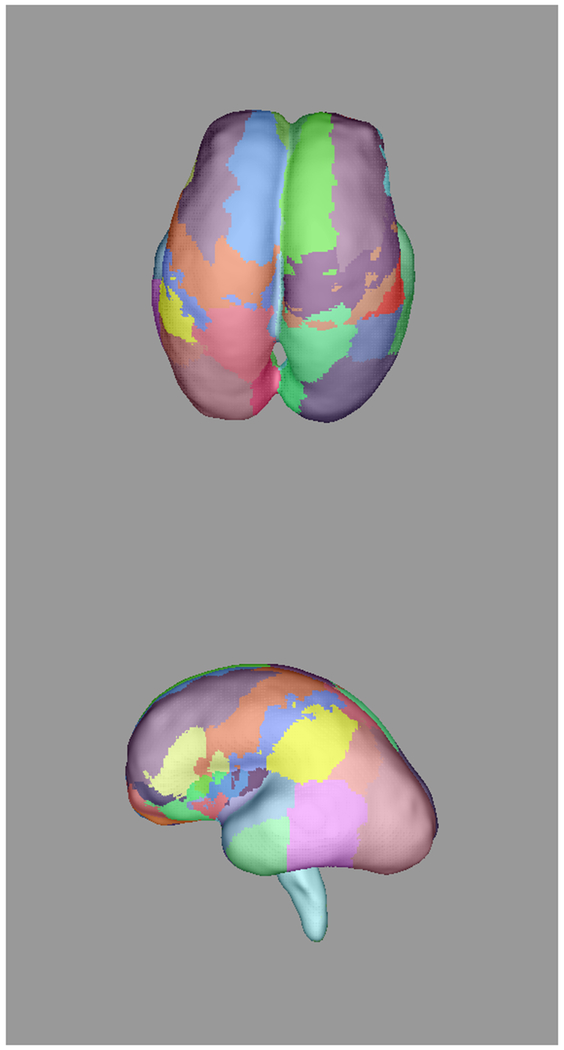
The white matter structure of the human brain undergoes critical developmental milestones in utero, which we can observe noninvasively using diffusion-weighted magnetic resonance imaging. In order to understand this fascinating developmental process, we must establish the variability inherent in such a challenging imaging environment and how measurable quantities can be transformed into meaningful connectomes. We review techniques for reconstructing and studying the brain connectome and explore promising opportunities for in utero studies that could lead to more accurate measurement of structural properties and allow for more refined and insightful analyses of the fetal brain. Opportunities for more sophisticated analyses of the properties of the brain and its dynamic changes have emerged in recent years, based on the development of iterative techniques to reconstruct motion-corrupted diffusion-weighted data. Although reconstruction quality is greatly improved, the treatment of fundamental quantities like edge strength requires careful treatment because of the specific challenges of imaging in utero. There are intriguing challenges to overcome, from those in analysis due to both imaging limitations and the significant changes in structural connectivity, to further image processing to address the specific properties of the target anatomy and quantification into a developmental connectome.


Figures

Figure 1:
Figure 1:
Axial (left column), sagittal (center column), and coronal (right column) views of (a) fractional anisotropy (FA) and (b) principal diffusion direction (weighted by FA) for the test (top row) and retest (middle row), with highlighted angular difference (bottom row), scaled from 0 to π/10. Grayscale range in (a) from FA = 0.0 (black) to FA = 0.4 (white). Colors in (b) show the principal direction of diffusion (red: left-right, green: anterior-posterior, blue: superior-inferior). (c) Whole brain tractography for the test subject. Colors indicate the mean direction of the fiber.
Figure 1:
Figure 1:
Axial (left column), sagittal (center column), and coronal (right column) views of (a) fractional anisotropy (FA) and (b) principal diffusion direction (weighted by FA) for the test (top row) and retest (middle row), with highlighted angular difference (bottom row), scaled from 0 to π/10. Grayscale range in (a) from FA = 0.0 (black) to FA = 0.4 (white). Colors in (b) show the principal direction of diffusion (red: left-right, green: anterior-posterior, blue: superior-inferior). (c) Whole brain tractography for the test subject. Colors indicate the mean direction of the fiber.
Figure 2:
Figure 2:
Plots of (a) FA (r = 0.83, N = 402,893), (b) ADC (r = 0.94, N = 402,893), and (c) reconstructed direction estimates (r = 0.84, N = 25,785,152) for test vs. retest in white matter. Point color indicates density.
Figure 2:
Figure 2:
Plots of (a) FA (r = 0.83, N = 402,893), (b) ADC (r = 0.94, N = 402,893), and (c) reconstructed direction estimates (r = 0.84, N = 25,785,152) for test vs. retest in white matter. Point color indicates density.
Figure 2:
Figure 2:
Plots of (a) FA (r = 0.83, N = 402,893), (b) ADC (r = 0.94, N = 402,893), and (c) reconstructed direction estimates (r = 0.84, N = 25,785,152) for test vs. retest in white matter. Point color indicates density.
Figure 2:
Figure 2:
Plots of (a) FA (r = 0.83, N = 402,893), (b) ADC (r = 0.94, N = 402,893), and (c) reconstructed direction estimates (r = 0.84, N = 25,785,152) for test vs. retest in white matter. Point color indicates density.
Figure 3:
Figure 3:
Automatically propagated most-likely parcel labels from the adult atlas in [51] for (a) 22 weeks (b) 25 weeks, (c) 28 weeks, and (d) 34 weeks GA subjects, illustrating an increase in uncertainty as the age difference increases and the number of cortical features defining gyral structures decreases. Younger subjects exhibit insufficient cortical folding for developmentally-consistent parcellations without information from DWIs.
Figure 3:
Figure 3:
Automatically propagated most-likely parcel labels from the adult atlas in [51] for (a) 22 weeks (b) 25 weeks, (c) 28 weeks, and (d) 34 weeks GA subjects, illustrating an increase in uncertainty as the age difference increases and the number of cortical features defining gyral structures decreases. Younger subjects exhibit insufficient cortical folding for developmentally-consistent parcellations without information from DWIs.
Figure 4:
Figure 4:
Adjacency matrices for four graph constructions: (a) fiber count, (b) mean FA, (c) fiber count with volume correction, and (d) fiber count with length correction. Color represents normalized edge strength (all edges scaled by largest edge strength) from low strength (0.0) in blue to higher relative strength (0.1) in red.
Figure 4:
Figure 4:
Adjacency matrices for four graph constructions: (a) fiber count, (b) mean FA, (c) fiber count with volume correction, and (d) fiber count with length correction. Color represents normalized edge strength (all edges scaled by largest edge strength) from low strength (0.0) in blue to higher relative strength (0.1) in red.
Figure 5:
Figure 5:
(a) Scatter plot of normalized edge strength for the four graph types for the test-retest subject: fiber count (r = 0.92), FA (r = 0.89), volume correction (r = 0.82), and length correction (r = 0.20). (b) Distribution of CV for edge strengths for each of the four graph types over the ensemble of subjects.
Figure 5:
Figure 5:
(a) Scatter plot of normalized edge strength for the four graph types for the test-retest subject: fiber count (r = 0.92), FA (r = 0.89), volume correction (r = 0.82), and length correction (r = 0.20). (b) Distribution of CV for edge strengths for each of the four graph types over the ensemble of subjects.
Figure 6:
Figure 6:
Dice coefficient between test subject and other subjects over graph density. Each differently colored profile corresponds to a different subject.
Figure 6:
Figure 6:
Dice coefficient between test subject and other subjects over graph density. Each differently colored profile corresponds to a different subject.
Figure 6:
Figure 6:
Dice coefficient between test subject and other subjects over graph density. Each differently colored profile corresponds to a different subject.
Figure 6:
Figure 6:
Dice coefficient between test subject and other subjects over graph density. Each differently colored profile corresponds to a different subject.
Figure 7:
Figure 7:
Cross hemispheric connectivity associated with the corpus callosum reconstructed from in utero DWIs. Colors indicate the two ends of the connected regions. (a) Connectivity constructed from individual streamlines. (b) Connectivity inferred from a regressed model of the ensemble of callosal fibers.
Figure 7:
Figure 7:
Cross hemispheric connectivity associated with the corpus callosum reconstructed from in utero DWIs. Colors indicate the two ends of the connected regions. (a) Connectivity constructed from individual streamlines. (b) Connectivity inferred from a regressed model of the ensemble of callosal fibers.

Similar articles

Cited by

References

    1. Jakab A, Kasprian G, Schwartz E, Gruber GM, Mitter C, Prayer D, Schöpf V, and Langs G Disrupted developmental organization of the structural connectome in fetuses with corpus callosum agenesis. Neuroimage, 111:277–288, 2015. - PubMed
    1. Marami B, Salehi SSM, Afacan O, Scherrer B, Rollins CK, Yang E, Estroff JA, Warfield SK, and Gholipour A. Temporal slice registration and robust diffusion-tensor reconstruction for improved fetal brain structural connectivity analysis. NeuroImage, 156:475–488, 2017. - PMC - PubMed
    1. Song L, Mishra V, Ouyang M, Peng Q, Slinger M, Liu S, and Huang H. Human fetal brain connectome: structural network development from middle fetal stage to birth. Frontiers in Neuroscience, 11:561, 2017. - PMC - PubMed
    1. Dubois J, Dehaene-Lambertz G, Kulikova S, Poupon C, Hüppi PS, and Hertz-Pannier L. The early development of brain white matter: a review of imaging studies in fetuses, newborns and infants. Neuroscience, 276:48–71, 2014. - PubMed
    1. Pfefferbaum A, Adalsteinsson E, and Sullivan EV. Replicability of diffusion tensor imaging measurements of fractional anisotropy and trace in brain. Journal of Magnetic Resonance Imaging: An Official Journal of the International Society for Magnetic Resonance in Medicine, 18(4):427–433, 2003. - PubMed

MeSH terms