. 2019 Oct;20(10):172-180.
doi: 10.1002/acm2.12734. Epub 2019 Oct 8.

Signal and contrast to noise ratio evaluation of fluoroscopic loops for interventional fluoroscope quality control

Affiliations

Signal and contrast to noise ratio evaluation of fluoroscopic loops for interventional fluoroscope quality control

Allen R Goode et al. J Appl Clin Med Phys. 2019 Oct.

Abstract

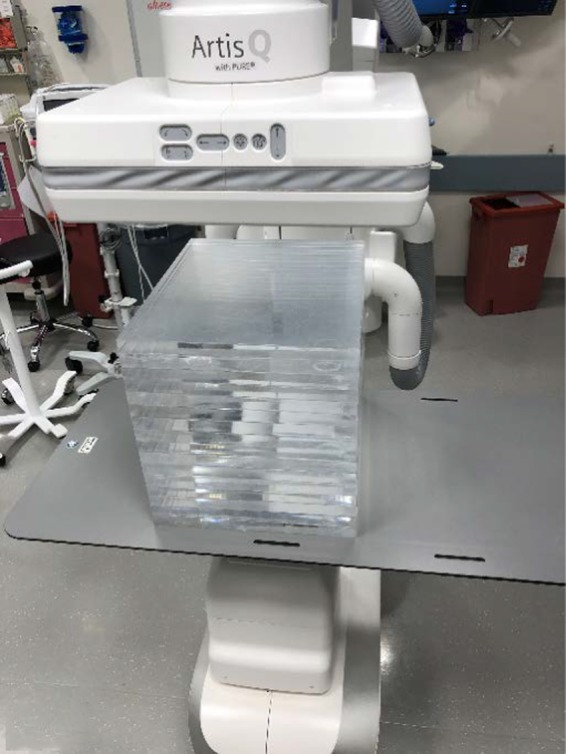
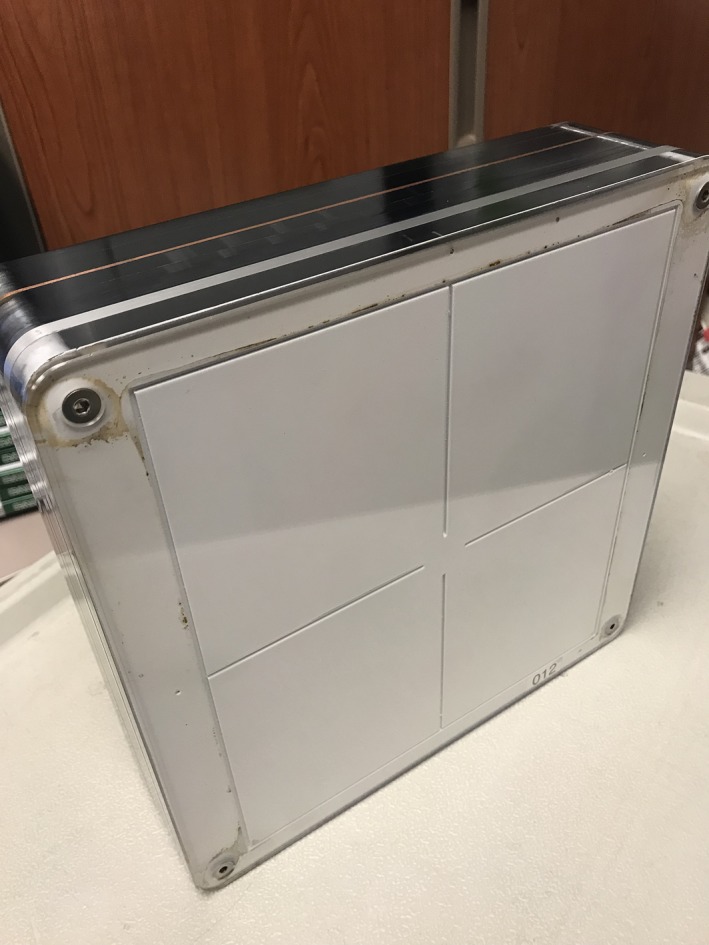
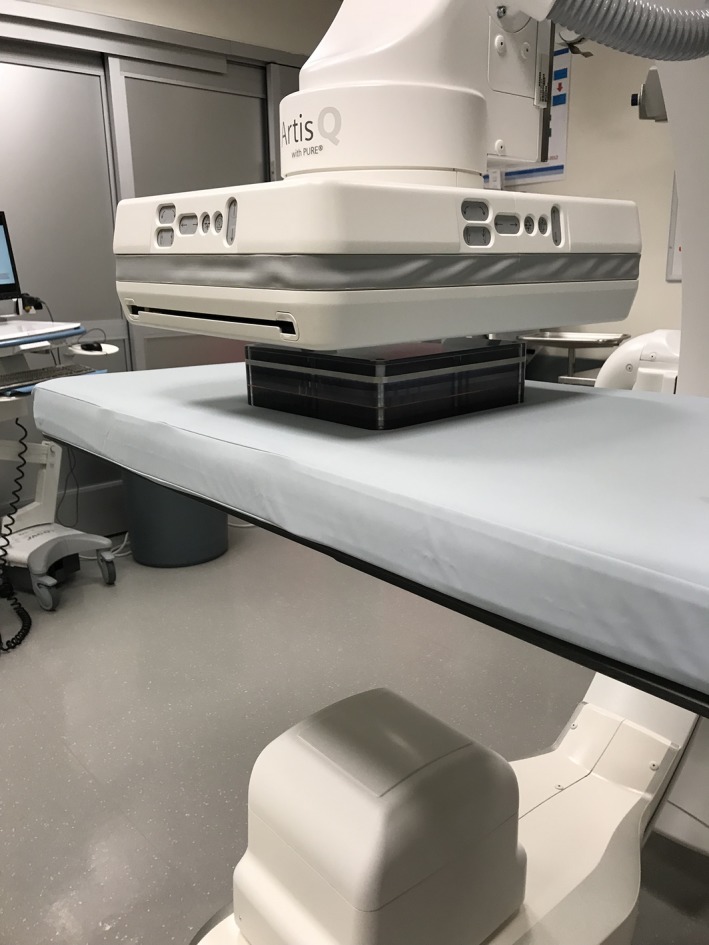
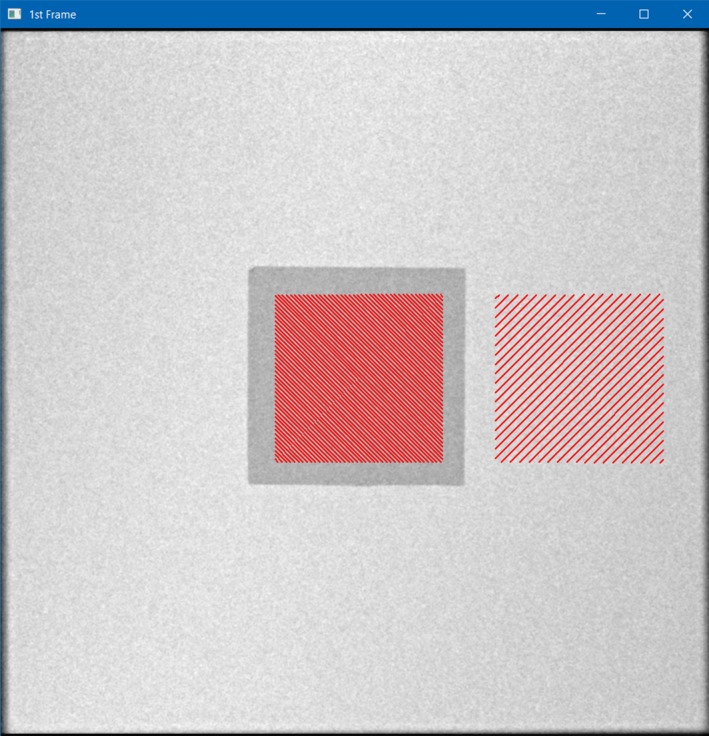
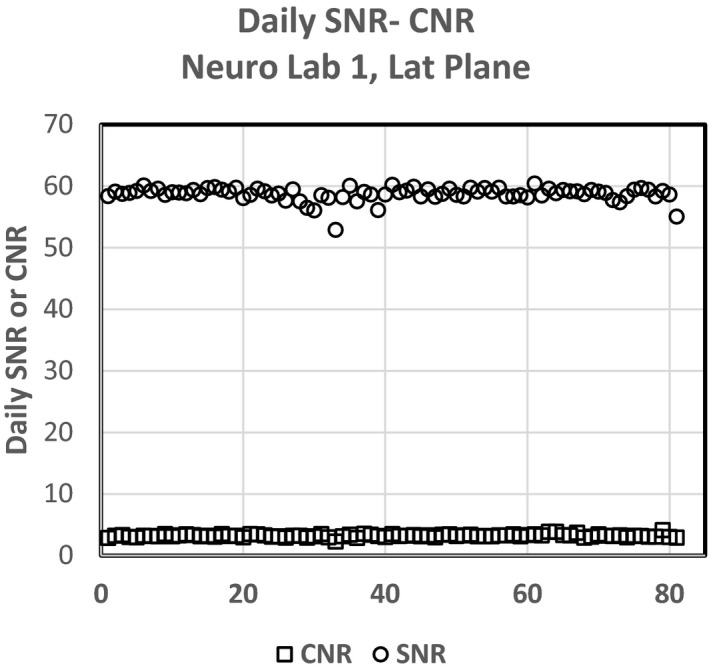
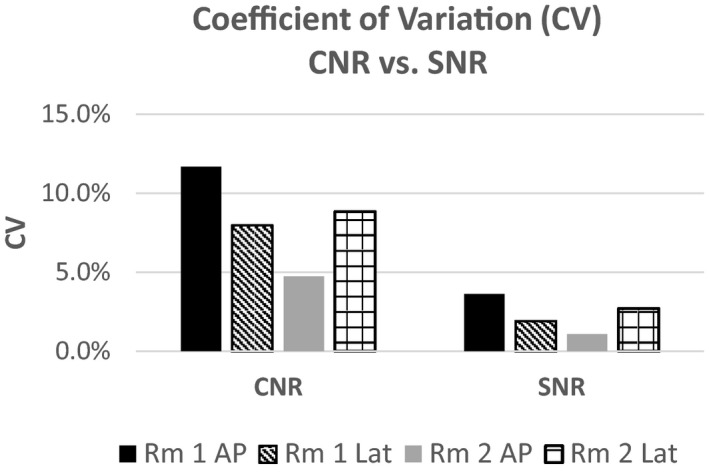
Modern fluoroscopes pose a challenge for the clinical physicist for annual testing and continued upkeep. These fluoroscopes are critical to providing care to patients for complex interventions, and continue to evolve in automated image quality adjustments. Few tools in software or hardware currently exist to assist the physicist or technologist in gauging fluoroscope constancy or readiness for procedures. Many modalities such as mammography, computed tomography or even magnetic resonance imaging are much more evolved with respect to testing or quality control. In this work we sought to provide simple reproducible tools and methods for spot evaluating or continued quality testing of interventional fluoroscopes.

Keywords: CNR; SNR; fluoroscopy; quality control.


Conflict of interest statement

The authors have no relevant conflict of interest.

Figures

Figure 1
Figure 1
Tin swatch used for contrast to noise ratio measurement directly on top of 1st sheet of polymethyl methacrylate.
Figure 2
Figure 2
Slab phantom consisting of a stack of 2.54 cm thick 35.5 cm × 43.2 cm polymethyl methacrylate sheets.
Figure 3
Figure 3
Custom made, patient equivalent QC phantom or “CD Phantom”.
Figure 4
Figure 4
QC phantom in position on patient support.
Figure 5
Figure 5
Interactive Data Language screen capture showing 1st Frame of fluoro loop used for ROI selections (red) in center (on Tin swatch) and offset Right (in background) used for signal to noise ratio and Contrast to Noise Ratio measurements using the slab phantom.
Figure 6
Figure 6
Screen capture from QC‐Track program indicating ROIs used for processing of signal to noise ratio (SNR) on CD phantom (Left) and SNR and contrast to noise ratio (CNR) ROIs from CNR phantom in INR (Right).
Figure 7
Figure 7
Signal to noise ratio for each frame of fluoro loop for 22.9 cm polymethyl methacrylate slab phantom.
Figure 8
Figure 8
Contrast to noise ratio for each frame of fluoro loop for 22.9 cm polymethyl methacrylate slab phantom.
Figure 9
Figure 9
Average signal to noise ratio for each fluoro loop through polymethyl methacrylate slab phantoms of varying thickness.
Figure 10
Figure 10
Average contrast to noise ratio (CNR) for each fluoro loop through polymethyl methacrylate slab phantoms of varying thickness. CNR decreases steadily until the phantom thickness reaches 30.5 cm, after which a different beam shaping filter is used by the fluoroscope.
Figure 11
Figure 11
Signal to noise ratio (SNR) and contrast to noise ratio (CNR) using fixed 22.86 cm polymethyl methacrylate (PMMA) slabs with different fluoro dose levels. Note the change in both SNR and CNR for low and high dose fluoro modes where the dose is lower or higher than the normal fluoro dose setting. From the low to norm setting, the dose rate increased 5 mGy/min, however the kVp decreased by 3, and the copper spectral filter decreased 0.6 mm, indicating that the beam quality was significantly higher for the low fluoro setting compared to the normal setting, which reduced the SNR from low to norm at this elevated thickness of PMMA.
Figure 12
Figure 12
Shewhart Control Chart for Data from IR‐19 using the CD phantom.
Figure 13
Figure 13
Signal to noise ratio and contrast to noise ratio daily values for Neuro Lab‐ 1, Lat plane.
Figure 14
Figure 14
Differences in CV from signal to noise ratio to contrast to noise ratio.

References

    1. American College of Radiology- American Association of Physicsists in Medicine, Technical Standard For Diagnostic Medical Physics Performance Monitoring of Fluoroscopic Equipment; 2016.
    1. Medical Imaging and Technology Alliance, NEMA XR‐27-2013 . X‐ray Equipment for Interventional Procedures User Quality Control Mode, National Electrical Manufacturers Association with Ammendment 1 . http://www.medicalimaging.org. Accessed September 23, 2019.
    1. American College of Radiology, Computed Tomography Quality Control Manual; 2017.
    1. American College of Radiology, Digital Mammography Quality Control Manual; 2018.
    1. Tapiovaara MJ, Wagner RF. SNR and noise measurements for medical imaging: I. A practical approach to statistical decision theory. Phys Med Biol. 1993;38:71–92. - PubMed

Publication types

LinkOut - more resources