. 2019 Nov 1:427:152306.
doi: 10.1016/j.tox.2019.152306. Epub 2019 Oct 5.

Genistein inhibits proliferation and induces senescence in neonatal mouse pituitary gland explant cultures

Affiliations

Genistein inhibits proliferation and induces senescence in neonatal mouse pituitary gland explant cultures

Karen E Weis et al. Toxicology. .

Abstract

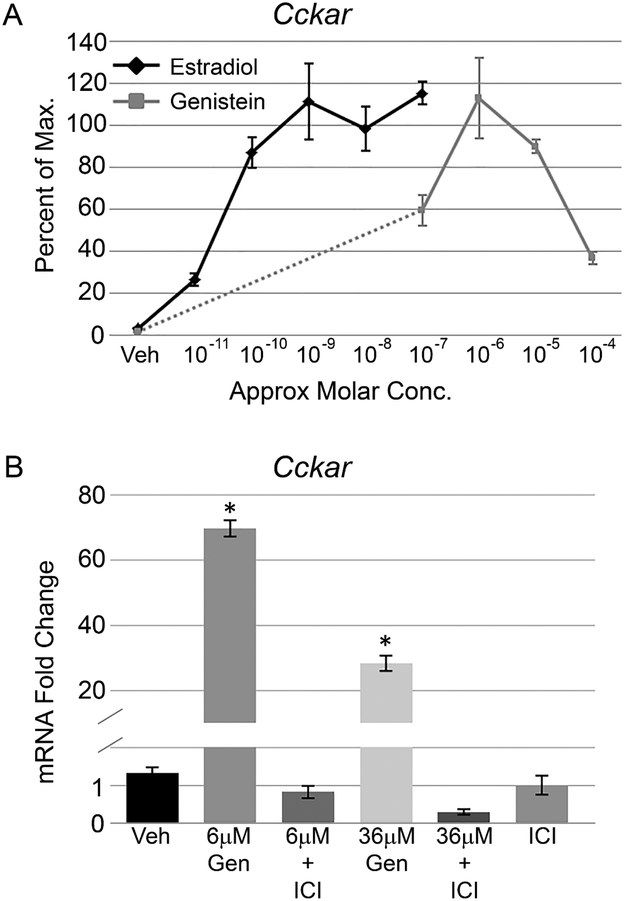
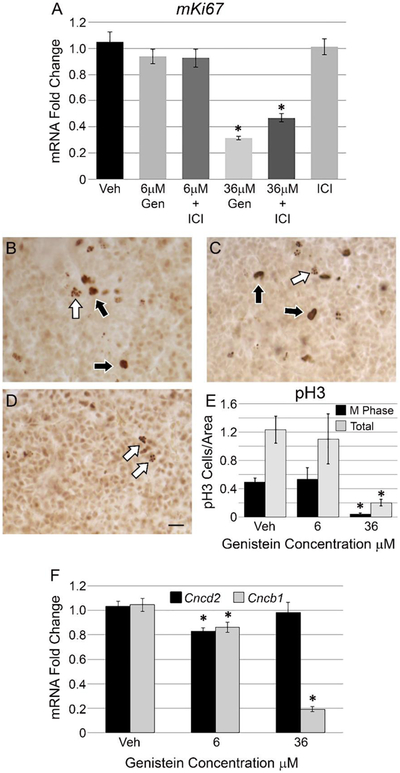
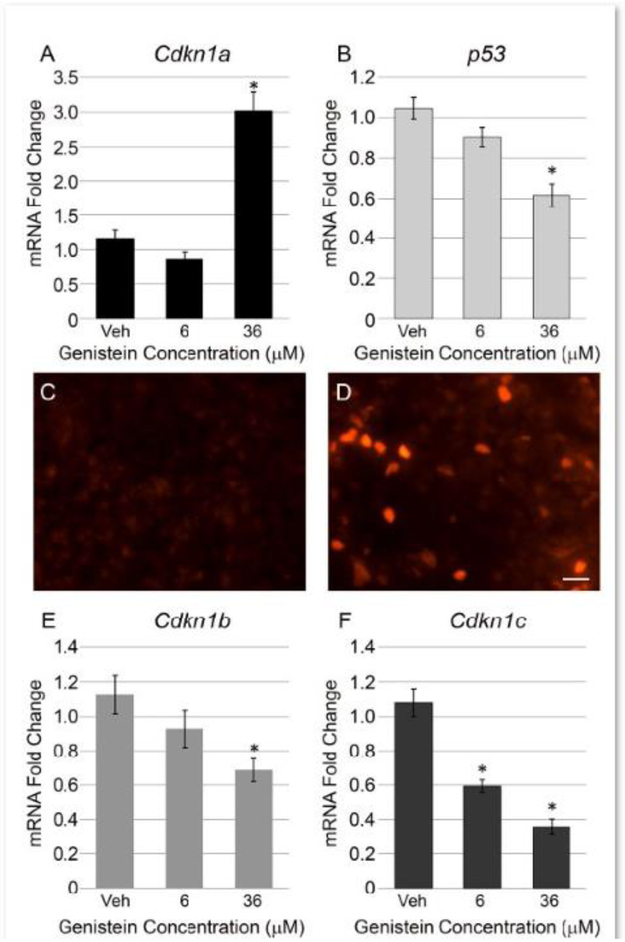
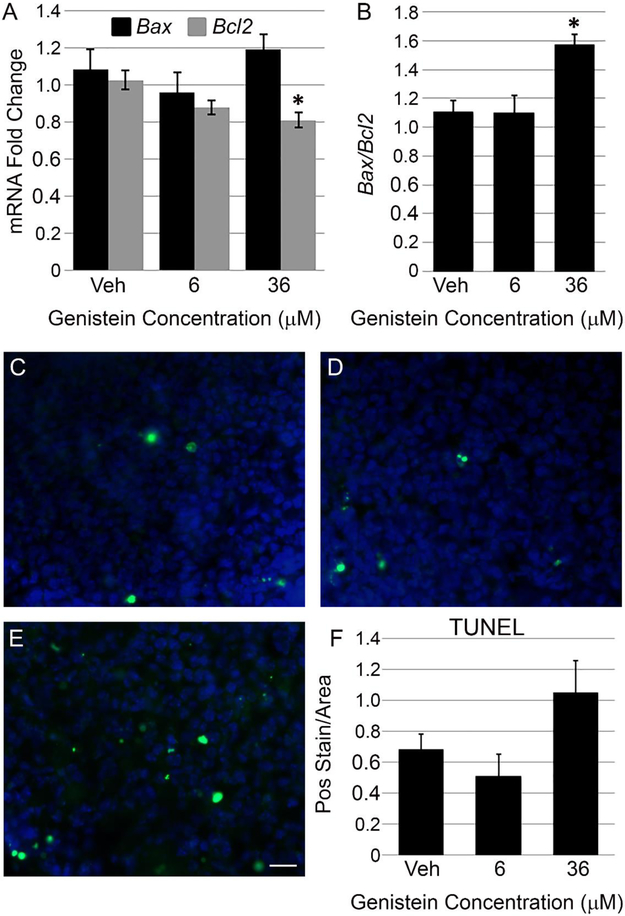
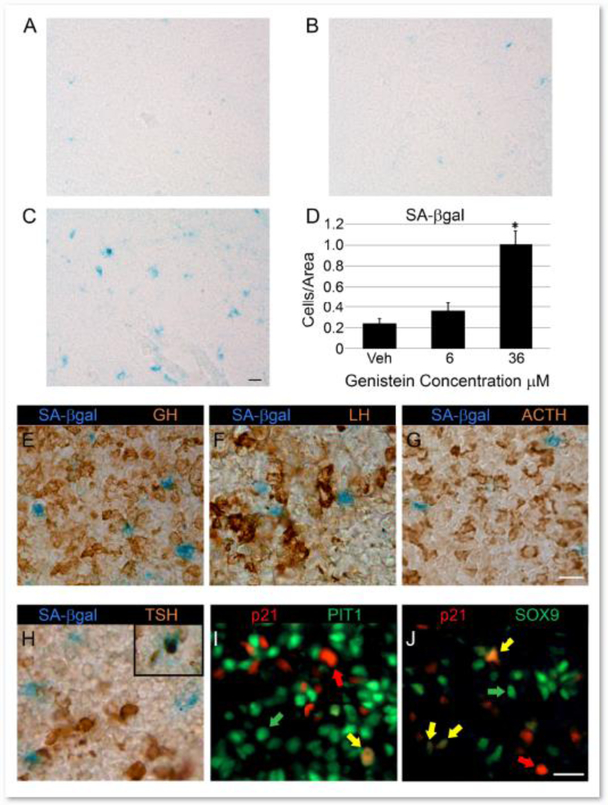
Genistein is an isoflavone abundant in soybean and infants are exposed to high levels of genistein in soy-based formula. It is known that genistein mediates estrogen receptor (ER) signaling, and exposure during neonatal development could cause acute and long term endocrine effects. We assayed genistein's impact on the neonatal mouse pituitary gland because it is an endocrine signaling hub and is sensitive to endocrine disruption during critical periods. Pituitary explant cultures, which actively proliferate and differentiate, were exposed to 0.06 μM-36 μM genistein and assayed for mRNA and protein changes. Genistein induced mRNA expression of the ERα regulated gene, Cckar, to the same magnitude as estradiol (E2) but with less potency. Interestingly, 36 μM genistein strongly inhibited pituitary proliferation, measured by a reduction in mKi67 mRNA and phospho-Histone H3 immunostaining. Examining cell cycle dynamics, we found that 36 μM genistein decreased Ccnb1 (Cyclin B1) mRNA; while mRNA for the cyclin dependent kinase inhibitor Cdkn1a (p21) was upregulated, correlated with an apparent increase in p21 immunostained cells. Strikingly, we observed a robust onset of cellular senescence, permanent cell cycle exit, in 36 μM genistein treated pituitaries by increased senescence activated β-galactosidase staining. We also found that 36 μM genistein decreased Bcl2 mRNA levels, a gene protective against apoptosis. Taken together these data suggest that genistein exposure during the neonatal period could initiate senescence and halt proliferation during a time when the proper numbers of endocrine cells are being established for mature gland function.

Keywords: Genistein; Pituitary; Proliferation; Senescence.


Conflict of interest statement

Declaration of interests

The authors declare that they have no known competing financial interests or personal relationships that could have appeared to influence the work reported in this paper.

Figures

Figure1:
Figure1:. Genistein can activate ERα regulated gene expression in the pituitary gland.
A) Cholecystokinin A receptor (Cckar) mRNA levels were measured by qPCR over a range of estradiol (E2) and genistein concentrations in cultured pituitary glands. Both E2 and genistein induce Cckar transcript to similar peak levels, but approximately 1000 fold more genistein is required for maximal Cckar activation relative to E2. Dashed line indicates genistein concentrations not tested. The graph represents the mean +/− SEM for 5-14 pituitaries per treatment. B) Pituitary explants were treated with 6 μM and 36 μM genistein alone or in combination with the antiestrogen ICI 182,780 (ICI). ICI completely antagonizes the genistein mediated induction of Cckar mRNA at both concentrations and ICI alone has no effect of Cckar levels. The graph represents the mean +/− SEM for 5-14 pituitaries per treatment. One way ANOVA P<0.0001, *P<0.05 by Dunnett’s post-hoc test.
Figure 2:
Figure 2:. Genistein inhibits pituitary cell proliferation and cell cycle progression at 36 μM.
A) Transcript levels of the cell cycle marker mKi67 were measured by qPCR following genistein treatment in pituitary explants. Levels of mKi67 mRNA are not changed by 6 μM genistein, but 36 μM significantly represses mKi67 expression. Co-treatment with the antiestrogen ICI 182,780 (ICI) fails to reverse the 36 μM mediated downregulation of mKi67 mRNA, and ICI alone has no effect on mKi67. The graph represents the mean +/− SEM for 5-9 pituitaries per treatment. One way ANOVA P<0.0001, *P<0.05 by Dunnett’s post-hoc test. Immunohistochemistry (IHC) for phospho-histone H3 (pH3) was performed on pituitary explants following vehicle or genistein treatment at 6 μM and 36 μM. B) Vehicle and C) 6 μM genistein treated pituitaries show numerous pH3 positive cells in the anterior lobe displaying M phase pattern of staining (black arrows) as well as G2 pattern of staining (white arrows). D) In 36 μM genistein treated pituitary glands, there is far less pH3 detection in the anterior lobe and most cells exhibit the G2 phase pattern of staining (white arrows). E) Quantification of pH3 positive cells for vehicle, 6 μM and 36 μM genistein treated pituitary explants, showing a significant decrease in the number of cells with M phase staining and total pH3 positive cells in 36 μM genistein treated pituitaries relative to vehicle. Representative images for pH3 IHC, scale=50 μm, The graph represents the mean +/− SEM for 3 pituitaries per treatment. One way ANOVA for M phase cells P=0.02, one way ANOVA for total cells P=0.04. *P<0.05 by Dunnett’s post-hoc test. F) mRNA for Ccnd2 and Ccnb1 were assayed by qPCR in pituitary explants following genistein treatment. 36 μM genistein potently represses mRNA for Ccnb1, but has no effect on Ccnd2 levels. Both Ccnd2 and Ccnb1 show a slight but significant decrease in mRNA following 6 μM genistein treatment. The graph represents the mean +/− SEM for 9-15 pituitaries per treatment. One way ANOVA for Ccnd2, P=0.02, One way ANOVA for Ccnb1 P<0.0001, *P<0.05 by Dunnett’s post-hoc test.
Figure 3:
Figure 3:. Genistein differentially impacts cyclin dependent kinase inhibitors in the neonatal pituitary, strongly inducing Cdkn1a/p21.
A) Cyclin dependent kinase inhibitor Cdkn1a mRNA was measured by qPCR in pituitary explant cultures following 6 μM and 36 μM genistein treatment. The 36 μM genistein treatment strongly induces Cdkn1a mRNA relative to vehicle and 6 μM genistein. The graph represents the mean +/− SEM for 10-15 pituitaries per treatment. One way ANOVA P<0.0001, *P<0.05 by Dunnett’s post-hoc test. B) Tumor protein p53 mRNA is significantly downregulated by 36 μM genistein in the pituitary gland. The graph represents the mean +/− SEM for 9-15 pituitaries per treatment. One way ANOVA P<0.0001, *P<0.05 by Dunnett’s post-hoc test. Immunohistochemistry (IHC) for p21 shows a noticeable increase in positively stained cells in 36 μM genistein treated pituitary anterior lobe (D) relative to vehicle treatment (C). Representative images of IHC for 3 pituitaries per sample, scale=50 μm. mRNA levels of the cyclin dependent kinase inhibitors Cdkn1b and Cdkn1c were assessed by qPCR. Pituitary explants treated with 36 μM genistein exhibit a significant decrease in Cdkn1b mRNA (E); while, both 6 μM and 36 μM genistein downregulate mRNA for Cdkn1c in the pituitary gland (F). The graph represents the mean +/− SEM for 10-15 pituitaries per treatment. One way ANOVA for Cdkn1b, P=0.02, One way ANOVA for Cdkn1c P<0.0001, *P<0.05 by Dunnett’s post-hoc test.
Figure 4:
Figure 4:. Bcl2 mRNA is downregulated by genistein in the pituitary gland.
A) Levels of mRNA for the pro-apoptotic gene Bax and the anti-apoptotic gene Bcl2 were measured by qPCR in pituitary explant cultures following 6 μM and 36 μM genistein treatment. Genistein does not affect Bax mRNA levels, but both 6 μM and 36 μM genistein significantly reduce Bcl2 mRNA relative to vehicle control. The graph represents mean +/− SEM for 8-13 pituitaries per treatment. One way ANOVA for Bcl2 P=0.006, *P<0.05 by Dunnett’s post-hoc test. B) Bax/Bcl2 mRNA ratio of 36 μM genistein treated pituitaries is significantly increased relative to vehicle and 6 μM genistein treated cultures. The graph represents mean +/− SEM for 8-13 pituitaries per treatment. One way ANOVA P=0.01, *P<0.05 by Dunnett’s post-hoc test. TUNEL assay was performed on pituitary explants to monitor apoptosis following genistein exposure. Vehicle (C) and 6 μM genistein (D) treated pituitaries exhibit similar levels of DNA fragmented ends (green speckles) in the anterior lobe. Whereas, 36 μM genistein treated pituitary glands (E) show a noticeable increase in TUNEL staining relative to vehicle or 6 μM genistein. Cell nuclei are visualized with DAPI (blue stain). Representative images of TUNEL staining, scale=50 μm. F) Quantification shows increase in TUNEL staining of 36 μM genistein treated pituitaries is not significantly different from vehicle. Graph represents mean +/− SEM for 3 pituitaries per sample, One way ANOVA P=0.12.
Figure 5:
Figure 5:. Pituitary cell senescence is induced by 36 μM genistein, predominantly in non-differentiated cells.
Senescence was assessed in the anterior lobes of pituitaries cultured with 6 μM and 36 μM genistein by senescence activated β-galactosidase (SA β-gal) staining. Vehicle and 6 μM genistein dosed pituitary explants have a few SA β-gal stained cells scattered throughout the gland (blue staining in A and B, respectively). However, pituitary glands treated with 36 μM genistein show numerous SA β-gal positive cells (C). D) Quantification of SA β-gal shows significant increase in senescent cells in 36 μM treated pituitary explants relative to vehicle controls. Representative images for SA β-gal, scale=50 μm. Graph represents mean +/− SEM for 4 pituitaries per sample. One way ANOVA P<0.0005, *P<0.05 by Dunnett’s post-hoc test. SA β-gal staining was carried out along with immunohistochemistry (IHC) for hormone antibodies against growth hormone (GH), luteinizing hormone (LHβ), adrenocorticotropic hormone (ACTH) and thyroid stimulating hormone (TSHβ) (E, F, G and H respectively) in pituitary explants cultured with 36 μM genistein. The absence of SA β-gal and hormone antibody co-staining indicates mature hormone expressing cells are not becoming senescent following genistein exposure. We see only rare SA β-gal/TSHβ co-positive cells (inset panel H). IHC was performed for p21 and PIT1 expressing cells (I) in 36 μM genistein treated pituitary glands. Anterior lobe sections show p21/PIT double stained cells (yellow arrow) relative to cells expressing only p21 (red arrow) or PIT1 (green arrow). We further examined p21 expression in SOX9 positive pituitary progenitors (J) in 36 μM genistein treated explants. We also see a p21/SOX9 co-stained progenitor cells (yellow arrows) in the pituitary anterior lobe relative to cells expressing p21 (red arrow) or SOX9 alone (green arrow) Representative images for SA β-gal and/or IHC, 3 pituitaries per sample, scale=50 μm.

Similar articles

Cited by

References

    1. Akiyama T, Ishida J, Nakagawa S, Ogawara H, Watanabe S, Itoh N, Shibuya M, Fukami Y, 1987. Genistein, a specific inhibitor of tyrosine-specific protein kinases. J. Biol. Chem 262, 5592–5. - PubMed
    1. Allred CD, Allred KF, Ju YH, Virant SM, Helferich WG, 2001. Soy diets containing varying amounts of genistein stimulate growth of estrogen-dependent (MCF-7) tumors in a dose-dependent manner. Cancer Res. 61, 5045–50. - PubMed
    1. Asa SL, Ezzat S, 2002. The pathogenesis of pituitary tumours. Nat. Rev. Cancer 2, 836–849. doi:10.1038/nrc926 - DOI - PubMed
    1. Badger TM, Ronis MJJ, Hakkak R, Rowlands JC, Korourian S, 2002. The Health Consequences of Early Soy Consumption. J. Nutr 132, 559S–565S. doi:10.1093/jn/132.3.559S - DOI - PubMed
    1. Barlow J, Johnson JAP, Scofield L, 2007. Early Life Exposure to the Phytoestrogen Genistein and Breast Cancer Risk in Later Years. Fact Sheet on the Phytoestrogen Geinistein.

Publication types