. 2019 Dec 6:18:275-284.
doi: 10.1016/j.omtn.2019.08.026. Epub 2019 Sep 9.

Circular RNA hsa_circ_0016070 Is Associated with Pulmonary Arterial Hypertension by Promoting PASMC Proliferation

Affiliations

Circular RNA hsa_circ_0016070 Is Associated with Pulmonary Arterial Hypertension by Promoting PASMC Proliferation

Sijing Zhou et al. Mol Ther Nucleic Acids. .

Abstract

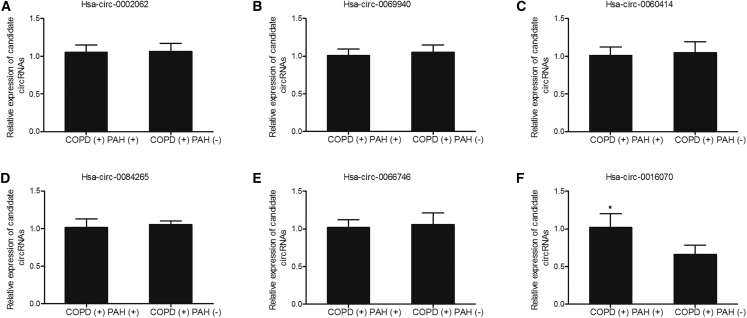
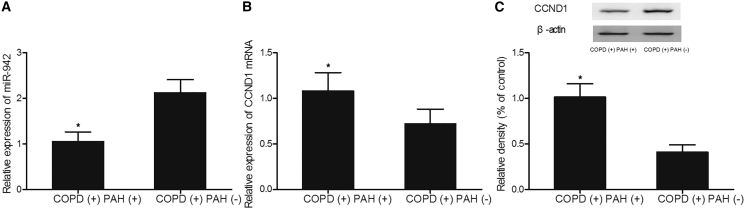
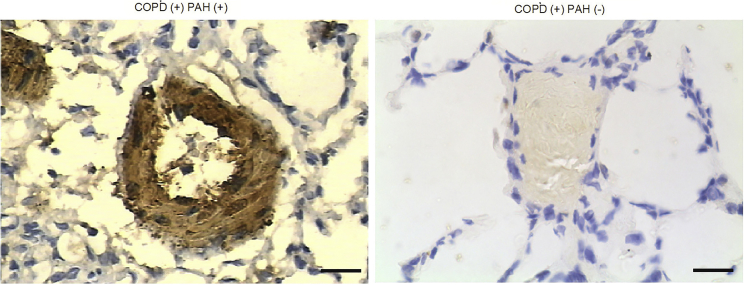
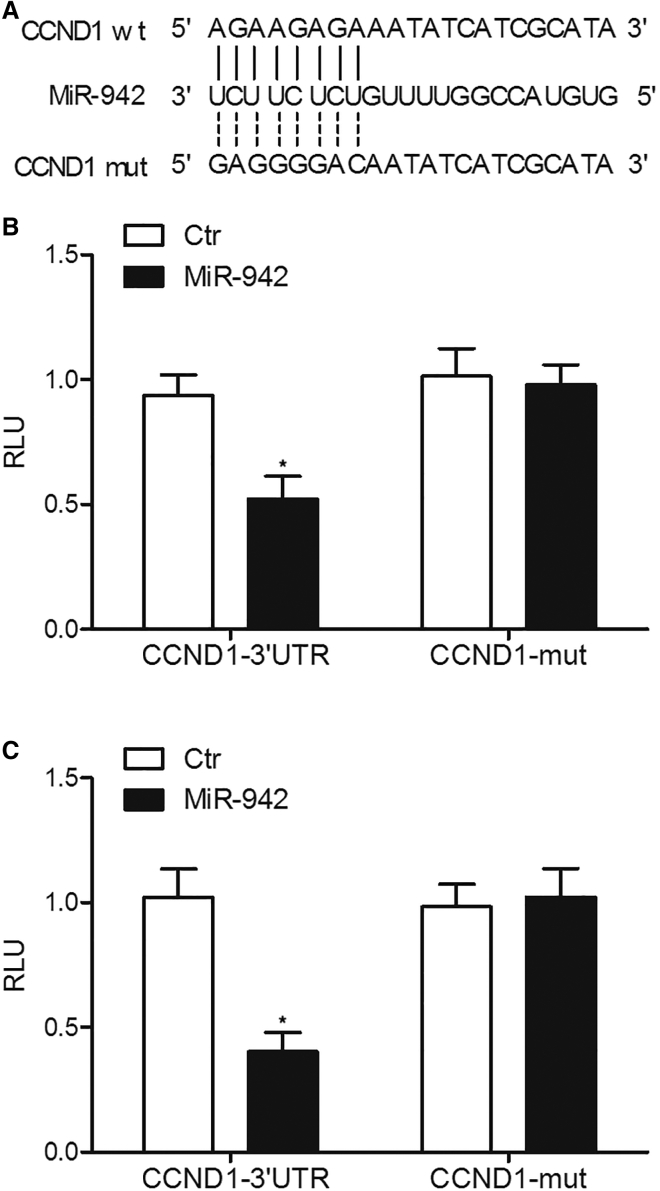
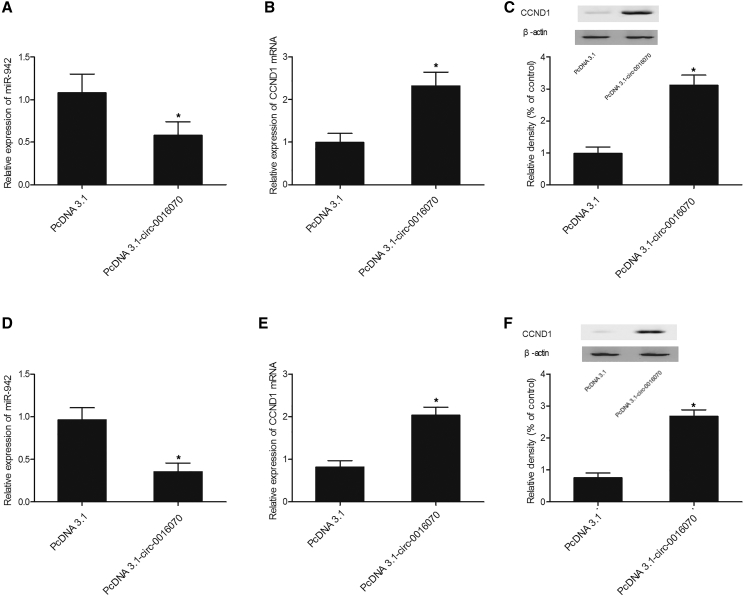
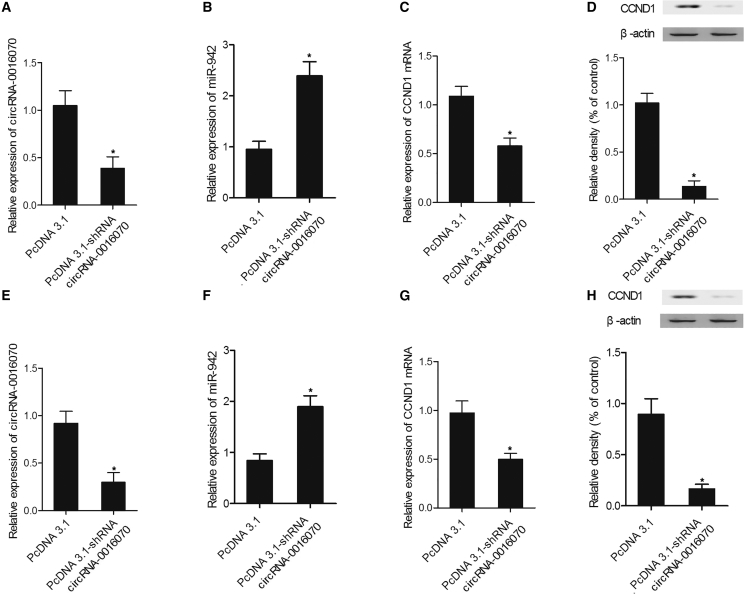
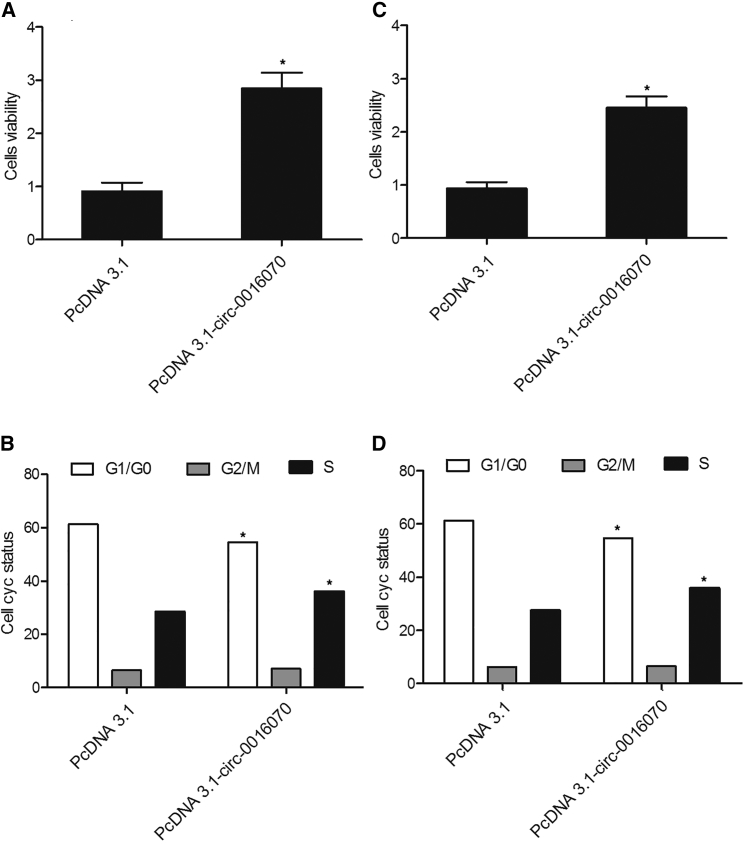
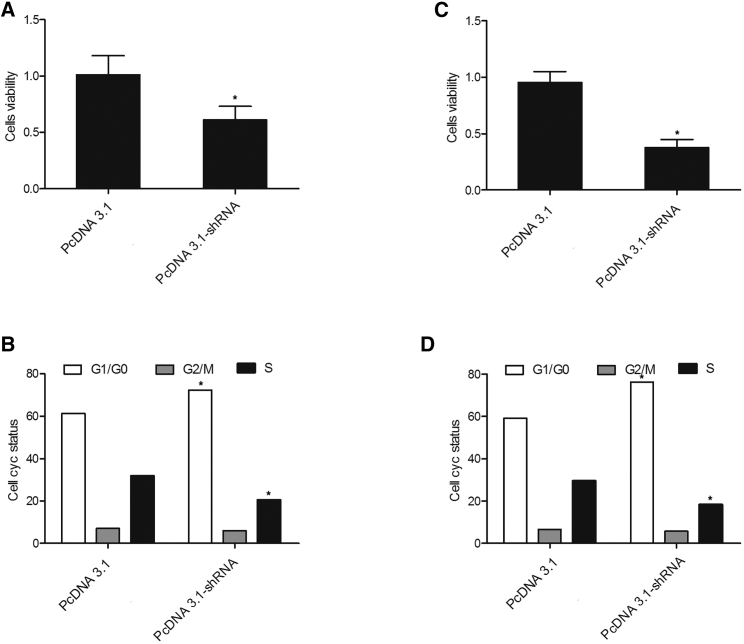
Noncoding RNAs play an important role in the pathogenesis of pulmonary arterial hypertension (PAH). In this study, we investigated the roles of hsa_circ_0016070, miR-942, and CCND1 in PAH. circRNA microarray was used to search circRNAs involved in PAH, whereas real-time PCR and western blot analysis were performed to detect miR-942 and CCND1 expression in different groups. In addition, the effect of miR-942 on CCND1 expression, as well as the effect of hsa_circ_0016070 on the expression of miR-942 and CCND1, was also studied using real-time PCR and western blot analysis. Moreover, MTT assay and flow cytometry were used to detect the effect of hsa _circ_0016070 on cell proliferation and cell cycle. According to the results of circRNA microarray analysis, hsa _circ_0016070 was identified to be associated with the risk of PAH in chronic obstructive pulmonary disease (COPD) patients. The miR-942 level in the COPD(+) PAH(+) group was much lower than that in the COPD(+) PAH(-) group, while the CCND1 level in the COPD(+) PAH(+) group was much higher. CCND1 was identified as a candidate target gene of miR-942, and the luciferase assay showed that the luciferase activity of wild-type CCND1 3' UTR was inhibited by miR-942 mimics. In addition, hsa _circ_0016070 reduced miR-942 expression and enhanced CCND1 expression. Furthermore, hsa _circ_0016070 evidently increased cell viability and decreased the number of cells arrested in the G1/G0 phase. In summary, the results of this study suggested that hsa_circ_0016070 was associated with vascular remodeling in PAH by promoting the proliferation of pulmonary artery smooth muscle cells (PASMCs) via the miR-942/CCND1. Accordingly, has_circ_0016070 might be used as a novel biomarker in the diagnosis and treatment of PAH.

Keywords: CCND1; PAH; hsa _circ_0016070; miR-942; smooth muscle.


Figures

Figure 1
Figure 1
A circRNA Microarray Showed that hsa_circ_0016070 Was Involved in the Pathogenesis of PAH in COPD Patients A circRNA microarray was used to identify the circRNAs involved in PAH and found that hsa_circ_0016070 was involved in the pathogenesis of PAH in COPD patients. *p < 0.05, versus the COPD(+) PAH(−) group. (A) hsa_circ_0002062. (B) hsa_circ_0069940. (C) hsa_circ_0060414. (D) hsa_circ_0084265. (E) hsa_circ_0066746. (F) hsa_circ_0016070.
Figure 2
Figure 2
Differential Expression of miR-942 and CCND1 in Different Groups Was Detected Using Real-Time PCR and Western Blot Analysis (A) The miR-942 level in the COPD(+) PAH(+) group was much lower than that in the COPD(+) PAH(−) group. *p < 0.05, versus the COPD(+) PAH(−) group. (B) The CCND1 mRNA level in the COPD(+) PAH(+) group was much higher than that in the COPD(+) PAH(−) group. *p < 0.05, versus the COPD(+) PAH(−) group. (C) The CCND1 protein level in the COPD(+) PAH(+) group was much higher than that in the COPD(+) PAH(−) group. *p < 0.05, versus the COPD(+) PAH(−) group.
Figure 3
Figure 3
CCND1 Protein Level between COPD(+), PAH(+), and COPD(+) PAH(−) Groups IHC assay was carried out to compare CCND1 protein levels between COPD(+) PAH(+) and COPD(+) PAH(−) groups. The CCND1 protein level in the COPD(+) PAH(+) group was evidently upregulated compared with that in the COPD(+) PAH(−) group.
Figure 4
Figure 4
CCND1 Was Validated to Be a Target Gene of miR-942 via Schematic Comparison and Luciferase Assays (A) Schematic comparison by utilization of an online miRNA database miRDB (http://www.mirdb.org) between miR-942 and the “seed sequence” in the 3′ UTR of CCND1. (B) miR-942 mimics decreased the luciferase activity of HPASMC cells co-transfected with wild-type CCND1 3′ UTR but not the luciferase activity of cells co-transfected with mutant CCND1 3′ UTR. *p < 0.05, versus cells co-transfected with mutant CCND1 3′ UTR. (C) miR-942 mimics decreased the luciferase activity of RPASMC cells co-transfected with wild-type CCND1 3′ UTR but not the luciferase activity of cells co-transfected with mutant CCND1 3′ UTR. *p < 0.05, versus cells co-transfected with mutant CCND1 3′ UTR.
Figure 5
Figure 5
Expression of hsa_circ_0016070, miR-942, and CCND1 in Different Groups Was Detected Using Real-Time PCR and Western Blot Analysis (A) hsa_circ_0016070 reduced the level of miR-942 in HPASMCs. *p < 0.05, versus control group. (B) hsa_circ_0016070 increased the level of CCND1 mRNA in HPASMCs. *p < 0.05, versus control group. (C) The CCND1 protein level in HPASMCs transfected with hsa_circ_0016070 was increased compared with that in negative control (NC). *p < 0.05, versus control group. (D) hsa_circ_0016070 reduced the level of miR-942 in RPASMCs. *p < 0.05, versus control group. (E) hsa_circ_0016070 increased the level of CCND1 mRNA in RPASMCs. *p < 0.05, versus control group. (F) The CCND1 protein level in RPASMCs transfected with hsa_circ_0016070 was increased compared with that in NC. *p < 0.05, versus control group.
Figure 6
Figure 6
Effect of hsa_circ_0016070 shRNA on the Expression of hsa_circ_0016070, miR-942, and CCND1 Was Detected Using Real-Time PCR and Western Blot Analysis (A) hsa_circ_0016070 shRNA reduced hsa_circ_0016070 expression in HPASMCs. *p < 0.05, versus control group. (B) Inhibition of hsa_circ_0016070 increased the expression of miR-942 in HPASMCs. *p < 0.05, versus control group. (C) The level of CCND1 mRNA in HPASMCs transfected with hsa_circ_0016070 shRNA was downregulated compared with that in NC. *p < 0.05, versus control group. (D) The level of CCND1 protein in HPASMC cells transfected with hsa_circ_0016070 shRNA was downregulated compared with that in NC. *p < 0.05, versus control group. (E) hsa_circ_0016070 shRNA reduced hsa_circ_0016070 expression in RPASMCs. *p < 0.05, versus control group. (F) Inhibition of hsa_circ_0016070 increased the expression of miR-942 in RPASMCs. *p < 0.05, versus control group. (G) The level of CCND1 mRNA in RPASMCs transfected with hsa_circ_0016070 shRNA was downregulated compared with that in NC. *p < 0.05, versus control group. (H) The level of CCND1 protein in RPASMCs transfected with hsa_circ_0016070 shRNA was downregulated compared with that in NC. *p < 0.05, versus control group.
Figure 7
Figure 7
Effect of hsa_circ_0016070 on Cell Proliferation and Cell Cycle Was Detected via MTT Assay and Flow Cytometry (A) HPASMCs transfected with hsa_circ_0016070 showed a higher growth rate than NC cells. *p < 0.05, versus control group. (B) Fewer HPASMCs were in the G1/G0 phase after transfection with hsa_circ_0016070, but the number of cells in the S phase was much higher after transfection. *p < 0.05, versus control group. (C) RPASMCs transfected with hsa_circ_0016070 showed a higher growth rate than NC cells. *p < 0.05, versus control group. (D) Fewer RPASMCs were in the G1/G0 phase after transfection with hsa_circ_0016070, but the number of cells in the S phase was much higher after transfection. *p < 0.05, versus control group.
Figure 8
Figure 8
Effect of hsa_circ_0016070 shRNA on Cell Proliferation and Cell Cycle Was Detected via MTT Assay and Flow Cytometry (A) HPASMCs transfected with hsa_circ_0016070 shRNA showed a slower growth rate than NC cells. *p < 0.05, versus control group. (B) More HPASMCs were in the G1/G0 phase after transfection with hsa_circ_0016070 shRNA, but the number of cells in the S phase was much lower after transfection. *p < 0.05, versus control group. (C) RPASMCs transfected with hsa_circ_0016070 shRNA showed a slower growth rate than NC cells. *p < 0.05, versus control group. (D) More RPASMCs were in the G1/G0 phase after transfection with hsa_circ_0016070 shRNA, but the number of cells in the S phase was much lower after transfection. *p < 0.05, versus control group.

References

    1. Hoeper M.M., Barberà J.A., Channick R.N., Hassoun P.M., Lang I.M., Manes A., Martinez F.J., Naeije R., Olschewski H., Pepke-Zaba J. Diagnosis, assessment, and treatment of non-pulmonary arterial hypertension pulmonary hypertension. J. Am. Coll. Cardiol. 2009;54(1, Suppl):S85–S96. - PubMed
    1. Stenmark K.R., Fagan K.A., Frid M.G. Hypoxia-induced pulmonary vascular remodeling: cellular and molecular mechanisms. Circ. Res. 2006;99:675–691. - PubMed
    1. Ghofrani H.A., Wiedemann R., Rose F., Schermuly R.T., Olschewski H., Weissmann N., Gunther A., Walmrath D., Seeger W., Grimminger F. Sildenafil for treatment of lung fibrosis and pulmonary hypertension: a randomised controlled trial. Lancet. 2002;360:895–900. - PubMed
    1. Tuder R.M., Abman S.H., Braun T., Capron F., Stevens T., Thistlethwaite P.A., Haworth S.G. Development and pathology of pulmonary hypertension. J. Am. Coll. Cardiol. 2009;54(1, Suppl):S3–S9. - PubMed
    1. McMurtry M.S., Archer S.L., Altieri D.C., Bonnet S., Haromy A., Harry G., Bonnet S., Puttagunta L., Michelakis E.D. Gene therapy targeting survivin selectively induces pulmonary vascular apoptosis and reverses pulmonary arterial hypertension. J. Clin. Invest. 2005;115:1479–1491. - PMC - PubMed