. 2019 Dec:40:100710.
doi: 10.1016/j.dcn.2019.100710. Epub 2019 Sep 27.

Eye tracking in developmental cognitive neuroscience - The good, the bad and the ugly

Affiliations

Eye tracking in developmental cognitive neuroscience - The good, the bad and the ugly

Roy S Hessels et al. Dev Cogn Neurosci. 2019 Dec.

Abstract

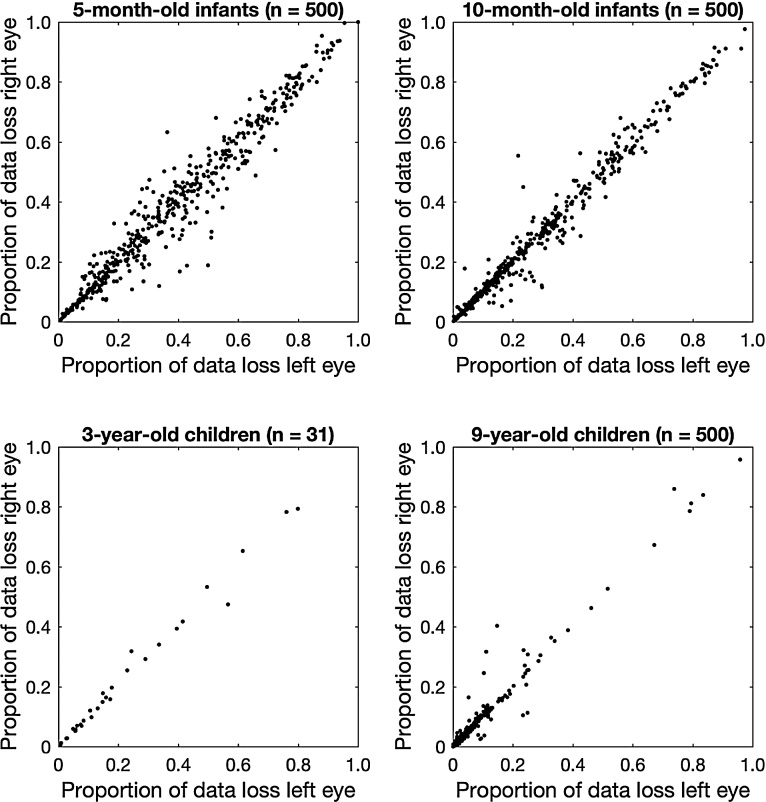
Eye tracking is a popular research tool in developmental cognitive neuroscience for studying the development of perceptual and cognitive processes. However, eye tracking in the context of development is also challenging. In this paper, we ask how knowledge on eye-tracking data quality can be used to improve eye-tracking recordings and analyses in longitudinal research so that valid conclusions about child development may be drawn. We answer this question by adopting the data-quality perspective and surveying the eye-tracking setup, training protocols, and data analysis of the YOUth study (investigating neurocognitive development of 6000 children). We first show how our eye-tracking setup has been optimized for recording high-quality eye-tracking data. Second, we show that eye-tracking data quality can be operator-dependent even after a thorough training protocol. Finally, we report distributions of eye-tracking data quality measures for four age groups (5 months, 10 months, 3 years, and 9 years), based on 1531 recordings. We end with advice for (prospective) developmental eye-tracking researchers and generalizations to other methodologies.

Keywords: Data analysis; Data quality; Development; Eye tracking; Longitudinal.


Figures

Fig. 1
Fig. 1
Example horizontal gaze position data for two 10-month-old infants from Hessels et al. (2016a). Gaze positions recorded from the two eyes are given by separate lines (blue for left eye, orange for right eye). Top: Example 4-s horizontal gaze position on screen in pixels (left axis) and degrees (right axis) of relatively high quality. Bottom: Example 4-s horizontal gaze position on screen in pixels (left axis) and degrees (right axis) of relatively low quality. Degrees are reported under the assumption that the participant's eyes were 65 cm from the screen, and that all areas of the screen were at equal distance from the eyes. (For interpretation of the references to color in this figure legend, the reader is referred to the web version of this article.)
Fig. 2
Fig. 2
(a) Eye-tracking setup used in the YOUth cohort study for ages 0 and up. The eye tracker (Tobii TX300) is mounted in a frame that can be lowered and heightened (indicated by the yellow arrow). The eye tracker can be tilted from fully vertical to fully horizontal (indicated by the blue arrow), such that the optimal relative position and orientation between eye tracker and participant can be achieved with almost all manners of seating. (b) The setup as it is generally positioned with larger infants and toddlers. (c) The setup as it is generally positioned with young infants. The seats in (b) and (c) are mounted on a platform with wheels. (For interpretation of the references to color in this figure legend, the reader is referred to the web version of this article.)
Fig. 3
Fig. 3
Distributions of the estimates for precision for 5-month-old infants (top left) and 10-month-old infants (top right) and data loss for 5-month-old infants (bottom left) and 10-month-old infants (bottom right). Precision was estimated by the Root Mean Squared sample-to-sample deviation (RMS s2s) of the gaze-position signals. Data loss was estimated as the proportion of samples without a gaze coordinate. Each distribution belongs to one research assistant (RA) and is kernel-smoothed to ease visual comparison. The number of recordings for each RA is given in parentheses. The values on the y-axes are empirical probability densities for the smoothed empirical distribution. The area under the curve of each smoothed empirical distribution is 1.
Fig. 4
Fig. 4
Distributions of the estimates for precision (left) and data loss (right) for the four different age groups: 5 months, 10 months, 3 years, and 9 years. Precision was estimated by the Root Mean Squared sample-to-sample deviation (RMS s2s) of the gaze-position signals. Data loss was estimated as the proportion of samples without a gaze coordinate. Distributions are kernel-smoothed to ease visual comparison. The number of recordings for each age group is given in parentheses. The values on the y-axes are empirical probability densities for the smoothed empirical distribution. The area under the curve of each smoothed empirical distribution is 1.
Fig. 5
Fig. 5
Proportion of data loss for the left eye plotted against the proportion of data loss for the right eye for the four different age groups: 5 months (top left), 10 months (top right), 3 years (bottom left), and 9 years (bottom right).

References

    1. Amso D., Johnson S.P. Learning by selection: visual search and object perception in young infants. Dev. Psychol. 2006;42(6):1236–1245. - PubMed
    1. Aslin R.N. Infant eyes: a window on cognitive development. Infancy. 2012 - PMC - PubMed
    1. Aslin R.N., McMurray B. Automated corneal-reflection eye tracking in infancy: methodological developments and applications to cognition. Infancy. 2004;6(October (2)):155–163. - PubMed
    1. Aslin R.N. What's in a look? Dev. Sci. 2007;10(January (1)):48–53. - PMC - PubMed
    1. Brainard D.H. The psychophysics toolbox. Spat. Vis. 1997;10(4):433–436. - PubMed

Publication types