

Exposure-Response Analyses for Upadacitinib Efficacy and Safety in the Crohn's Disease CELEST Study and Bridging to the Extended-Release Formulation
- PMID: 31594037
- PMCID: PMC7027977
- DOI: 10.1002/cpt.1668
Exposure-Response Analyses for Upadacitinib Efficacy and Safety in the Crohn's Disease CELEST Study and Bridging to the Extended-Release Formulation
Abstract
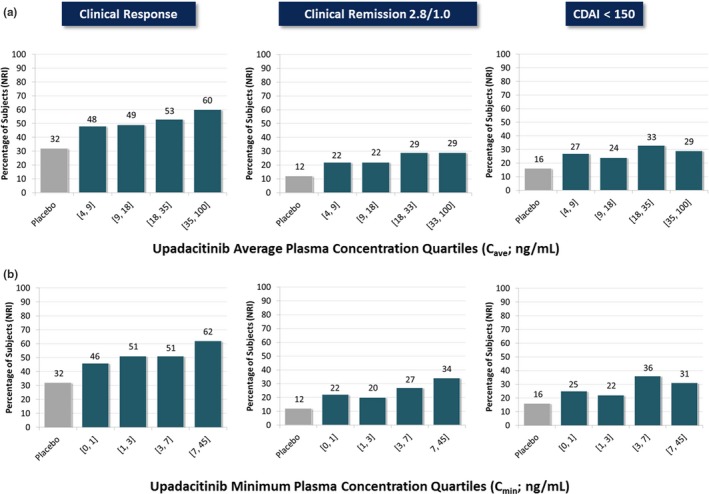
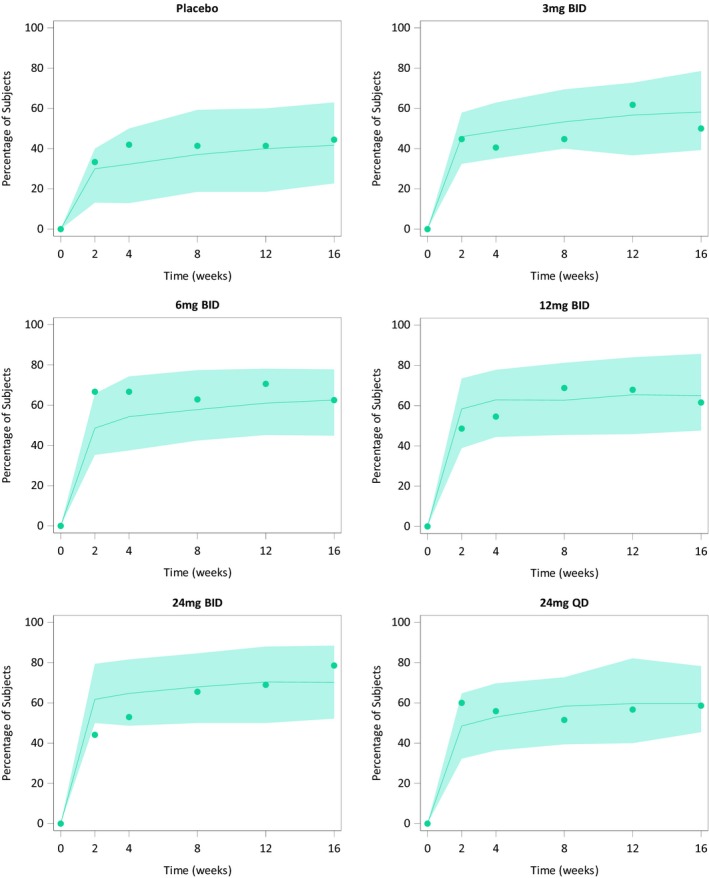
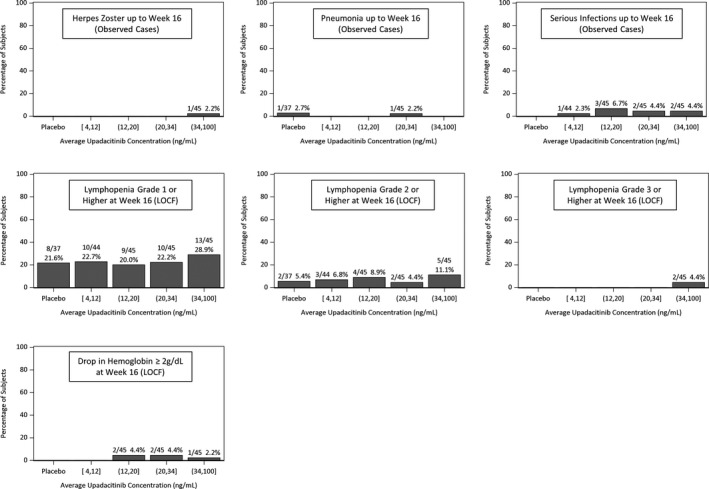
Upadacitinib plasma concentrations, efficacy, and safety data from 216 subjects with moderate-to-severe active Crohn's disease (CD) from the 16-week induction period of the CELEST study were analyzed to characterize upadacitinib exposure-response relationships in CD. Subjects in CELEST received either placebo or upadacitinib (3, 6, 12, 24 mg b.i.d. or 24 mg q.d.). Exposure-response models were developed and utilized to simulate efficacy of induction doses of the immediate-release (IR) and extended-release (ER) formulations. Upadacitinib exposures associated with 18-24 mg b.i.d. (IR formulation) or 45-60 mg q.d. (ER formulation) are estimated to have greater efficacy during 12-week induction in patients with CD compared with lower doses. No exposure-response relations were observed with decreases in hemoglobin or lymphocytes at week 16 or with herpes zoster infections, pneumonia, or serious infections during 16 weeks of treatment in this study. These analyses informed the selection of upadacitinib induction dose for phase III studies in CD.
© 2019 AbbVie Inc. Clinical Pharmacology & Therapeutics published by Wiley Periodicals, Inc. on behalf of American Society for Clinical Pharmacology and Therapeutics.
Conflict of interest statement
Mohamed‐Eslam F. Mohamed, Ben Klünder, Ana P. Lacerda, and Ahmed A. Othman are employees and shareholders of AbbVie.
Figures


References
-
- Eustace, G.J. & Melmed, G.Y. Therapy for Crohn's disease: a review of recent developments. Curr. Gastroenterol. Rep. 20, 19 (2018). - PubMed
-
- Cholapranee, A. , Hazlewood, G.S. , Kaplan, G.G. , Peyrin‐Biroulet, L. & Ananthakrishnan, A.N. Systematic review with meta‐analysis: comparative efficacy of biologics for induction and maintenance of mucosal healing in Crohn's disease and ulcerative colitis controlled trials. Aliment. Pharmacol. Ther. 45, 1291–1302 (2017). - PMC - PubMed
-
- Ma, C. et al Heterogeneity in definitions of efficacy and safety endpoints for clinical trials of Crohn's disease: a systematic review for development of a core outcome set. Clin. Gastroenterol. Hepatol. 16, 1407–1419 (2018). - PubMed
-
- Danese, S. , Fiorino, G. & Peyrin‐Biroulet, L. Early intervention in Crohn's disease: towards disease modification trials. Gut 66, 2179–2187 (2017). - PubMed
-
- Bouguen, G. & Peyrin‐Biroulet, L. Surgery for adult Crohn's disease: what is the actual risk? Gut 60, 1178–1181 (2011). - PubMed
Publication types
MeSH terms
Substances
LinkOut - more resources
Full Text Sources
Other Literature Sources
Medical
