Early-life DNA methylation profiles are indicative of age-related transcriptome changes
- PMID: 31594536
- PMCID: PMC6781367
- DOI: 10.1186/s13072-019-0306-5
Early-life DNA methylation profiles are indicative of age-related transcriptome changes
Abstract
Background: Alterations to cellular and molecular programs with brain aging result in cognitive impairment and susceptibility to neurodegenerative disease. Changes in DNA methylation patterns, an epigenetic modification required for various CNS functions are observed with brain aging and can be prevented by anti-aging interventions, but the relationship of altered methylation to gene expression is poorly understood.
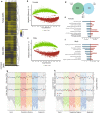
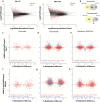
Results: Paired analysis of the hippocampal methylome and transcriptome with aging of male and female mice demonstrates that age-related differences in methylation and gene expression are anti-correlated within gene bodies and enhancers. Altered promoter methylation with aging was found to be generally un-related to altered gene expression. A more striking relationship was found between methylation levels at young age and differential gene expression with aging. Highly methylated gene bodies and promoters in early life were associated with age-related increases in gene expression even in the absence of significant methylation changes with aging. As well, low levels of methylation in early life were correlated to decreased expression with aging. This relationship was also observed in genes altered in two mouse Alzheimer's models.
Conclusion: DNA methylation patterns established in youth, in combination with other epigenetic marks, were able to accurately predict changes in transcript trajectories with aging. These findings are consistent with the developmental origins of disease hypothesis and indicate that epigenetic variability in early life may explain differences in aging trajectories and age-related disease.
Keywords: Aging; DNA methylation; Epigenetics; Gene regulation; Hippocampus.
Conflict of interest statement
The authors declare that they have no competing interests.
Figures


Similar articles
-
Caloric restriction mitigates age-associated hippocampal differential CG and non-CG methylation.Neurobiol Aging. 2018 Jul;67:53-66. doi: 10.1016/j.neurobiolaging.2018.03.009. Epub 2018 Mar 16. Neurobiol Aging. 2018. PMID: 29631215 Free PMC article.
-
Correlated 5-Hydroxymethylcytosine (5hmC) and Gene Expression Profiles Underpin Gene and Organ-Specific Epigenetic Regulation in Adult Mouse Brain and Liver.PLoS One. 2017 Jan 26;12(1):e0170779. doi: 10.1371/journal.pone.0170779. eCollection 2017. PLoS One. 2017. PMID: 28125731 Free PMC article.
-
Genome-wide DNA methylome variation in two genetically distinct chicken lines using MethylC-seq.BMC Genomics. 2015 Oct 23;16:851. doi: 10.1186/s12864-015-2098-8. BMC Genomics. 2015. PMID: 26497311 Free PMC article.
-
A concise review of human brain methylome during aging and neurodegenerative diseases.BMB Rep. 2019 Oct;52(10):577-588. doi: 10.5483/BMBRep.2019.52.10.215. BMB Rep. 2019. PMID: 31462381 Free PMC article. Review.
-
DNA methylation and healthy human aging.Aging Cell. 2015 Dec;14(6):924-32. doi: 10.1111/acel.12349. Epub 2015 Apr 25. Aging Cell. 2015. PMID: 25913071 Free PMC article. Review.
Cited by
-
Hippocampal and cortical tissue-specific epigenetic clocks indicate an increased epigenetic age in a mouse model for Alzheimer's disease.Aging (Albany NY). 2020 Oct 20;12(20):20817-20834. doi: 10.18632/aging.104056. Epub 2020 Oct 20. Aging (Albany NY). 2020. PMID: 33082299 Free PMC article.
-
Targeted methods for epigenetic age predictions in mice.Sci Rep. 2020 Dec 31;10(1):22439. doi: 10.1038/s41598-020-79509-2. Sci Rep. 2020. PMID: 33384442 Free PMC article.
-
Health benefits attributed to 17α-estradiol, a lifespan-extending compound, are mediated through estrogen receptor α.Elife. 2020 Dec 8;9:e59616. doi: 10.7554/eLife.59616. Elife. 2020. PMID: 33289482 Free PMC article.
-
Molecular Regulation of Fetal Brain Development in Inbred and Congenic Mouse Strains Differing in Longevity.Genes (Basel). 2024 May 9;15(5):604. doi: 10.3390/genes15050604. Genes (Basel). 2024. PMID: 38790233 Free PMC article.
-
Losing DNA methylation at repetitive elements and breaking bad.Epigenetics Chromatin. 2021 Jun 3;14(1):25. doi: 10.1186/s13072-021-00400-z. Epigenetics Chromatin. 2021. PMID: 34082816 Free PMC article. Review.
References
Publication types
MeSH terms
Grants and funding
- R56AG059430/AG/NIA NIH HHS/United States
- T32 AG052363/AG/NIA NIH HHS/United States
- R01AG0256161/AG/NIA NIH HHS/United States
- P30 AG050911/AG/NIA NIH HHS/United States
- R01 AG059430/AG/NIA NIH HHS/United States
- T32AG052363/National Institute on Aging (US)/International
- I01BX003906/U.S. Department of Veterans Affairs/International
- R56 AG059430/AG/NIA NIH HHS/United States
- P30AG050911/AG/NIA NIH HHS/United States
- P20GM125528/GM/NIGMS NIH HHS/United States
- I01 BX003906/BX/BLRD VA/United States
- P20 GM125528/GM/NIGMS NIH HHS/United States
LinkOut - more resources
Full Text Sources
Medical
Research Materials

