. 2019 Oct 8;12(1):59.
doi: 10.1186/s13072-019-0302-9.

DNA methylation modifier LSH inhibits p53 ubiquitination and transactivates p53 to promote lipid metabolism

Affiliations

DNA methylation modifier LSH inhibits p53 ubiquitination and transactivates p53 to promote lipid metabolism

Ling Chen et al. Epigenetics Chromatin. .

Abstract

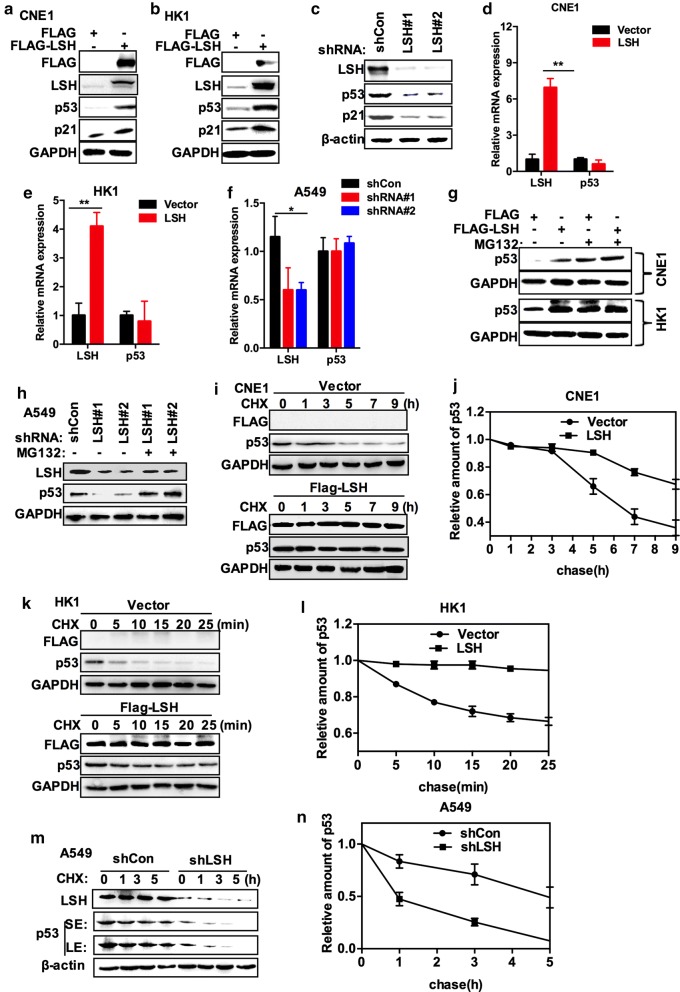
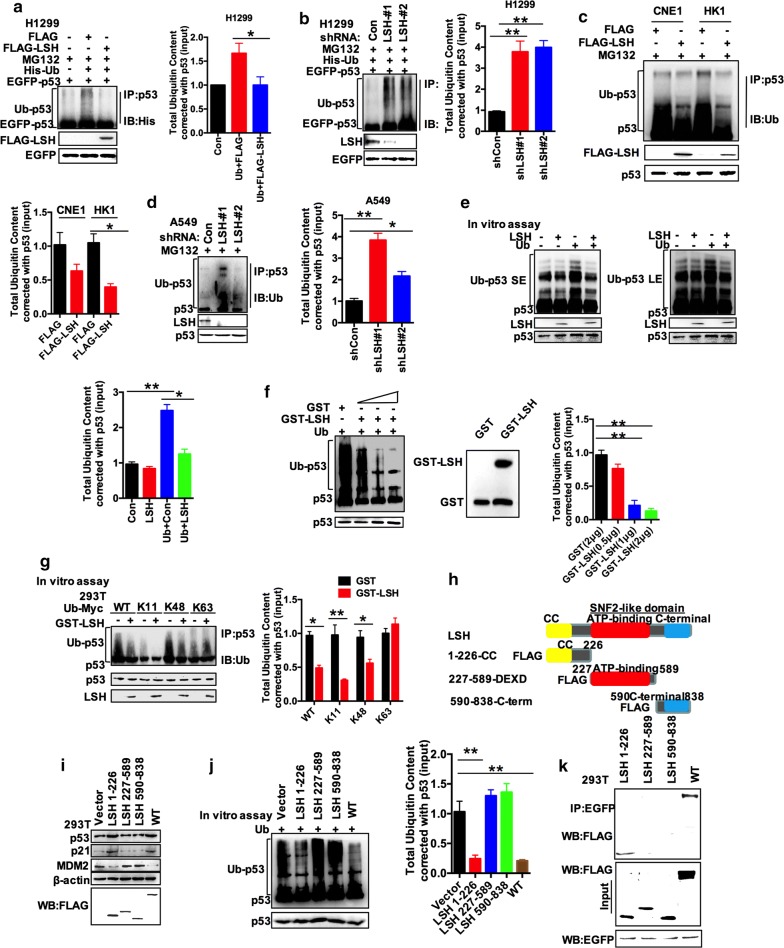
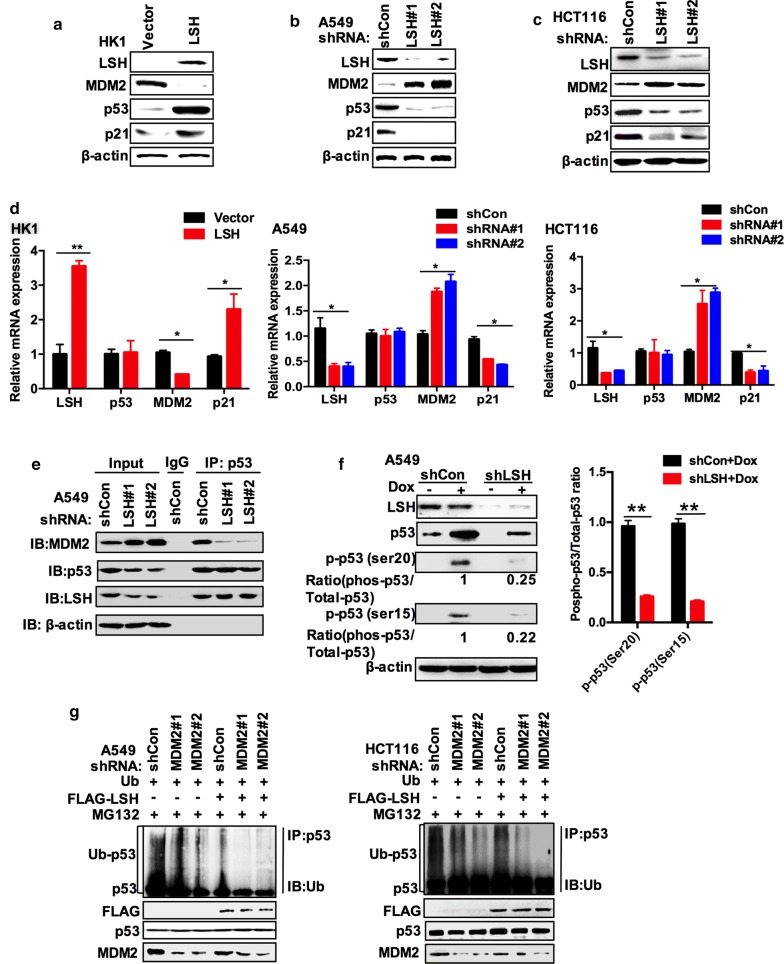
Background: The stability of p53 is mainly controlled by ubiquitin-dependent degradation, which is triggered by the E3 ubiquitin ligase MDM2. The chromatin modifier lymphoid-specific helicase (LSH) is essential for DNA methylation and cancer progression as a transcriptional repressor. The potential interplay between chromatin modifiers and transcription factors remains largely unknown.

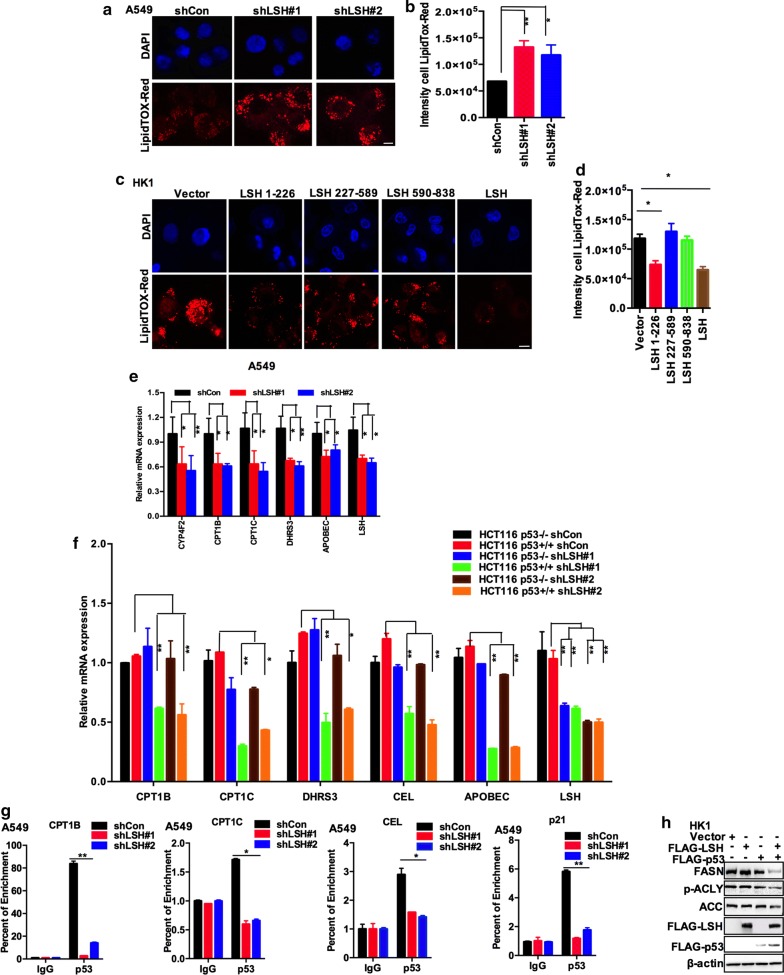
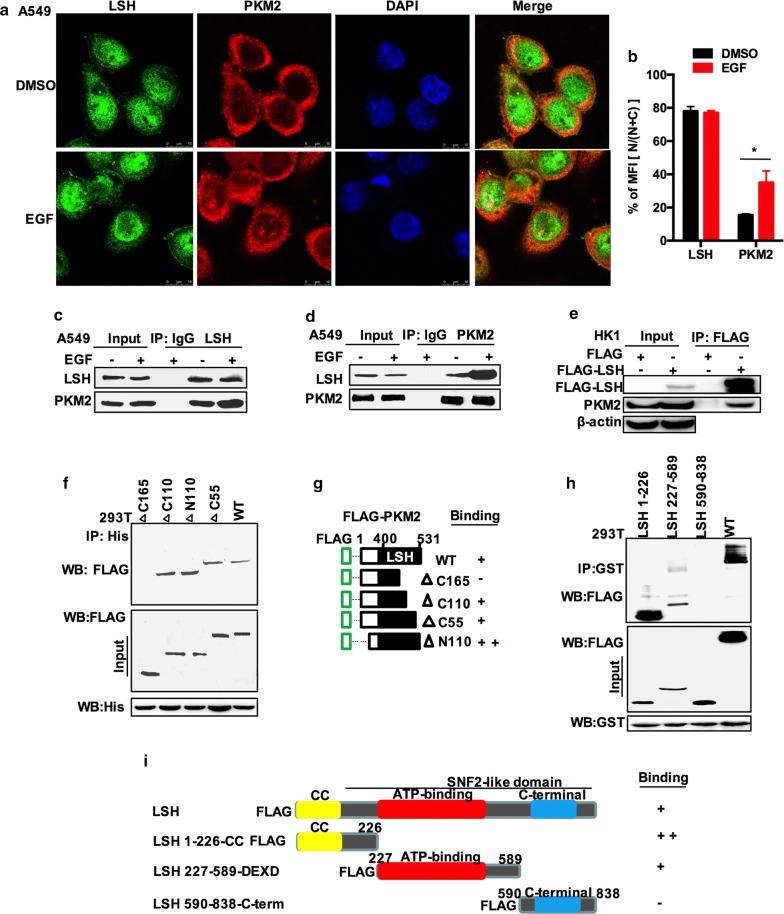
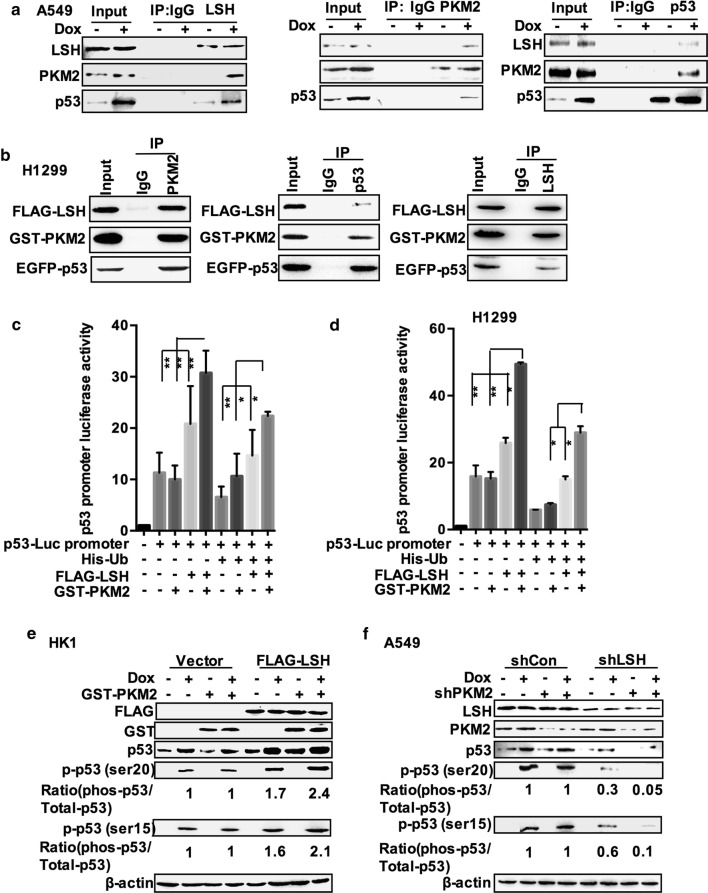
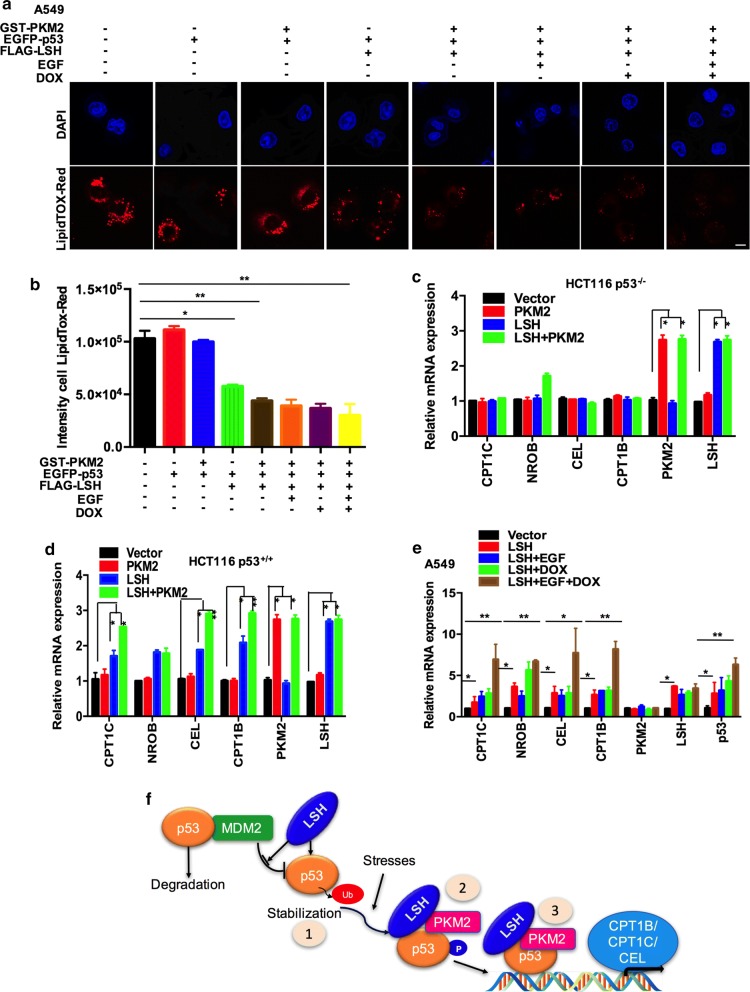
Results: Here, we present data suggesting that LSH regulates p53 in cis through two pathways: prevention proteasomal degradation through its deubiquitination, which is achieved by reducing the lysine 11-linked, lysine 48-linked polyubiquitin chains (K11 and K48) on p53; and revival of the transcriptional activity of p53 by forming a complex with PKM2 (pyruvate kinase 2). Furthermore, we confirmed that the LSH-PKM2 interaction occurred at the intersubunit interface region of the PKM2 C-terminal region and the coiled-coil domains (CC) and ATP-binding domains of LSH, and this interaction regulated p53-mediated transactivation in cis in lipid metabolism, especially lipid catabolism.

Conclusion: These findings suggest that LSH is a novel regulator of p53 through the proteasomal pathway, thereby providing an alternative mechanism of p53 involvement in lipid metabolism in cancer.

Keywords: DUB; LSH; Lipid metabolism; P53; PKM2.


Conflict of interest statement

The authors declare that they have no competing interests.

Figures

Fig. 1
Fig. 1
LSH stabilizes p53. a Endogenous p53 and p21 were detected by Western blotting in CNE1 cells in which LSH or the corresponding vector control was overexpressed. Cell lysates were blotted with the indicated antibodies. Representative images from three independent experiments are presented. b Endogenous p53 and p21 were detected by Western blotting in HK1 cells in which LSH or the corresponding vector control was overexpressed. Cell lysates were blotted with the indicated antibodies. p21 is a p53 target gene. Representative images from three independent experiments are presented. c A549 cell lysates stably expressing LSH shRNA#1, shRNA#2, or control shRNA were blotted with the indicated antibodies. Representative images from three independent experiments are presented. d Overexpression of LSH in CNE1 cell lines has no effect on p53 messenger RNA (mRNA) levels. p53 and LSH mRNA levels were detected by real-time PCR. Statistical analysis was performed using Student’s t test. *P < 0.05; **P < 0.01. Error bars represent the SEM of triplicate experiments. e Overexpression of LSH in HK1 cell lines has no effect on p53 messenger RNA (mRNA) levels. p53 and LSH mRNA levels were detected by real-time PCR. Statistical analysis was performed using Student’s t test. *P < 0.05; **P < 0.01. Error bars represent the SEM of triplicate experiments. f Downregulation of LSH in A549 cell lines has no effect on p53 messenger RNA (mRNA) levels. p53 and LSH mRNA levels were detected by real-time PCR. Statistical analysis was performed using Student’s t test. *P < 0.05; **P < 0.01. Error bars represent the SEM of triplicate experiments. g CNE1 and HK1 cells in which LSH or the corresponding vector control was overexpressed were treated with the proteasome-dependent inhibitor MG132 at 50 μM for 6 h. Next, the cell lysates were blotted with the indicated antibodies. Representative images from three independent experiments are presented. h A549 cells that overexpressed LSH shRNA#1, LSH shRNA#2, or control shRNA were treated with or without the proteasome-dependent inhibitor MG132 at 50 μM for 6 h. Next, the cell lysates were blotted with the indicated antibodies. Representative images from three independent experiments are presented. i, j LSH increases p53 stability. CNE1 cells stably overexpressing LSH or the corresponding vector control were treated with cycloheximide (0.1 mg/ml) and harvested at the indicated times. The left panels show immunoblots of p53 and LSH. The right panel shows quantification of p53 protein levels relative to GAPDH. Representative images from three independent experiments are presented. k, l LSH increases p53 stability. HK1 cells in which LSH or the corresponding vector control were stably overexpressed were treated with cycloheximide (0.1 mg/ml) and harvested at the indicated times. The left panels show immunoblots of p53 and LSH. The right panel shows quantification of p53 protein levels relative to GAPDH. Representative images from three independent experiments are presented. m, n shRNA LSH decreases p53 stability. A549 cells stably expressing shCon or LSH shRNA were treated with cycloheximide (0.1 mg/ml) and harvested at the indicated times. The left panels show immunoblots of p53 and LSH. (SE, short exposure; LE, long exposure.) The right panel shows quantification of p53 protein levels relative to β-actin. Representative images from three independent experiments are presented. j, l, and n Error bars represent the SEM of triplicate experiments
Fig. 2
Fig. 2
p53 is less ubiquitinated in the presence of LSH. a, b Regulation of exogenous p53 ubiquitination levels by LSH. H1299 cells were transfected with the indicated constructs and treated with 50 μM MG132 for 4 h. EGFP-p53 was immunoprecipitated with anti-EGFP polyclonal antibodies and immunoblotted with monoclonal anti-p53 (DO-1) antibodies or anti-His antibodies. Densitometry analysis of total ubiquitinated protein content. N = 3, *P < 0.05; **P < 0.01. c Regulation of endogenous p53 ubiquitination levels by LSH. CNE1 and HK1 cells stably expressing vector or LSH were treated with 50 μM MG132 for 4 h, and the cell lysates were immunoprecipitated with anti-p53 polyclonal antibodies and immunoblotted with monoclonal anti-p53 (DO-1) antibodies or anti-Ub antibodies. Densitometry analysis of total ubiquitinated protein content. N = 3, *P < 0.05; **P < 0.01. d Regulation of endogenous p53 ubiquitination levels by LSH. A549 cells stably expressing shControl or LSH shRNA were treated with 50 μM MG132 for 4 h, and cell lysates were immunoprecipitated with anti-p53 polyclonal antibodies and immunoblotted with monoclonal anti-p53 (DO-1) antibody or anti-Ub antibody. Densitometry analysis of total ubiquitinated protein content. N = 3, *P < 0.05; **P < 0.01. e Deubiquitination of p53 in vitro by LSH. Ubiquitinated p53 was incubated with or without purified LSH for 2 h. Reactions were stopped by the addition of SDS-PAGE loading buffer and then blotted with anti-p53 and anti-Ub antibodies (SE, short exposure; LE, long exposure). Densitometry analysis of total ubiquitinated protein content. N = 3, *P < 0.05; **P < 0.01. f LSH cleaves ubiquitinated p53 in vitro. Ubiquitinated p53 was incubated with purified LSH expressed in BL21 cells at 0.0, 0.5, 1, or 2 μg in vitro and then blotted with anti-p53 and anti-Ub antibodies or GST antibody. The protein of purified LSH at was separated by SDS-PAGE. Densitometry analysis of total ubiquitinated protein content. N = 3, *P < 0.05; **P < 0.01. g Deubiquitination of p53 in vitro by LSH truncations. HEK293T cells were transfected with K11, K48, and K63 constructs to form ubiquitin chains, and Ubiquitinated p53 was incubated with or without purified GST-LSH in vitro and then blotted with anti-p53 and anti-Ub antibodies. Densitometry analysis of total ubiquitinated protein content. N = 3, *P < 0.05; **P < 0.01. h Structure of LSH and the three FLAG-LSH constructs used for mapping. i HEK293T cells overexpressing LSH-FLAG or LSH truncations. Endogenous p53, p21, and MDM2 levels were detected using the indicated antibodies. Representative images from three independent experiments are presented. j Deubiquitination of p53 in vitro by LSH truncations. Ubiquitinated p53 was incubated with or without purified LSH truncation mutants in vitro and then blotted with anti-p53 and anti-Ub antibodies. Densitometry analysis of total ubiquitinated protein content. N = 3, *P < 0.05; **P < 0.01. k Determination of the minimal LSH-p53 interaction region. Co-IP assays were performed with an anti-EGFP antibody in HEK293T cells transfected with EGFP-p53 plus one of a series of N-terminal or C-terminal FLAG-LSH mutants. Representative images from three independent experiments are presented
Fig. 3
Fig. 3
LSH stabilizes p53 protein levels by disrupting the interaction between p53 and MDM2. a LSH affects MDM2 protein levels. Cell lysates were immunoblotted with monoclonal anti-MDM2 in HK1 cells stably expressing vector or LSH. Representative images from three independent experiments are presented. b LSH affects MDM2 protein levels. Cell lysates were immunoblotted with monoclonal anti-MDM2 in A549 cells stably expressing shControl or shRNA LSH. Representative images from three independent experiments are presented. c LSH affects MDM2 protein levels. Cell lysates were immunoblotted with monoclonal anti-MDM2 in HCT116 cells stably expressing shControl or shRNA LSH. Representative images from three independent experiments are presented. d LSH impacts MDM2 mRNA levels. LSH, MDM2, p53, and p21 mRNA levels were detected by real-time PCR in HK1 cells stably overexpressing FLAG-LSH or vector control and A549 cells stably overexpressed LSH shRNA or control shRNA. Error bars represent the SEM of triplicate experiments. Statistical analysis was performed using Student’s t test. *P < 0.05; **P < 0.01. e A549 cells stably expressing shCon or LSH shRNA were lysed, and the lysates were incubated with IgG or p53 (DO-1) antibody. Protein adsorbed by magnetic beads was blotted with the indicated antibodies. Representative images from three independent experiments are presented. f A549 cells stably transfected with shCon or LSH shRNA were treated with or without doxorubicin (DOX, 1 μM). After 24 h, the cells were harvested and analysed by immunoblotting. The number indicates the ratio of phosphorylated p53 (Ser15) and phosphorylated p53 (Ser20) to the corresponding total p53 protein in the doxorubicin-treated experiments (control set to 1). Quantitation of the intensity of the phosphorylation p53 and total p53 signals is shown in the left panel. N = 3, *P < 0.05; **P < 0.01. g A549 and HCT116 cells transiently overexpressing shCon, MDM2 shRNA, and His-Ub were treated with 50 μM MG132 for 4 h, and then, cell lysates were immunoprecipitated with anti-p53 polyclonal antibodies and immunoblotted with monoclonal anti-p53 (DO-1) antibody or anti-Ub antibody. Representative images from three independent experiments are presented
Fig. 4
Fig. 4
LSH is required for p53-mediated lipid metabolism. a A549 cells stably expressing shCon or LSH shRNA were seeded on glass coverslips overnight, and the cells were fixed and stained with red neutral lipid stain. Representative images from three independent experiments are presented (scale bars, 10 μm). b ImageJ was used to analyse the intensity of LipidTox-Red staining. Statistical analysis was performed using Student’s t test. *P < 0.05; **P < 0.01. Error bars represent the SEM of triplicate experiments. c HK1 cells stably expressing Vector, LSH truncations, or LSH were seeded on glass coverslips overnight, and the cells were fixed and stained with red neutral lipid stain. Representative images from three independent experiments are presented (scale bars, 10 μm). d ImageJ was used to analyse the intensity of LipidTox-Red staining. Statistical analysis was performed using Student’s t test. *P < 0.05; **P < 0.01. Error bars represent the SEM of triplicate experiments. e Alterations in lipid metabolism genes were observed in A549 cells stably expressing shCon or LSH shRNA. Cells were harvested and the indicated mRNA levels were determined by real-time PCR. Statistical analysis was performed using Student’s t test. *P < 0.05; **P < 0.01. Error bars represent the SEM of triplicate experiments. f Alterations in lipid metabolism genes were observed in HCT116 p53−/− and HCT116 p53+/+ cells transiently expressing shCon or LSH shRNA. Cells were harvested, and the indicated mRNA levels were determined by real-time PCR. Statistical analysis was performed using Student’s t test. *P < 0.05; **P < 0.01. Error bars represent the SEM of triplicate experiments. g ChIP analysis of p53 target genes in A549 cells transiently depleted of LSH. The enrichment of p53 was assessed using CPT1B, CPT1C, CEL and p21 primers spanning the genomic regions around the TSS. IgG served as an antibody control and p21 as a positive control. Statistical analysis was performed using Student’s t test. *P < 0.05; **P < 0.01. Error bars represent the SEM of triplicate experiments. h Effects of transient overexpression of LSH and p53 in HK1 cells determined by Western blotting for FASN, ACC, and p-ACLY. Representative images from three independent experiments are presented
Fig. 5
Fig. 5
LSH is a novel PKM2-interacting protein. a A549 cells were treated with 100 ng/ml EGF or untreated for 6 h, stained with anti-LSH and PKM2 antibodies and subsequently visualized by confocal microscopy. The subcellular localizations of LSH and PKM2 were detected by immunochemistry using the indicated antibodies (scale bars, 10 μm). Representative images from three independent experiments are presented. b Analysis of the mean fluorescence intensity of PKM2 in the cytosol and nucleus. Mean values from 12 independent cells from three preparations were determined by the ImageJ. The relative fluorescence intensity in the nucleus is expressed as percentage of MFI [N/(N + C)]. Statistical significance was evaluated using the paired Student t test. *P < 0.05; **P < 0.01. c, d Endogenous PKM2 or LSH was immunoprecipitated from A549 cell lysates and separated by 10% SDS-PAGE followed by Western blotting with anti-PKM2 and LSH antibodies. A549 cells were treated with 100 ng/ml EGF or untreated for 6 h. Representative images from three independent experiments are presented. e FLAG-LSH or control plasmid was stably transfected into HK1 cells. Total protein extracts were incubated with FLAG magnetic beads and subsequently separated by SDS-PAGE followed by Western blotting with an anti-FLAG, PKM2, or β-actin antibody. Representative images from three independent experiments are presented. f, g) Determination of the minimal PKM2–LSH interaction region. Co-IP assays were performed with an anti-His antibody in HEK293T cells transfected with His-LSH plus one of a series of N-terminal or C-terminal FLAG-PKM2 mutants. Schematic of PKM2 and the four FLAG PKM2 constructs used for the mapping. Representative images from three independent experiments are presented. h, j Determination of the minimal PKM2–LSH interaction region. Co-IP assays were performed with an anti-GST antibody in HEK293T cells transfected with GST-PKM2 plus one of a series of N-terminal or C-terminal FLAG-LSH mutants. Schematic of LSH and the three FLAG LSH constructs used for the mapping. Representative images from three independent experiments are presented
Fig. 6
Fig. 6
LSH and PKM2 activate p53 transcriptional activity to support cell lipid catabolism. a Endogenous PKM2, p53, or LSH were immunoprecipitated from A549 cell lysates treated with 1 μM doxorubicin or untreated for 24 h, and cells were further treated with 100 ng/ml EGF or untreated for 6 h and separated by 10% SDS-PAGE, followed by Western blotting with anti-PKM2, p53 and LSH antibodies. Representative images from three independent experiments are presented. b H1299 cells were treated with 100 ng/ml EGF for 6 h after exogenous PKM2, p53, or LSH was transiently transfected with the corresponding constructs and immunoprecipitated using the indicated antibodies. Representative images from three independent experiments are presented. c HEK293T cells were transiently transfected with p53-Luc promoter plasmid along with vector, EGFP-p53, or GST-PKM2 expression plasmid. After 48 h, the cells were harvested, and p53 luciferase activity was measured (n = 3). Statistical analysis was performed using Student’s t test. *P < 0.05; **P < 0.01. d H1299 cells were transiently transfected with p53-Luc promoter plasmid along with vector, EGFP-p53, or GST-PKM2 expression plasmid. After 48 h, the cells were harvested, and p53 luciferase activity was measured (n = 3). Statistical analysis was performed using Student’s t test. *P < 0.05; **P < 0.01. e HK1 cells stably transfected with vector or FLAG-LSH were treated with or without doxorubicin (DOX, 1 μM) for 24 h. The cells were transiently transfected with GST-PKM2 or vector for 48 h. After that, the cells were harvested and analysed by immunoblotting. The number indicates the ratio of phosphorylated p53 (Ser15) and phosphorylated p53 (Ser20) to the corresponding total p53 protein in the doxorubicin-treated experiments (control set to 1). Representative images from three independent experiments are presented. f A549 cells stably transfected with shCon or LSH shRNA were treated with or without doxorubicin (DOX, 1 μM). The cells were transiently transfected with PKM2 shRNA or control shRNA for 48 h. After that, the cells were harvested and analysed by immunoblotting. The number indicates the ratio of phosphorylated p53 (Ser15) and phosphorylated p53 (Ser20) to the corresponding total p53 protein in the doxorubicin-treated experiments (control set to 1). Representative images from three independent experiments are presented
Fig. 7
Fig. 7
LSH, PKM2, and p53 promote cell lipid catabolism. a A549 cells transiently expressing the indicated constructs were seeded on glass coverslips overnight, and the cells were fixed and stained with red neutral lipid stain. Representative images from three independent experiments are presented (scale bars, 10 μm). Cells were treated with or without doxorubicin (DOX, 1 μM) and with or without 100 ng/ml EGF or untreated for 6 h. b ImageJ was used to analyse the intensity of LipidTox-Red staining. Statistical analysis was performed using Student’s t test. *P < 0.05; **P < 0.01 (n = 3). Error bars represent the SEM of triplicate experiments. c, d After the indicated constructs were overexpressed for 48 h, alterations in lipid metabolism genes were observed in HCT116 p53−/− and HCT116 p53+/+ cells. Cells were harvested, and the indicated mRNA levels were determined by real-time PCR. Statistical analysis was performed using Student’s t test. *P < 0.05; **P < 0.01. Error bars represent the SEM of triplicate experiments. e After the indicated constructs were overexpressed for 48 h, alterations in lipid metabolism genes were observed in A549 cells. Cells were harvested, and the indicated mRNA levels were determined by real-time PCR. Cells were treated with or without doxorubicin (DOX, 1 μM) and with or without 100 ng/ml EGF or untreated for 6 h. Statistical analysis was performed using Student’s t test. *P < 0.05; **P < 0.01. Error bars represent the SEM of triplicate experiments. f The working model of p53 regulation by LSH comprises three sequential activating steps: (1) LSH acts as a novel positive regulator of p53 stability by releasing MDM2 from p53 and inhibiting p53 ubiquitination and stabilization. (2) p53 is stress-induced to form a complex with PKM2 and LSH to promote its stabilization, which is mediated by phosphorylation (P). (3) p53 phosphorylation stabilizes p53 and DNA-bound p53 and then recruits transcriptional machinery to activate the transcription of p53 target lipid catabolism genes

Similar articles

Cited by

References

    1. Prokesch A, Graef FA, Madl T, Kahlhofer J, Heidenreich S, Schumann A, Moyschewitz E, Pristoynik P, Blaschitz A, Knauer M, et al. Liver p53 is stabilized upon starvation and required for amino acid catabolism and gluconeogenesis. FASEB J. 2016;31(2):732–742. doi: 10.1096/fj.201600845R. - DOI - PMC - PubMed
    1. Liu Y, He Y, Jin A, Tikunov AP, Zhou L, Tollini LA, Leslie P, Kim TH, Li LO, Coleman RA, et al. Ribosomal protein-Mdm2-p53 pathway coordinates nutrient stress with lipid metabolism by regulating MCD and promoting fatty acid oxidation. Proc Natl Acad Sci USA. 2014;111(23):E2414–E2422. doi: 10.1073/pnas.1315605111. - DOI - PMC - PubMed
    1. Marton J, Peter M, Balogh G, Bodi B, Vida A, Szanto M, Bojcsuk D, Janko L, Bhattoa HP, Gombos I, et al. Poly(ADP-ribose) polymerase-2 is a lipid-modulated modulator of muscular lipid homeostasis. Biochim Biophys Acta. 2018;1863(11):1399–1412. doi: 10.1016/j.bbalip.2018.07.013. - DOI - PubMed
    1. Parrales A, Iwakuma T. p53 as a regulator of lipid metabolism in cancer. Int J Mol Sci. 2016;17(12):2074. doi: 10.3390/ijms17122074. - DOI - PMC - PubMed
    1. Goldstein I, Ezra O, Rivlin N, Molchadsky A, Madar S, Goldfinger N, Rotter V. p53, a novel regulator of lipid metabolism pathways. J Hepatol. 2012;56(3):656–662. doi: 10.1016/j.jhep.2011.08.022. - DOI - PubMed

Publication types

MeSH terms