. 2019 Oct 22;116(43):21634-21640.
doi: 10.1073/pnas.1909216116. Epub 2019 Oct 8.

Fitness effects but no temperature-mediated balancing selection at the polymorphic Adh gene of Drosophila melanogaster

Affiliations

Fitness effects but no temperature-mediated balancing selection at the polymorphic Adh gene of Drosophila melanogaster

Mohammad A Siddiq et al. Proc Natl Acad Sci U S A. .

Abstract

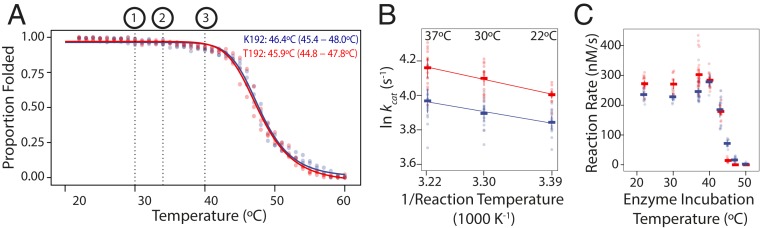
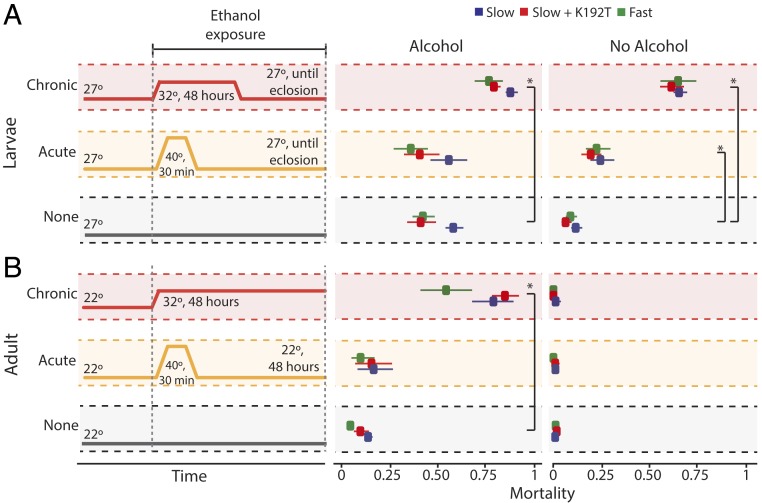
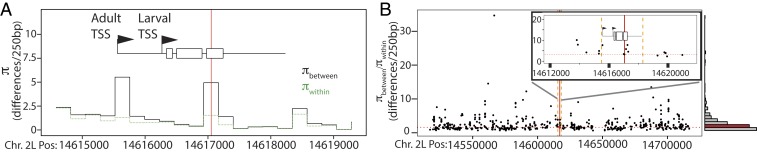
Polymorphism in the alcohol dehydrogenase (ADH) protein of Drosophila melanogaster, like genetic variation in many other enzymes, has long been hypothesized to be maintained by a selective trade-off between thermostability and enzyme activity. Two major Adh variants, named Fast and Slow, are distributed along latitudinal clines on several continents. The balancing selection trade-off hypothesis posits that Fast is favored at high latitudes because it metabolizes alcohol faster, whereas Slow is favored at low latitudes because it is more stable at high temperatures. Here we use biochemical and physiological assays of precisely engineered genetic variants to directly test this hypothesis. As predicted, the Fast protein has higher catalytic activity than Slow, and both the Fast protein and regulatory variants linked to it confer greater ethanol tolerance on transgenic animals. But we found no evidence of a temperature-mediated trade-off: The Fast protein is not less stable or active at high temperatures, and Fast alleles increase ethanol tolerance and survivorship at all temperatures tested. Further, analysis of a population genomic dataset reveals no signature of balancing selection in the Adh gene. These results provide strong evidence against balancing selection driven by a stability/activity trade-off in Adh, and they justify caution about this hypothesis for other enzymes except those for which it has been directly tested. Our findings tentatively suggest that environment-specific selection for the Fast allele, coupled with demographic history, may have produced the observed pattern of Adh variation.

Keywords: activity/stability trade-off; adaptation; alcohol physiology; evolutionary biochemistry; evolutionary genetics.


Conflict of interest statement

The authors declare no competing interest.

Figures

Fig. 1.
Fig. 1.
Effect of K192T on ADH thermal stability and catalytic activity in vitro. (A) CD measurements of the proportion of folded protein across a temperature gradient for heterologously expressed ADH proteins containing K192 (blue) or T192 (red). Each circle shows one of 3 replicate measurements; solid lines, best-fit curves. Temperature at which 50% of secondary structure is lost (Tm) is listed, with 95% confidence interval. Dotted lines, temperatures at which the following occur: 1) induction of organismal heat shock response and male sterility, 29 °C to 30 °C; 2) death following chronic exposure, 34 °C to 35 °C; and 3) rapid death/incapacitance, 40 °C. (B) Effect of reaction temperature on maximum catalytic rate per unit enzyme (kcat) at saturating ethanol and cofactor concentrations. Circles show replicate measurements; horizontal bars show mean with 95% confidence interval. The reaction mixture including enzyme was incubated and reaction rates were measured at the temperature listed. Solid line, best-fit linear regression using expected Arrhenius relationship between reaction rate and temperature. There is a significant effect of temperature (F test, P < 0.01) and genotype (P < 0.01), but no genotype−temperature interaction (P = 0.46). (C) Effect of enzyme heat stress on maximal catalytic rate at saturating concentrations; 500 nM enzyme was incubated for 1 h at the temperature plotted; reaction mixture was then added and rate was measured at 22 °C.
Fig. 2.
Fig. 2.
Effect of temperature and Adh genotype on ethanol tolerance in transgenic flies. Adh-null strains were transformed with a naturally occurring Slow allele (blue), the Slow allele modified with mutation K192T (red), or a naturally occurring Fast allele containing T192 and linked polymorphisms (green). Larvae (A and B) and adult females (C and D) were assayed for survival in the presence of increasing ethanol concentrations at different temperatures. Circles and error bars show the mean and SEM of the fraction of individuals dead in each treatment. For larvae, survival until eclosion was measured in 8 to 10 replicates of 30 larvae each per treatment; for adults, survival after 48 h of exposure was measured in 4 to 8 replicates of 25 to 30 individuals each per treatment. For each genotype, the LD50 is shown, with SE. Asterisks, significant differences between genotypes (P < 0.05, Wald’s test).
Fig. 3.
Fig. 3.
Effect of heat stress and Adh genotype on ethanol tolerance in transgenic flies. Transgenic (A) larvae and (B) adults were subject to chronic or acute heat stress in the presence or absence of alcohol. (Left) Schematic of treatments. For larvae, 8.5% ethanol exposure was initiated at late second or early third instar and continued through heat treatment until eclosion, when survivorship was measured. For adults, 5% ethanol exposure was continued through 48 h of heat treatment. (Right) Fraction dead at measurement in each group. Points and error bars, mean and 95% CI of 8 to 10 replicates of 30 larvae or 25 to 30 adults each. Asterisks, increased mortality compared to no-heat-stress control (P < 0.01, Wald’s test).
Fig. 4.
Fig. 4.
Genetic variation near Adh. (A) Within- and between-class nucleotide diversity when D. melanogaster haplotypes from Raleigh, NC, are classified by the amino acid at site 192. For each 250-bp window across the locus, the mean nucleotide difference over all pairs of sequences within each class (πwithin, green) and between classes (πbetween, black) is shown. Red line, K192T; rectangles, Adh exons; arrows, transcription start sites (TSS); black line, flanking regions encompassing all known natural cis-regulatory variants (68); SI Appendix, Fig. S4. (B) Distribution of excess πbetweenwithin in the 200-kb region surrounding Adh. Each dot plots one SNP (frequency 0.25 to 0.35); πbetweenwithin in a 250-bp window around it was calculated when haplotypes were classified based on the nucleotide at that site. Red line, K192T; orange, boundaries of Adh locus as in A; histogram, distribution of πbetweenwithin across all SNPs; red bin, K192T. (Inset) Close view of plot across Adh locus.

Similar articles

Cited by

References

    1. Lewontin R. C., The Genetic Basis of Evolutionary Change (Columbia University Press, New York, NY, 1974).
    1. Gillespie J. H., The Causes of Molecular Evolution (Oxford University Press, 1994).
    1. Charlesworth D., Balancing selection and its effects on sequences in nearby genome regions. PLoS Genet. 2, e64 (2006). - PMC - PubMed
    1. Vitti J. J., Grossman S. R., Sabeti P. C., Detecting natural selection in genomic data. Annu. Rev. Genet. 47, 97–120 (2013). - PubMed
    1. Karasov T. L., et al. , The long-term maintenance of a resistance polymorphism through diffuse interactions. Nature 512, 436–440 (2014). - PMC - PubMed

Publication types