. 2019 Nov 15;294(46):17326-17338.
doi: 10.1074/jbc.RA119.010744. Epub 2019 Oct 8.

Glucoselysine is derived from fructose and accumulates in the eye lens of diabetic rats

Affiliations

Glucoselysine is derived from fructose and accumulates in the eye lens of diabetic rats

Rei-Ichi Ohno et al. J Biol Chem. .

Abstract

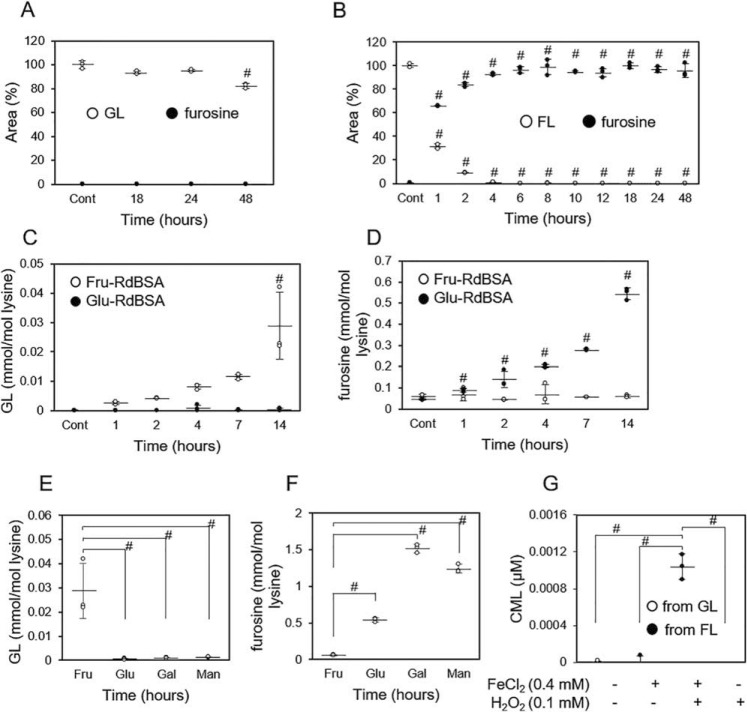
Prolonged hyperglycemia generates advanced glycation end-products (AGEs), which are believed to be involved in the pathogenesis of diabetic complications. In the present study, we developed a polyclonal antibody against fructose-modified proteins (Fru-P antibody) and identified its epitope as glucoselysine (GL) by NMR and LC-electrospray ionization (ESI)- quadrupole TOF (QTOF) analyses and evaluated its potential role in diabetes sequelae. Although the molecular weight of GL was identical to that of fructoselysine (FL), GL was distinguishable from FL because GL was resistant to acid hydrolysis, which converted all of the FLs to furosine. We also detected GL in vitro when reduced BSA was incubated with fructose for 1 day. However, when we incubated reduced BSA with glucose, galactose, or mannose for 14 days, we did not detect GL, suggesting that GL is dominantly generated from fructose. LC-ESI-MS/MS experiments with synthesized [13C6]GL indicated that the GL levels in the rat eye lens time-dependently increase after streptozotocin-induced diabetes. We observed a 31.3-fold increase in GL 8 weeks after the induction compared with nondiabetic rats, and Nϵ-(carboxymethyl)lysine and furosine increased by 1.7- and 21.5-fold, respectively, under the same condition. In contrast, sorbitol in the lens levelled off at 2 weeks after diabetes induction. We conclude that GL may be a useful biological marker to monitor and elucidate the mechanism of protein degeneration during progression of diabetes.

Keywords: AGEs; diabetes; glucoselysine; glycation; lens; mass spectrometry (MS); nuclear magnetic resonance (NMR); polyclonal antibody; polyol pathway; post-translational modification (PTM).


Conflict of interest statement

The authors declare that they have no conflicts of interest with the contents of this article.

Figures

Figure 1.
Figure 1.
Reactivity of Fru-P antibody or CML antibody to the rat lens proteins after the induction of diabetes. Lens proteins (10 μg/lane) were applied to 12% SDS-PAGE and transferred to a polyvinylidene fluoride membrane. The proteins bound to the membrane were detected by Western blot using Fru-P antibody (A) or CML antibody (D) and were quantified by densitometric analysis (B and E). Residual proteins on the polyacrylamide gel after blotting were stained by Coomassie Brilliant Blue as a loading control (C and F). Each well of a 96-well immunoplate was coated with 10 μg/ml of lens protein, and the reactivity of 0.5 μg/ml of Fru-P antibody (G) or CML antibody (H) were visualized by horseradish peroxidase-conjugated anti-rabbit IgG antibody and 1,2-phenylenediamine dihydrochloride as described under “Experimental procedures.” Nor, normal at 8 weeks (n = 3); DM, diabetes at 8 weeks (n = 3). The data are presented as mean ± S.D. #, p < 0.001 versus normal at 8 weeks (Student's t test).
Figure 2.
Figure 2.
Isolation of the epitope structure of the Fru-P antibody. Amino acids producing the epitope were analyzed and the epitope structure was isolated by HPLC. A, each well of a 96-well immunoplate was coated with modified proteins, and the reactivity of Fru-P antibody (0.5 μg/ml) was visualized by horseradish peroxidase-conjugated anti-rabbit IgG antibody and 1,2-phenylenediamine dihydrochloride as described under “Experimental procedures.” B, Fru-BSA (0.01 μg/ml) was coated on the immunoplate and then blocked with gelatin. Fifty microliters of each competitor was added in the presence of the same volume of Fru-P antibody (0.5 μg/ml). The antibody bound to the well was visualized as described above. C, 100 μl of fructose-modified Cbz-lysine (50 mm) was applied to first-step HPLC and separated into four fractions (Fr. 1–4). D, the reactivity of Fru-P antibody with the four isolated fractions was measured by competitive ELISA. E, Fr. 2 obtained from first-step HPLC was further applied to second-step HPLC. F, the reactivity of Fru-P antibody with Fr. 2-1 and 2-2 isolated from the second-step HPLC system was measured by competitive ELISA.
Figure 3.
Figure 3.
NMR analysis of the epitope structure recognized by the Fru-P antibody. NMR spectra of fraction 2-1 shown for (A) 1D 1H, (B) 2D 1H-13C HSQC, (C) 2D 1H-13C HMBC, and (D) 2D 1H-15N HMBC. The assignments are labeled for each peak. E, chemical structure of glucoselysine.
Figure 4.
Figure 4.
Structural analysis by LC-ESI-QTOF. A, ESI-QTOF analysis of fraction 2-1 showing an ion peak at m/z 443.2024 [M + H]+ calculated as C20H30N2O9. B, ESI-QTOF analysis of de-protected fraction 2-1 showing an ion peak at m/z 309.1656 [M + H]+ calculated as C12H25N2O7. C, MS/MS analysis of the de-protected fraction 2-1 of m/z 309.1656 [M + H]+ detected fragment ions are indicated in Table 2.
Figure 5.
Figure 5.
Chemical properties of glucoselysine (GL) and fructoselysine (FL). The stability of GL (A) and FL (B) and formation of furosine under acid hydrolysis under 6 m HCl at 100 °C for 48 h were measured by LC-ESI-QTOF. The formation of GL (C) and furosine (D) during incubation of reduced-BSA (RdBSA) with fructose (Fru) or glucose (Glu) at 37 °C for up to 14 days. Comparison of GL (E) and furosine (F) formation during incubation of RdBSA with Fru, Glu, galactose (Gal), and mannose (Man) at 37 °C for 14 days. G, GL and FL were incubated in 50 mm sodium phosphate buffer (pH 7.2) in the presence or absence of FeCl2 (0.4 mm) and H2O2 (0.1 mm) at 37 °C for 1 h, and CML formation was determined by LC-ESI-QTOF. The data are presented as mean ± S.D. (n = 3). #, p < 0.001 versus control or Fru (Bonferroni test).
Figure 6.
Figure 6.
Quantification of sorbitol, furosine, and CML in the rat lens by LC-ESI-QTOF or LC-ESI-MS/MS. Changes in sorbitol (A), furosine (B), and CML (C) in rat lens proteins were measured by LC-ESI-MS/MS. Nor, normal group (n = 6); DM, diabetic group (n = 6). The data are presented as mean ± S.D. #, p < 0.001, versus normal at 1 week (Bonferroni test). In addition, A, *, p < 0.05, DM at 1 week versus DM 2 weeks. B, #, p <0.001, DM at 1 week versus DM at 2 weeks; DM at 2 weeks versus 4 weeks. C, #, p < 0.001, DM at 2 weeks versus DM at 8 weeks (Bonferroni test).
Figure 7.
Figure 7.
Quantification of GL in the rat lens by LC-ESI-MS/MS. A, typical chromatogram of GL and [13C6]GL in the rat lens obtained by LC-ESI-MS/MS. Changes in GL (B) in rat lens proteins were measured by LC-ESI-MS/MS. The variability in the rate of CML, furosine, and GL are indicated (C). Nor, normal group (n = 6); DM, diabetic group (n = 6). The data are presented as mean ± S.D. †, p < 0.01, versus normal 1 week (Student's t test); #, p < 0.001, versus normal at 1 week (Bonferroni test). In addition, B, #, p < 0.001, DM at 1 week versus DM at 2 weeks; DM at 2 weeks versus DM at 4 weeks; DM at 4 weeks versus DM at 8 weeks (Bonferroni test).

Similar articles

Cited by

References

    1. Wells-Knecht K. J., Brinkmann E., Wells-Knecht M. C., Litchfield J. E., Ahmed M. U., Reddy S., Zyzak D. V., Thorpe S. R., and Baynes J. W. (1996) New biomarkers of Maillard reaction damage to proteins. Nephrol. Dial. Transplant 11, 41–47 10.1093/ndt/11.supp5.41 - DOI - PubMed
    1. Davidson M. B., Schriger D. L., Peters A. L., and Lorber B. (1999) Relationship between fasting plasma glucose and glycosylated hemoglobin: potential for false-positive diagnoses of type 2 diabetes using new diagnostic criteria. JAMA 281, 1203–1210 10.1001/jama.281.13.1203 - DOI - PubMed
    1. Schleicher E. D., Gerbitz K. D., Dolhofer R., Reindl E., Wieland O. H., Edelmann E., Haslbeck M., Kemmler W., Walter H., and Mehnert H. (1984) Clinical utility of nonenzymatically glycosylated blood proteins as an index of glucose control. Diabetes Care 7, 548–556 10.2337/diacare.7.6.548 - DOI - PubMed
    1. Jones I. R., Owens D. R., Williams S., Ryder R. E., Birtwell A. J., Jones M. K., Gicheru K., and Hayes T. M. (1983) Glycosylated serum albumin: an intermediate index of diabetic control. Diabetes Care 6, 501–503 10.2337/diacare.6.5.501 - DOI - PubMed
    1. Zyzak D. V., Richardson J. M., Thorpe S. R., and Baynes J. W. (1995) Formation of reactive intermediates from Amadori compounds under physiological conditions. Arch. Biochem. Biophys. 316, 547–554 10.1006/abbi.1995.1073 - DOI - PubMed