. 2019 Nov 22;294(47):17735-17757.
doi: 10.1074/jbc.RA119.007635. Epub 2019 Oct 8.

Neuronal ER-plasma membrane junctions organized by Kv2-VAP pairing recruit Nir proteins and affect phosphoinositide homeostasis

Affiliations

Neuronal ER-plasma membrane junctions organized by Kv2-VAP pairing recruit Nir proteins and affect phosphoinositide homeostasis

Michael Kirmiz et al. J Biol Chem. .

Abstract

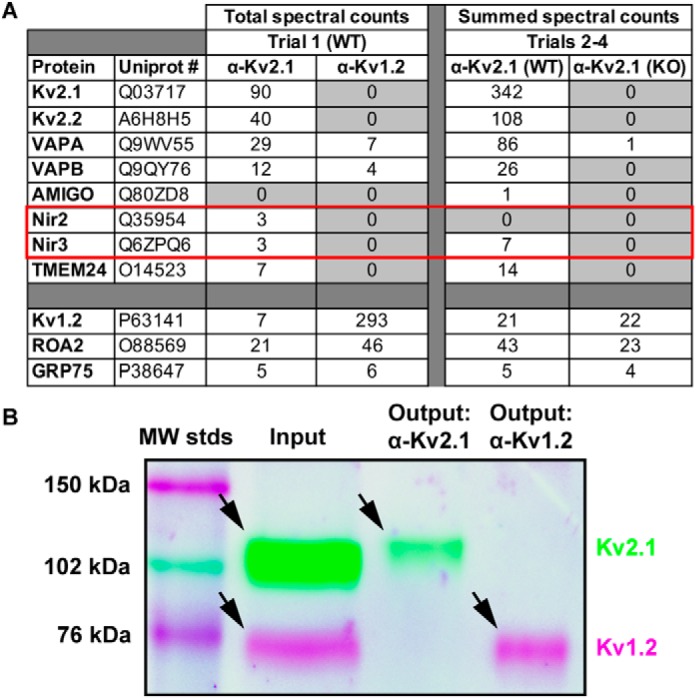
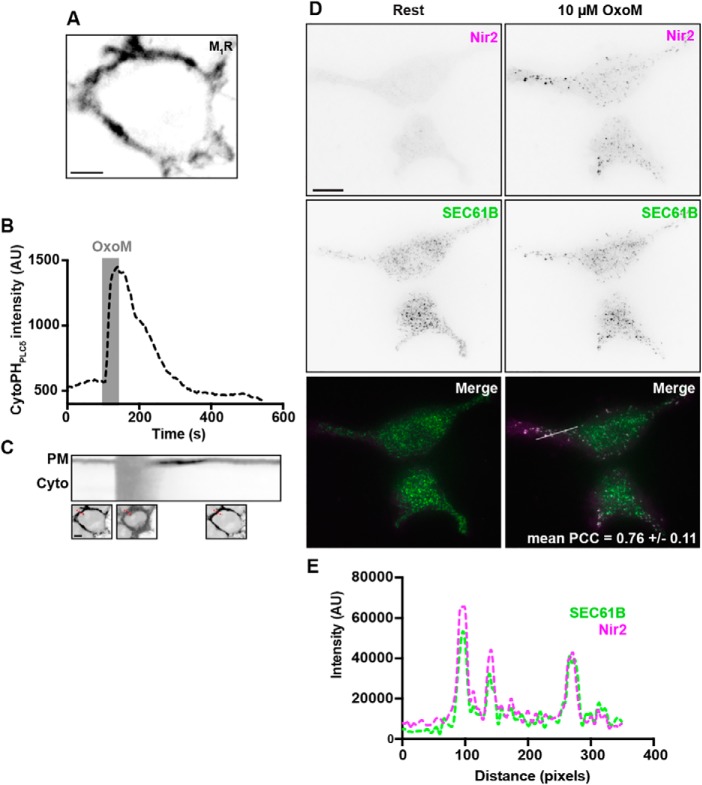
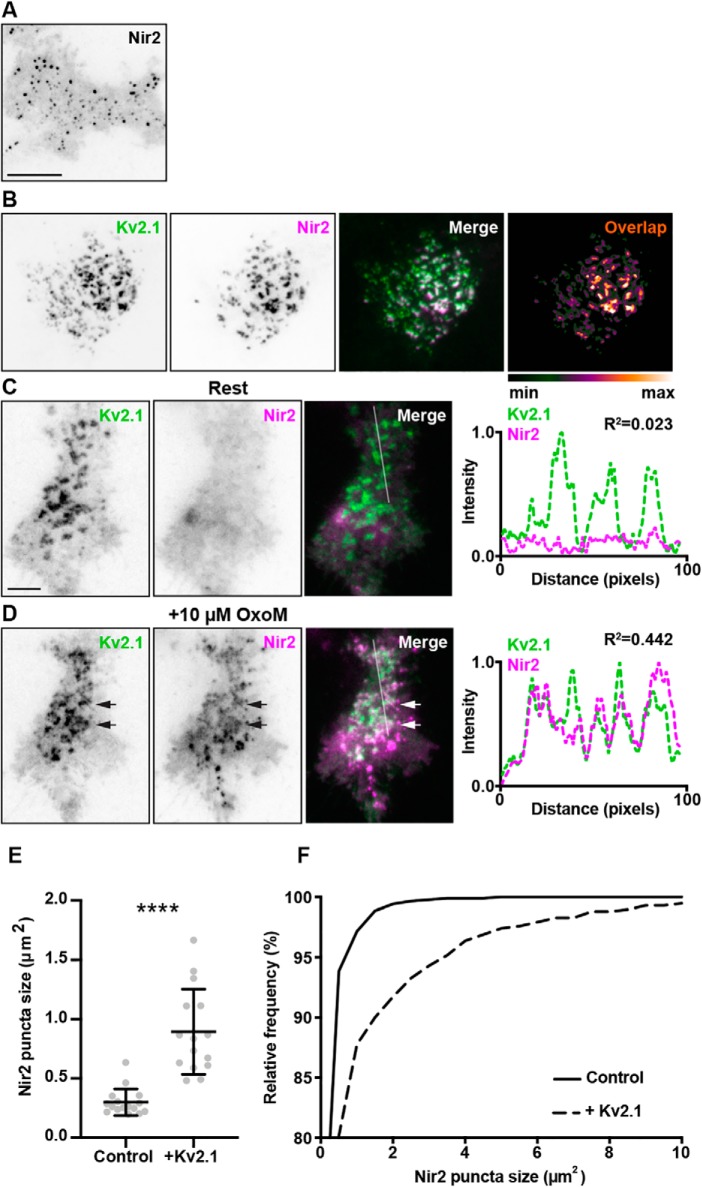
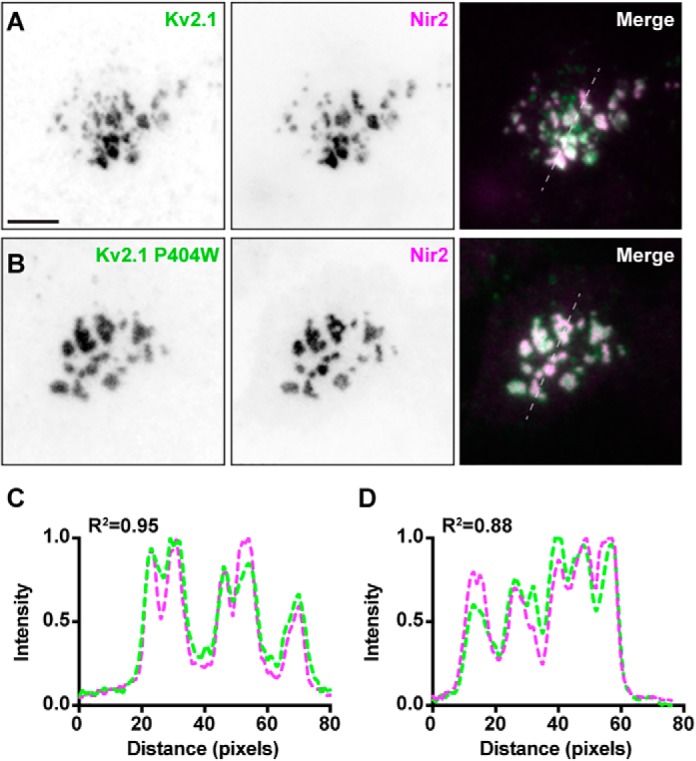
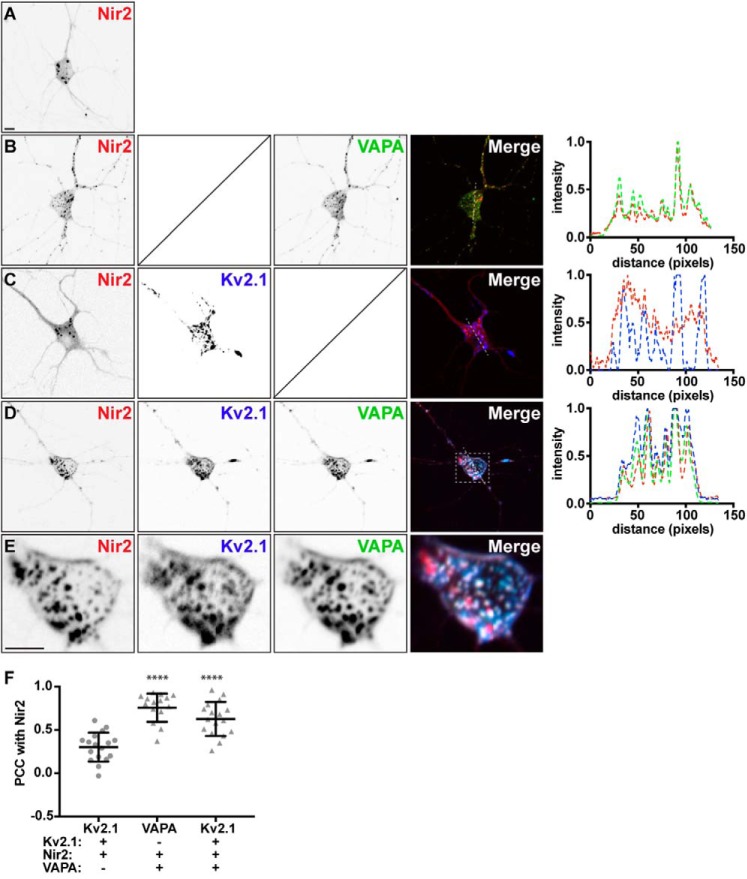
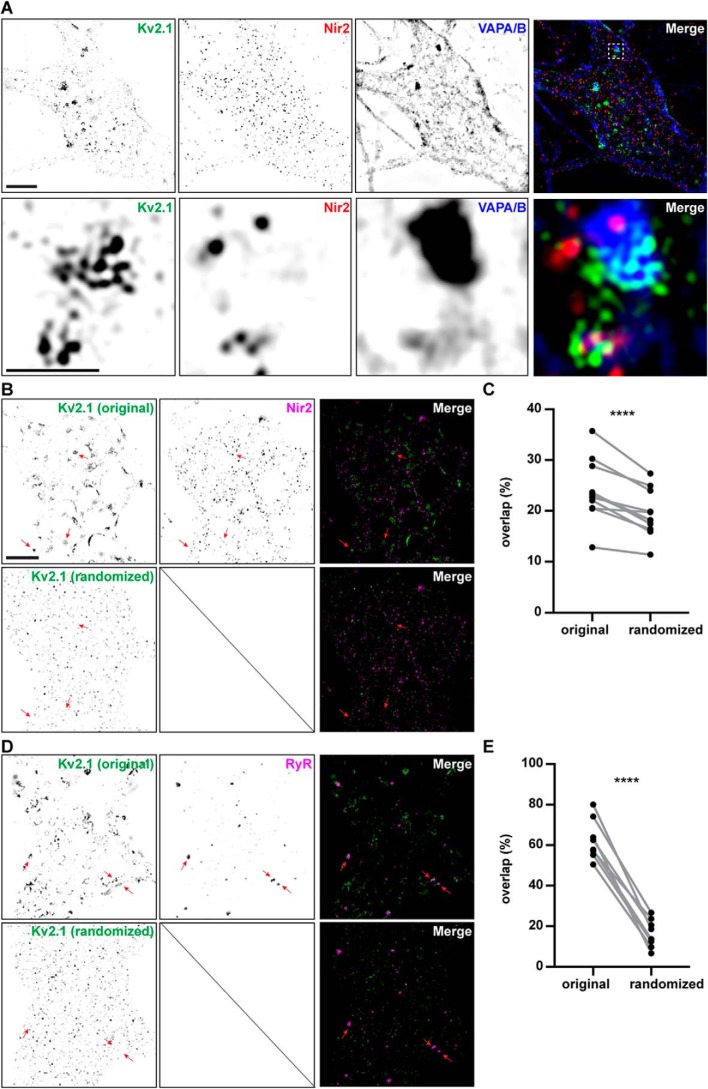
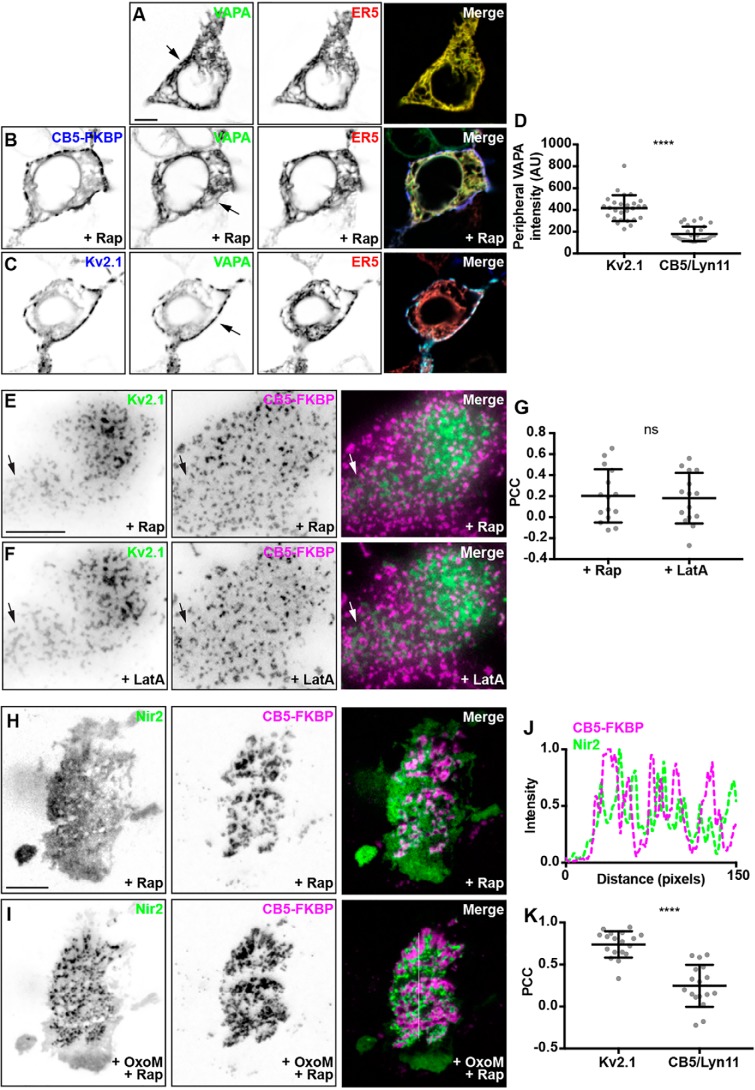
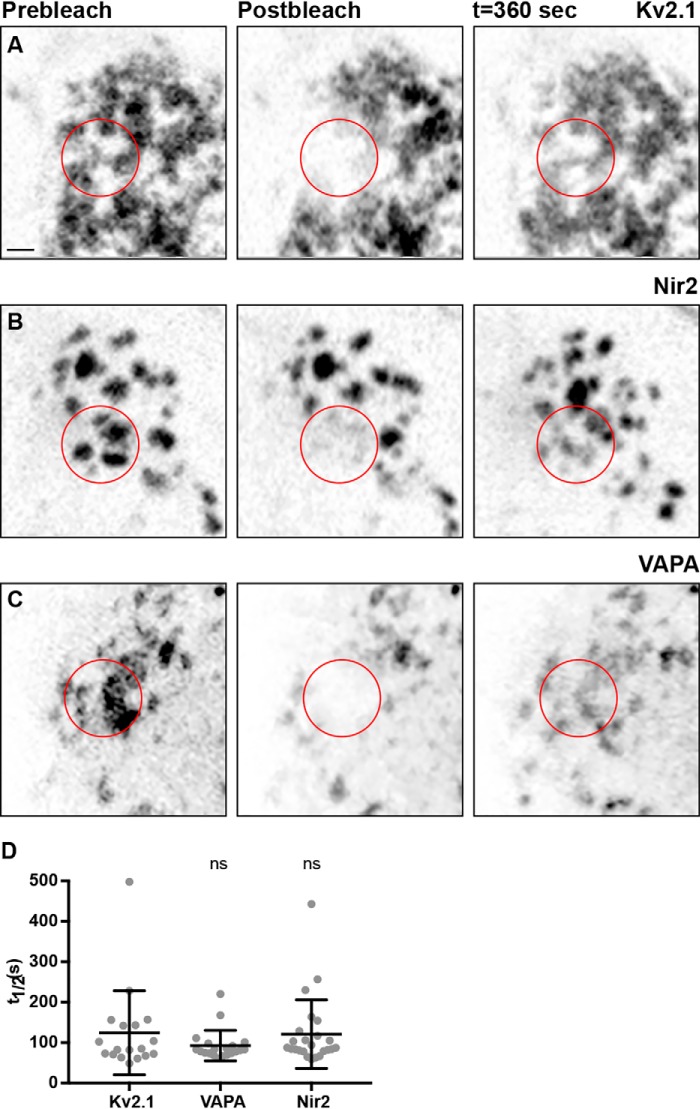
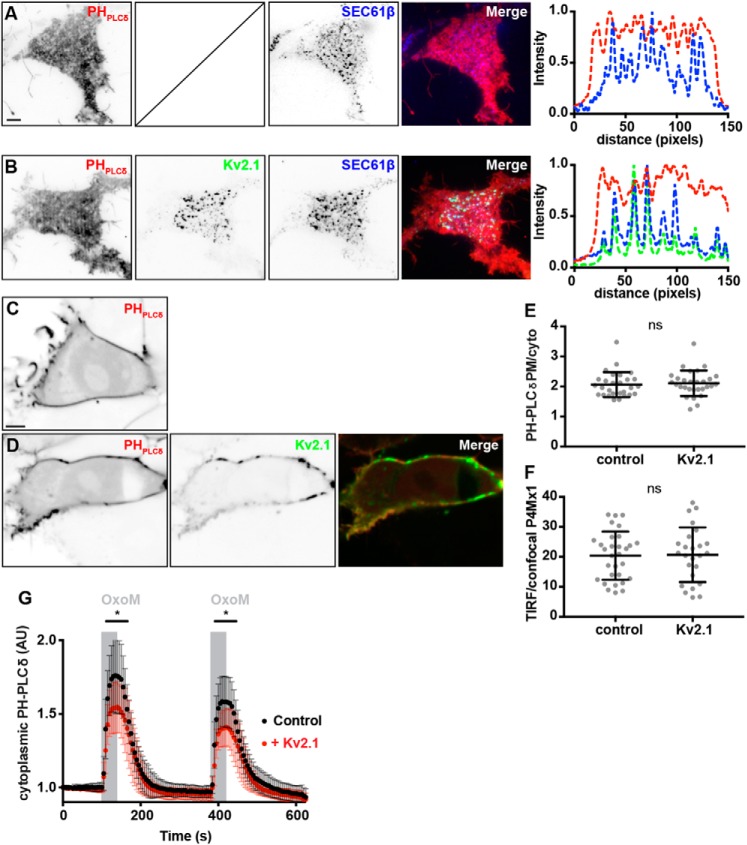
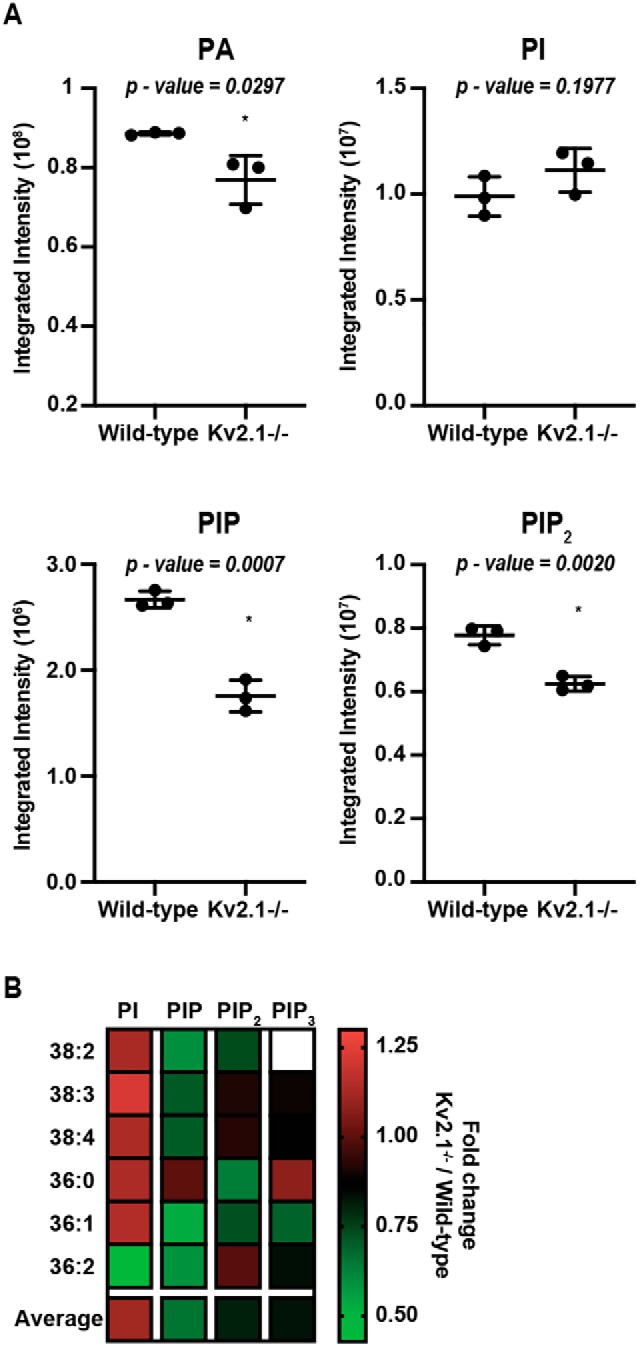
The association of plasma membrane (PM)-localized voltage-gated potassium (Kv2) channels with endoplasmic reticulum (ER)-localized vesicle-associated membrane protein-associated proteins VAPA and VAPB defines ER-PM junctions in mammalian brain neurons. Here, we used proteomics to identify proteins associated with Kv2/VAP-containing ER-PM junctions. We found that the VAP-interacting membrane-associated phosphatidylinositol (PtdIns) transfer proteins PYK2 N-terminal domain-interacting receptor 2 (Nir2) and Nir3 specifically associate with Kv2.1 complexes. When coexpressed with Kv2.1 and VAPA in HEK293T cells, Nir2 colocalized with cell-surface-conducting and -nonconducting Kv2.1 isoforms. This was enhanced by muscarinic-mediated PtdIns(4,5)P2 hydrolysis, leading to dynamic recruitment of Nir2 to Kv2.1 clusters. In cultured rat hippocampal neurons, exogenously expressed Nir2 did not strongly colocalize with Kv2.1, unless exogenous VAPA was also expressed, supporting the notion that VAPA mediates the spatial association of Kv2.1 and Nir2. Immunolabeling signals of endogenous Kv2.1, Nir2, and VAP puncta were spatially correlated in cultured neurons. Fluorescence-recovery-after-photobleaching experiments revealed that Kv2.1, VAPA, and Nir2 have comparable turnover rates at ER-PM junctions, suggesting that they form complexes at these sites. Exogenous Kv2.1 expression in HEK293T cells resulted in significant differences in the kinetics of PtdIns(4,5)P2 recovery following repetitive muscarinic stimulation, with no apparent impact on resting PtdIns(4,5)P2 or PtdIns(4)P levels. Finally, the brains of Kv2.1-knockout mice had altered composition of PtdIns lipids, suggesting a crucial role for native Kv2.1-containing ER-PM junctions in regulating PtdIns lipid metabolism in brain neurons. These results suggest that ER-PM junctions formed by Kv2 channel-VAP pairing regulate PtdIns lipid homeostasis via VAP-associated PtdIns transfer proteins.

Keywords: brain; endoplasmic reticulum (ER); lipids; membrane contact site (MCS); membrane protein; membrane-associated phosphatidylinositol transfer proteins; neuron; organelle; phosphatidylinositol signaling; plasma membrane; plasma membrane junction; potassium channel.


Conflict of interest statement

The authors declare that they have no conflicts of interest with the contents of this article

Figures

Figure 1.
Figure 1.
Membrane-associated phosphatidylinositol transfer proteins biochemically associate with Kv2.1 in mouse brain. A, total spectra counts of proteins recovered from a single trial of Kv2.1 or Kv1.2 IPs from WT mouse brain and summed spectra counts from three separate trials of Kv2.1 IPs from WT or Kv2.1 KO mouse brain. Note the enriched recovery of Kv2.2, VAPA and VAPB, and Nir2/3 in the Kv2.1 IPs relative to the Kv1.2 IPs. Note the nonspecific recovery of ROA2 and GRP75 in all samples. B, multiplexed immunoblot analysis of input and output fractions from a single trial of Kv2.1 or Kv1.2 IPs performed using WT mouse brain. Note the presence of both Kv2.1 (cyan band, ≈110 kDa) and Kv1.2 (magenta band, ≈70 kDa) in the input fraction and the exclusive presence of Kv2.1 in the Kv2.1 IP output fraction, and Kv1.2 in the Kv1.2 IP output fraction.
Figure 2.
Figure 2.
Acute muscarinic stimulation induces a recoverable loss of PtdIns(4,5)P2 from the PM, and Nir2 recruitment to ER–PM junctions, in HEK293T cells expressing the M1 receptor. A, confocal optical section taken through the center of a single resting HEK293T cell cotransfected with YFP–M1R (shown in A) and mCherry–PHPLCδ (measured in B and shown in C). Note the efficient expression of YFP–M1R at the PM. The scale bar is 5 μm. B, time course of cytoplasmic mCherry–PHPLCδ intensity values, measured from the cell shown in A and C, prior to and during acute (40 s) stimulation (indicated by gray bar) with 10 μm OxoM and following washout. C, kymograph of PM and cytoplasmic mCherry–PHPLCδ expression taken from the same cell as in A and B. Note the loss of PM mCherry–PHPLCδ during 10 μm OxoM stimulation, and the recovery of PM mCherry–PHPLCδ following washout. Representative confocal optical sections of mCherry–PHPLCδ, taken through the center of the cell during rest, stimulation, and washout, are shown below the kymograph. The scale bar is 5 μm. Selection for kymograph is indicated by a red dashed line in these images. D, representative TIRF images of a pair of HEK293T cells cotransfected with GFP–VAPA (not shown), YFP–M1R (not shown), mCherry–Nir2 (magenta), and BFP–SEC61β (green) before (left) and after (right) acute stimulation with 10 μm OxoM. Merged image is shown at bottom. The scale bar in the large image is 10 μm. The PCC (mean ± S.D.) between mCherry–Nir2 and BFP–SEC61β following muscarinic stimulation is reported in the right merged image (n = 4 cells). E, line-scan analyses of mCherry–Nir2 (magenta) and BFP–SEC61β (green) intensity, following stimulation with 10 μm OxoM, from region indicated in the right merged image of D.
Figure 3.
Figure 3.
Muscarinic stimulation triggers Nir2 recruitment to Kv2.1/VAP-mediated ER–PM junctions. A, TIRF image of a HEK293T cell cotransfected with YFP–M1R (not shown), GFP–VAPA (not shown), and mCherry–Nir2 (shown in inverted contrast) stimulated with 10 μm OxoM. The scale bar is 5 μm and holds for B. B, TIRF images of a resting HEK293T cell cotransfected with YFP–M1R (not shown), GFP–VAPA (not shown), mCherry–Nir2 (magenta), and CFP–Kv2.1 (green). Pixel overlap analysis of CFP–Kv2.1 and mCherry–Nir2 is shown to the right of the merged image. Note the robust colocalization of mCherry–Nir2 with CFP–Kv2.1. C, TIRF images of another resting HEK293T cell cotransfected with YFP–M1R (not shown), GFP–VAPA (not shown), mCherry–Nir2 (magenta), and CFP–Kv2.1 (green) prior to acute stimulation with 10 μm OxoM. The scale bar is 5 μm and holds for D. Line scan analysis of mCherry–Nir2 and CFP–Kv2.1 intensity, from selection indicated in merged image, is shown to right of merged image. D, TIRF images of same cell shown in C following acute stimulation with 10 μm OxoM. Line scan analysis of mCherry–Nir2 and CFP–Kv2.1 intensity, from selection indicated in merged image, shown to right of merged image. Note the overlap of Kv2.1 and Nir2 intensity profiles following stimulation with OxoM. E, summary graph of mean Nir2 puncta sizes, measured from 10 μm OxoM-stimulated HEK293T cells expressing mCherry–Nir2, GFP–VAPA, YFP–M1R (control), or coexpressing CFP–Kv2.1 (+Kv2.1). Bars are mean ± S.D. (****, p value = 6.87 × 10⁻⁷, n = 15–16 cells, two-tailed unpaired t test). F, cumulative frequency distributions of Nir2 puncta sizes measured from cells summarized in E.
Figure 4.
Figure 4.
Conducting and nonconducting cell surface Kv2.1 colocalizes with Nir2 in resting HEK293T cells. A, TIRF images of a HEK293T cell cotransfected with CFP–Kv2.1 (surface labeled with GxTX-633, green), GFP–VAPA (not shown), YFP–M1R (not shown), and mCherry–Nir2 (magenta). The scale bar is 10 μm and holds for all images. B, TIRF image of another HEK293T cell cotransfected with Kv2.1 P404W (surface-labeled with GxTX-633, green) GFP–VAPA (not shown), YFP–M1R (not shown), and mCherry–Nir2 (magenta). C and D, line-scan analyses of GxTX-633 surface labeling and mCherry–Nir2 intensity from selections indicated in merged images of A and B, respectively.
Figure 5.
Figure 5.
VAP coexpression triggers Nir2 recruitment to ER–PM junctions mediated by Kv2.1 in live cultured rat hippocampal neurons. A, SDC optical sections taken at the basal surface of a cultured rat hippocampal neuron transfected with mCherry–Nir2. The scale bar is 5 μm and holds for all images. B, SDC optical sections taken at the basal surface of a cultured rat hippocampal neuron cotransfected with mCherry–Nir2 (red) and GFP–VAPA (green). Note the robust colocalization of GFP–VAPA with mCherry–Nir2. Line scan analysis of mCherry–Nir2 and GFP–VAPA intensity from selection indicated in merged image of B is shown to the right of B. C, SDC optical sections taken at the basal surface of a cultured rat hippocampal neuron cotransfected with mCherry–Nir2 (red) and CFP–Kv2.1 (blue). Note the lack of minimal colocalization of mCherry–Nir2 with CFP–Kv2.1. Line scan analysis of mCherry–Nir2 and CFP–Kv2.1 intensity from selection indicated in merged image of C is shown to the right of C. D, SDC optical sections taken at the basal surface of a cultured rat hippocampal neuron cotransfected with mCherry–Nir2 (red), GFP–VAPA (green), and CFP–Kv2.1 (blue). Note the robust colocalization of mCherry–Nir2 with GFP–VAPA and CFP–Kv2.1. Line scan analysis of mCherry–Nir2, GFP–VAPA, and CFP–Kv2.1 intensity from selection indicated in merged image of D is shown to the right of D. E, enlarged images of mCherry–Nir2 (red), GFP–VAPA (green), and CFP–Kv2.1 (blue) from selection indicated in merged image of D. F, summary graph of Pearson's correlation coefficient values between mCherry–Nir2 and GFP–VAPA or CFP–Kv2.1, measured from cultured rat hippocampal neurons transfected with mCherry–Nir2 and CFP–Kv2.1 (circles) or mCherry–Nir2, CFP–Kv2.1, and GFP–VAPA (triangles). Bars are mean ± S.D. (VAPA: ****, p value = 0.0001, n = 16 cells; Kv2.1: ****, p value = 0.0001, n = 17 cells; ordinary one-way ANOVA followed by Dunnett's multiple comparisons test).
Figure 6.
Figure 6.
Spatial distributions of Kv2.1, Nir2, and VAPA/B immunolabeling in cultured hippocampal neurons. A, super-resolution (N-SIM) optical sections taken at the basal membrane of a cultured rat hippocampal neuron immunolabeled for endogenous Kv2.1 (shown in green), Nir2 (shown in red), and VAPA/B (shown in blue). Merged image shown to the right. Bottom panels show magnified selection from merged image in top panel. The scale bar in the upper left Kv2.1 panel is 5 μm and holds for all panels in that row. The scale bar in the magnified Kv2.1 panel is 1.25 μm and holds for all panels in the bottom two rows. B, super-resolution (N-SIM) optical sections taken at the basal membrane of a cultured rat hippocampal neuron immunolabeled for endogenous Kv2.1 and Nir2. The merged image is shown to the right, with Kv2.1 shown in green and Nir2 shown in magenta. The top row shows the original image, and the bottom row the same image after randomization of the Kv2.1 immunolabeling signal. Arrows point at spatially correlated signals in the original images that are lost in the randomized images. The scale bar is 5 μm and also holds for D. C, summary graph of percent overlap of Nir2 signal with Kv2.1 measured from the original images and from the same images after randomization of the Kv2.1 signal (randomized). Percent overlap values for Kv2.1 and Nir2 are original: 23.9 ± 5.97%, and randomized: 19.4 ± 4.56% (mean ± S.D.; ****, p value = 0.000594, n = 11 cells; two-tailed paired t test). D, super-resolution (N-SIM) optical sections taken at the basal membrane of a cultured rat hippocampal neuron immunolabeled for endogenous Kv2.1 and RyRs. The merged image is shown to the right, with Kv2.1 shown in green and RyRs shown in magenta. The top row shows the original image, and the bottom row the same image after randomization of the Kv2.1 immunolabeling signal. Arrows point at spatially correlated signals in the original images that are lost in the randomized images. E, summary graph of percent overlap of RyR signal with Kv2.1 measured from the original images and from the same images after randomization of the Kv2.1 signal (randomized). Percent overlap values for Kv2.1 and RyRs are original: 62.6 ± 9.96%, and randomized: 16.5 ± 7.00% (mean ± S.D.; ****, p value = 0.00000195, n = 8 cells; two-tailed paired t test).
Figure 7.
Figure 7.
Nir2 is preferentially recruited to ER–PM junctions enhanced by Kv2.1 expression, relative to those formed via a rapamycin-mediated heterodimerization strategy. A, SDC optical sections taken through the center of a HEK293T cell cotransfected with GFP–VAPA (green) and DsRed2–ER5 (red). The scale bar is 5 μm and holds for all images in A–C. Note the broad distribution of VAPA throughout bulk ER. B, confocal optical sections taken through the center of a HEK293T cell cotransfected with CFP–CB5–FKBP (blue), lyn11–FRB (not shown), GFP–VAPA (green), and DsRed2–ER5 (red) and treated with 5 μm rapamycin. Note the broad distribution of VAPA throughout bulk ER, and the lack of an enrichment of VAPA at ER–PM junctions induced by CFP–CB5–FKBP/lyn11–FRB heterodimerization. C, confocal optical sections taken through the center of a HEK293T cell cotransfected with CFP–Kv2.1 (blue), GFP–VAPA (green), and DsRed2–ER5 (red). Note the reduction of VAPA in bulk ER and the enrichment of GFP–VAPA at ER–PM junctions induced by CFP–Kv2.1 expression. D, summary graph of peripheral VAPA intensity measured from HEK293T cells cotransfected with GFP–VAPA and CFP–Kv2.1 or CFP–CB5–FKBP/lyn11–FRB and treated with 5 μm rapamycin (****, p value = 3.58 × 10⁻¹³, n = 27–31 cells, two-tailed unpaired t test). E and F, TIRF image of a HEK293T cell cotransfected with DsRed–Kv2.1 (green), CFP–CB5–FKBP (magenta), and lyn11–FRB (not shown) following 5 μm rapamycin treatment (E) and following 10 μm latrunculin A treatment (F). The scale bar is 10 μm and holds for E and F. G, summary graph of PCC measurements between DsRed–Kv2.1 and CFP–CB5–FKBP measured from HEK293T cells cotransfected with DsRed–Kv2.1, CFP–CB5–FKBP, and lyn11–FRB and treated with 5 μm rapamycin and further treated with 10 μm latrunculin A (ns, p value = 0.8092, n = 15 cells, two-tailed unpaired t test). H and I, TIRF images of a HEK293T cell cotransfected with YFP–M1R (not shown), GFP–VAPA (not shown), mCherry–Nir2 (magenta), CFP–CB5–FKBP (green), and lyn11–FRB (not shown) and treated with 5 μm rapamycin, at rest (H) and following (I) acute stimulation with 10 μm OxoM. The scale bar is 5 μm and holds for all images in H and I. J, line scan analysis of CFP–CB5–FKBP and mCherry–Nir2 intensity from selection indicated in merged image of I. Note the interdigitation of CFP–CB5–FKBP and mCherry–Nir2 intensity profiles. K, summary graph of PCC values between mCherry–Nir2 and CFP–Kv2.1 or CFP–CB5–FKBP measured from HEK293T cells cotransfected with mCherry–Nir2, GFP–VAPA, YFP–M1R, and CFP–Kv2.1 or CFP–CB5–FKBP/lyn11–FRB and treated with 10 μm OxoM (****, p value = 4.856 × 10⁻⁸, n = 17–18 cells, two-tailed unpaired t test).
Figure 8.
Figure 8.
Exogenously expressed Kv2.1, VAPA, and Nir2 display comparable turnover rates at ER–PM junctions when coexpressed in HEK293T cells. A, confocal optical section of CFP–Kv2.1 expression taken from the basal surface of a resting HEK293T cell cotransfected with CFP–Kv2.1, GFP–VAPA (not shown), YFP–M1R (not shown), and mCherry–Nir2 (not shown) at rest (left), following photobleaching of area indicated by red circle (middle) and following recovery (right). The scale bar is 2.5 μm and holds for all images. B, confocal optical section of mCherry–Nir2 expression taken from the basal surface of a resting HEK293T cell cotransfected with CFP–Kv2.1 (not shown), GFP–VAPA (not shown), YFP–M1R (not shown), and mCherry–Nir2 at rest (left), following photobleaching of area indicated by red circle (middle) and following recovery (right). C, confocal optical section of GFP–VAPA expression taken from the basal surface of a resting HEK293T cell cotransfected with CFP–Kv2.1 (not shown), GFP–VAPA, and mCherry–Nir2 (not shown) at rest (left), following photobleaching of area indicated by red circle (middle), and following recovery (right). D, summary graph of t½ values of CFP–Kv2.1, mCherry–Nir2, and GFP–VAPA measured from FRAP experiments presented in A–C. Bars are mean ± S.D. Note the lack of a significant difference between t½ values of CFP–Kv2.1, GFP–VAPA, and mCherry–Nir2. (p value = 0.0923, n = 18–20 cells; ordinary one-way ANOVA).
Figure 9.
Figure 9.
Kv2.1 expression alters the kinetics of PtdIns(4,5)P2 recovery, following repetitive muscarinic stimulation, but does not alter the steady-state distributions of PtdIns(4,5)P2 or PtdIns(4)P. A, TIRF image of a resting HEK293T cell cotransfected with mCherry–PHPLCδ (red, shown left) and BFP–SEC61β (blue, shown right). Line scan analysis of selection indicated in merged image of A shown to right of A. The scale bar is 5 μm and holds for A and B. B, TIRF image of a resting HEK293T cell cotransfected with mCherry–PHPLCδ (red, shown left), GFP–Kv2.1 (shown middle), and BFP–SEC61β (middle right). Line scan analysis of selection indicated in merged image of B shown to right of B. C, SDC optical section taken through the center of a resting HEK293T cell transfected with mCherry–PHPLCδ alone (shown left). The scale bar is 5 μm and holds for C and D. D, SDC optical sections taken through the center of a resting HEK293T cell cotransfected with mCherry–PHPLCδ (red, shown left) and CFP–Kv2.1 (green, center). E, summary graph of the ratio of PM to cytoplasmic mCherry–PHPLCδ intensity values measured from HEK293T cells transfected with mCherry–PHPLCδ alone (control) or cotransfected with CFP–Kv2.1 (Kv2.1). ns, p value = 0.8654, n = 31 cells; two-tailed unpaired t test. F, summary graph of the ratio of PM (TIRF) to cytoplasmic (SDC) mCherry–P4Mx1 intensity values measured from HEK293T cells transfected with mCherry–P4Mx1 alone (control) or cotransfected with CFP–Kv2.1 (Kv2.1). (ns, p value = 0.1097, n = 25–31 cells; two-tailed unpaired t test). G, time course of cytoplasmic mCherry–PHPLCδ intensity values, measured from cells transfected with YFP–M1R and mCherry–PHPLCδ (control, black trace) or cotransfected with CFP–Kv2.1 (+Kv2.1, red trace) during two acute (40 s, indicated by gray bars) stimulations with 0.5 μm OxoM. Bars are mean ± S.D. Note that following the initial stimulation at 100 s, time points ranging from 110 to 165 s and 390 to 445 s are significantly different (0.0004186 ≤ p value ≤0.047207, n = 20 cells; two-tailed unpaired t test).
Figure 10.
Figure 10.
Kv2.1 KO alters phosphoinositide levels in mouse brains. A, histograms representing UPLC-MS/MS measurements of total PtdIns, PtdIns(4)P, PtdIns(4,5)P2, and phosphatidic acid levels from WT and Kv2.1 KO mouse brains (n = 3). Numbers above each histogram reflect p values. B, heat map profiling the fold change of each phosphoinositide species from Kv2.1 KO relative to WT brains. Each colored box is an average of measurements from three independent experiments (n = 3 mice each). White box denotes absence of lipid from analysis.

References

    1. Henne W. M., Liou J., and Emr S. D. (2015) Molecular mechanisms of inter-organelle ER–PM contact sites. Curr. Opin. Cell Biol. 35, 123–130 10.1016/j.ceb.2015.05.001 - DOI - PubMed
    1. Prakriya M., and Lewis R. S. (2015) Store-operated calcium channels. Physiol. Rev. 95, 1383–1436 10.1152/physrev.00020.2014 - DOI - PMC - PubMed
    1. Gallo A., Vannier C., and Galli T. (2016) Endoplasmic reticulum-plasma membrane associations: structures and functions. Annu. Rev. Cell Dev. Biol. 32, 279–301 10.1146/annurev-cellbio-111315-125024 - DOI - PubMed
    1. Dickson E. J. (2017) Endoplasmic reticulum–plasma membrane contacts regulate cellular excitability. Adv. Exp. Med. Biol. 997, 95–109 10.1007/978-981-10-4567-7_7 - DOI - PubMed
    1. Porter K. R., and Palade G. E. (1957) Studies on the endoplasmic reticulum. III. Its form and distribution in striated muscle cells. J. Biophys. Biochem. Cytol. 3, 269–300 10.1083/jcb.3.2.269 - DOI - PMC - PubMed

Publication types

MeSH terms