. 2019 Oct 8;10(1):4569.
doi: 10.1038/s41467-019-12563-1.

Spatiotemporal dynamics of multidrug resistant bacteria on intensive care unit surfaces

Affiliations

Spatiotemporal dynamics of multidrug resistant bacteria on intensive care unit surfaces

Alaric W D'Souza et al. Nat Commun. .

Abstract

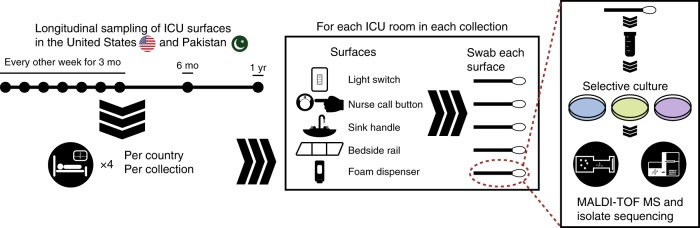
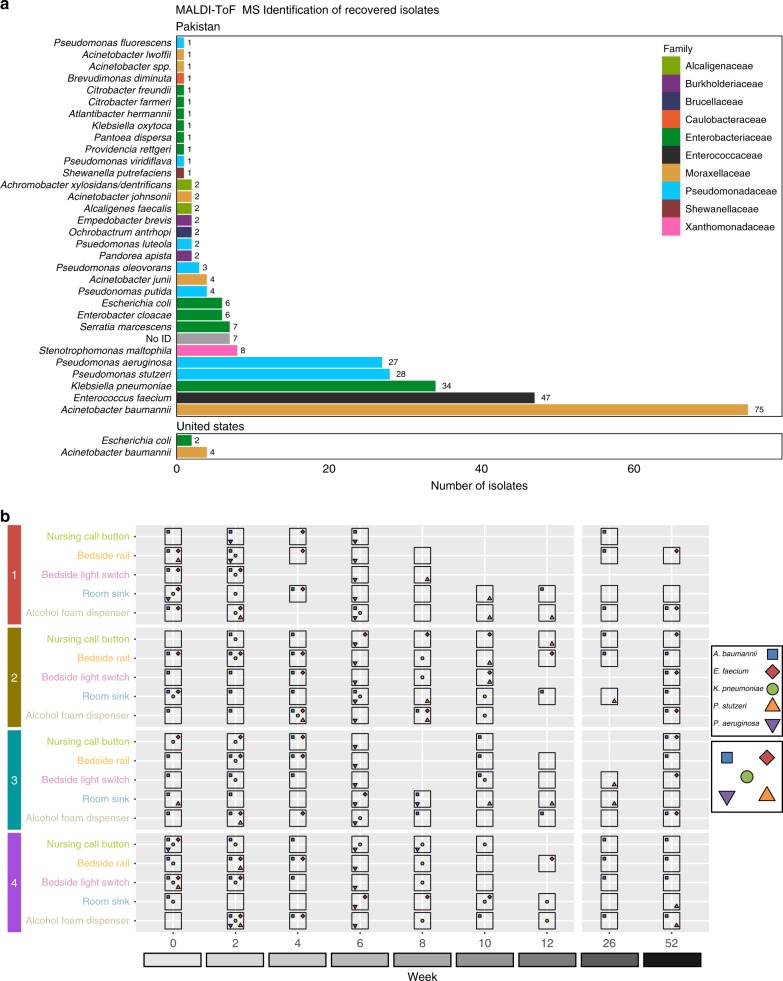
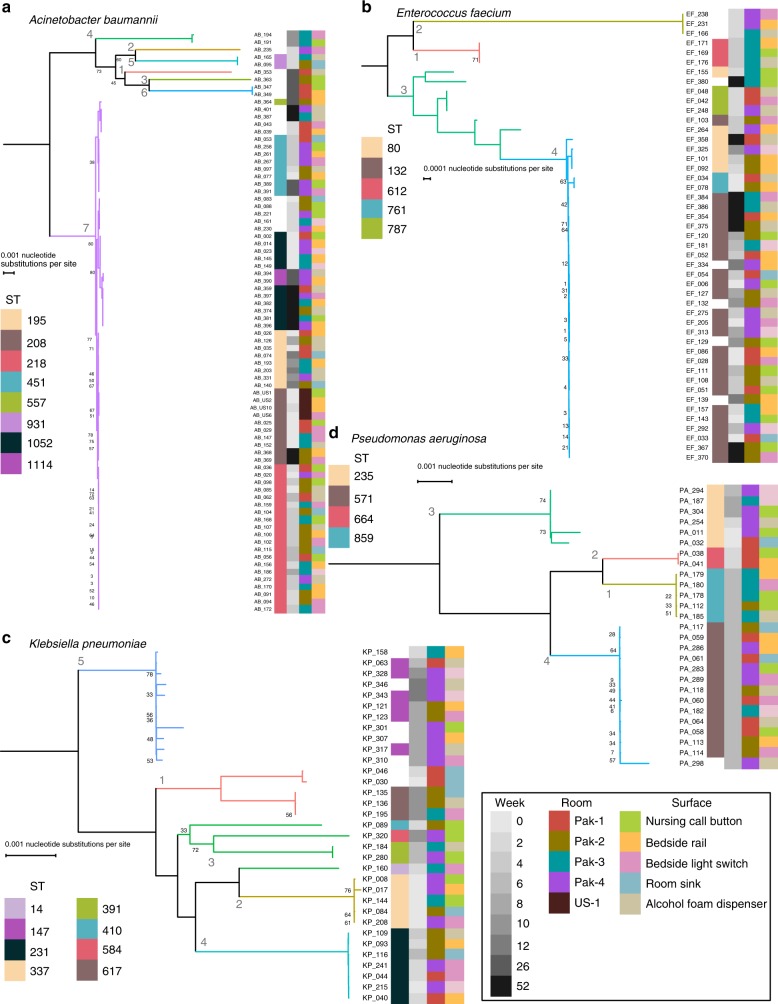
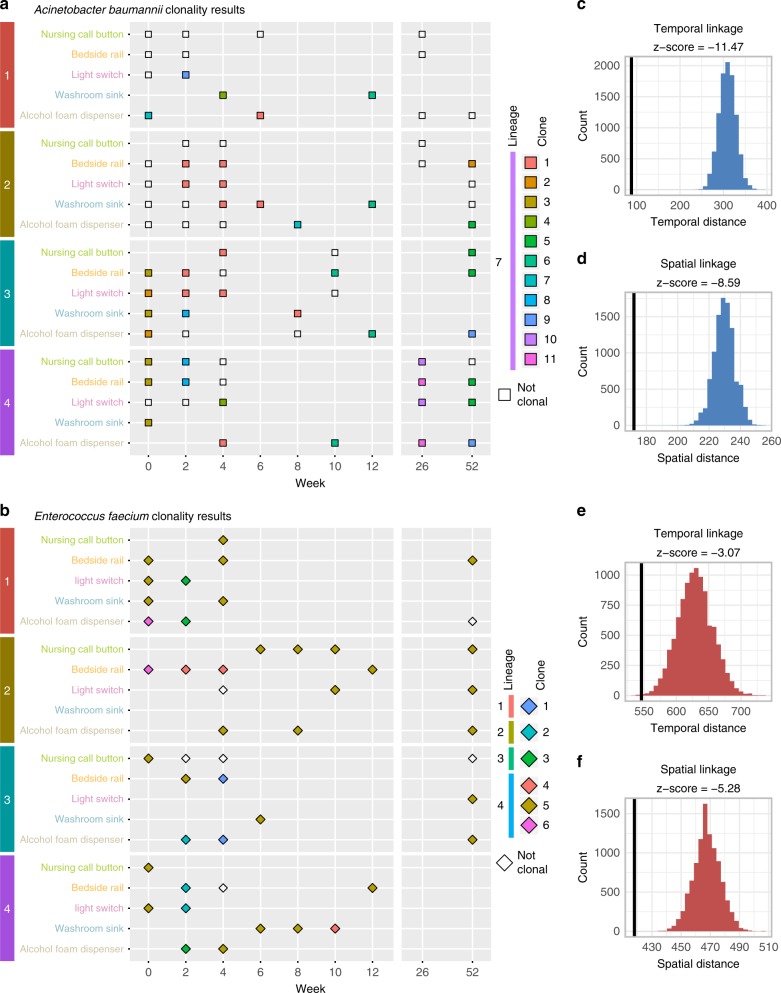
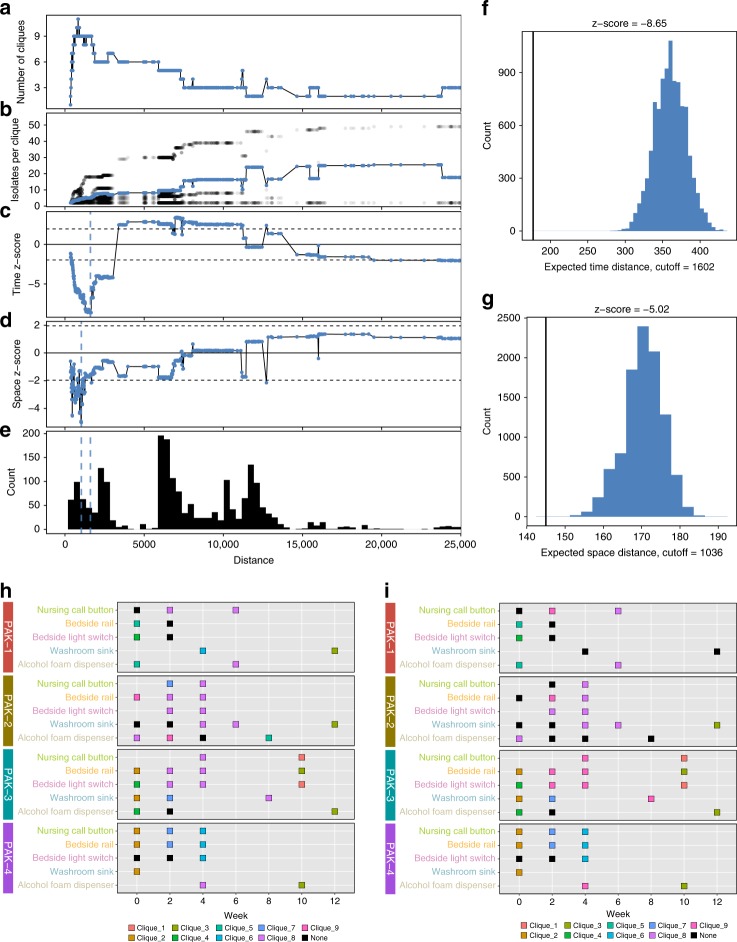
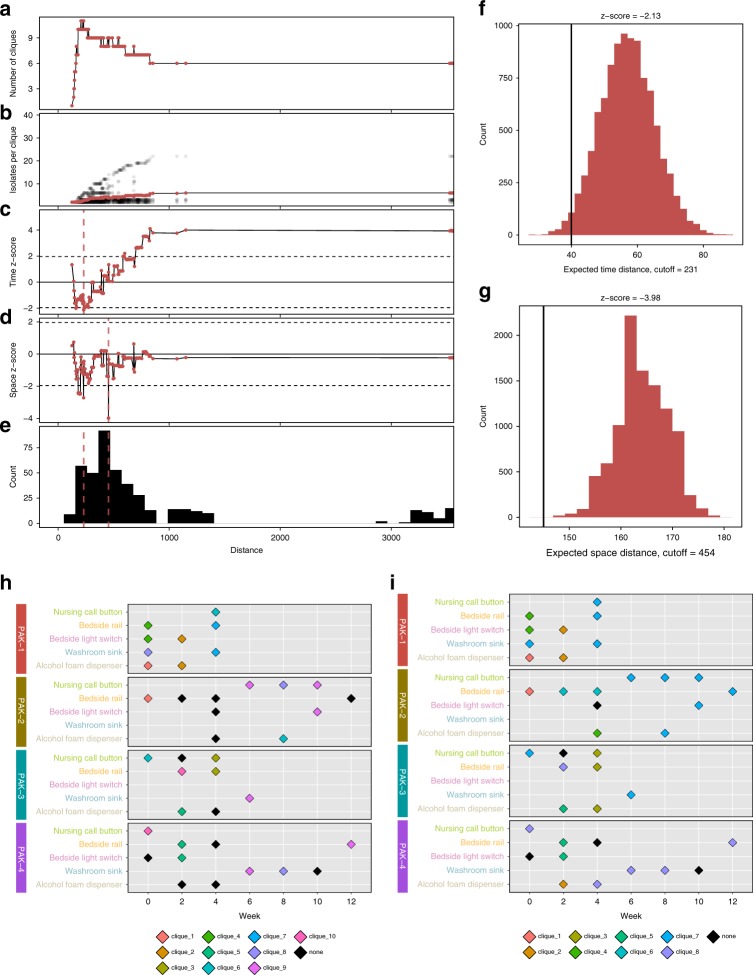
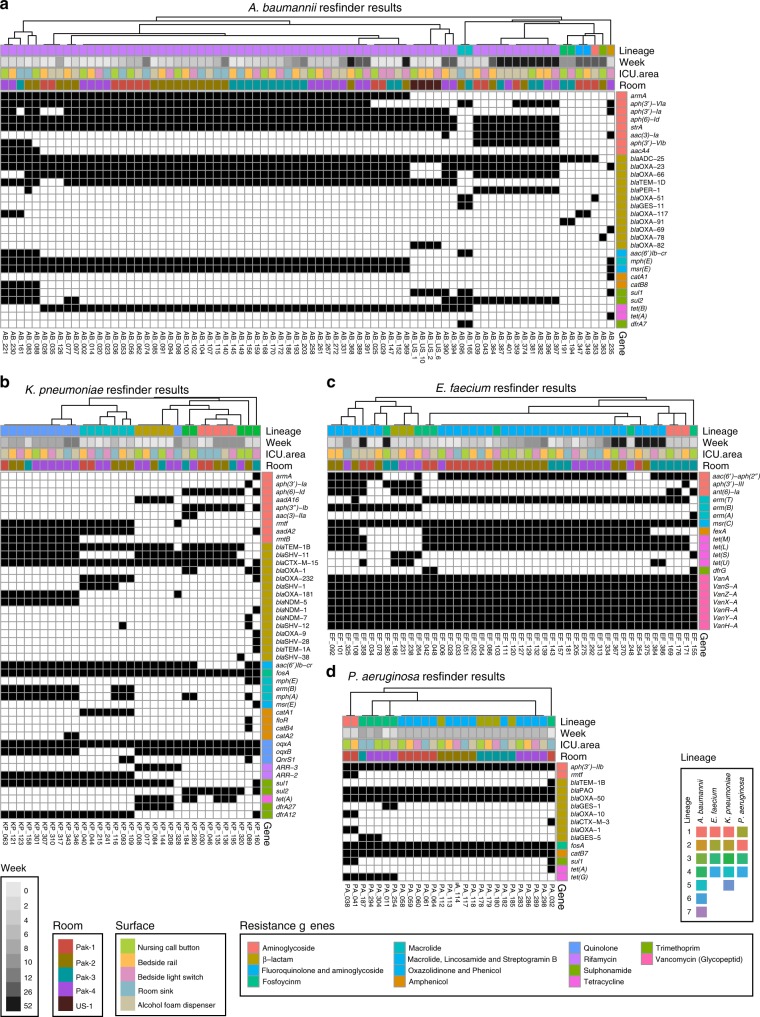
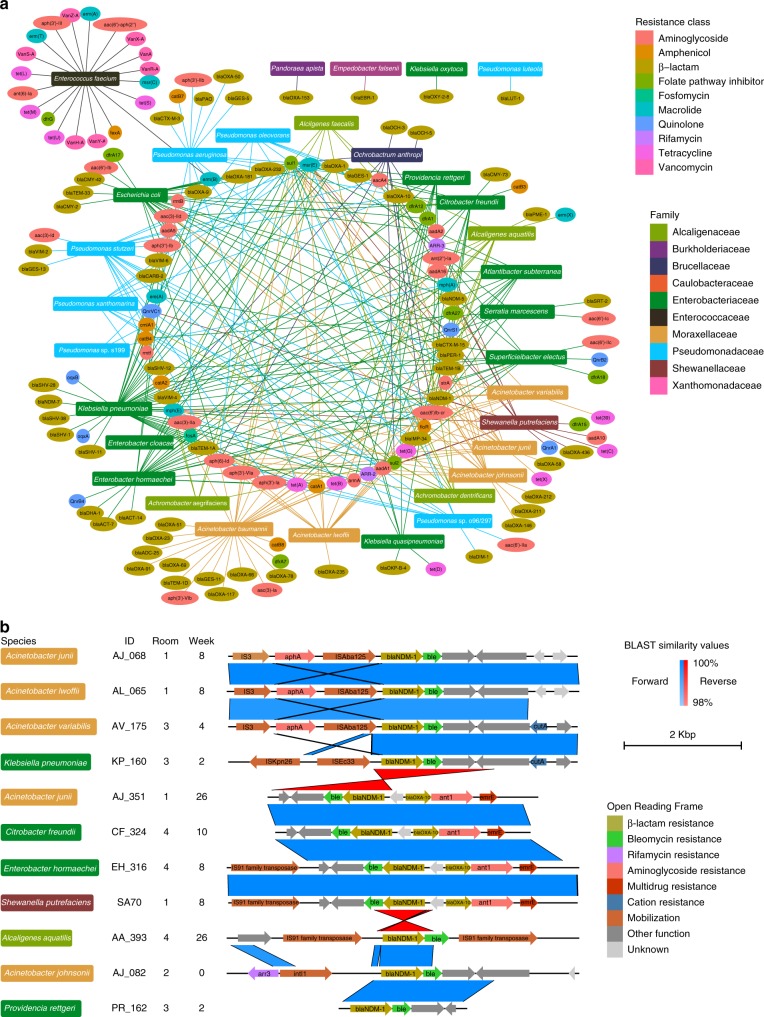
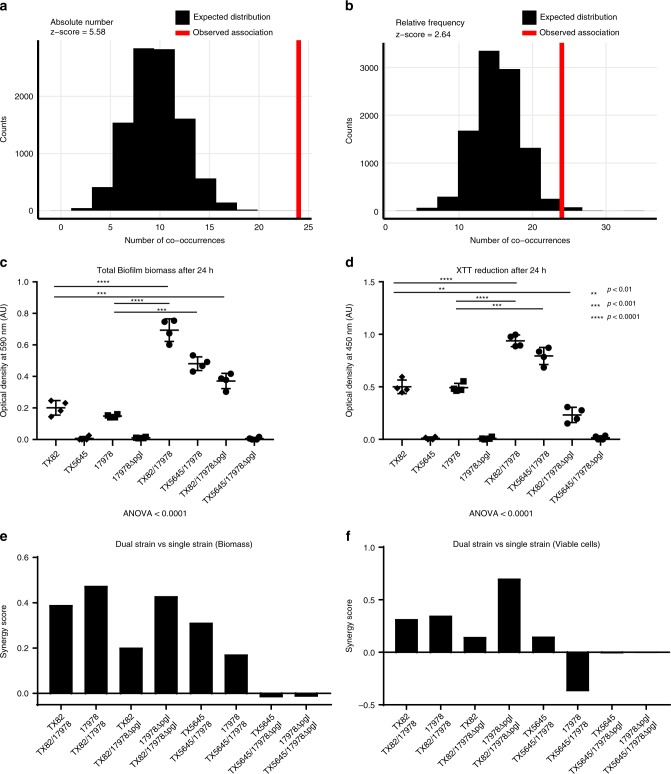
Bacterial pathogens that infect patients also contaminate hospital surfaces. These contaminants impact hospital infection control and epidemiology, prompting quantitative examination of their transmission dynamics. Here we investigate spatiotemporal and phylogenetic relationships of multidrug resistant (MDR) bacteria on intensive care unit surfaces from two hospitals in the United States (US) and Pakistan collected over one year. MDR bacteria isolated from 3.3% and 86.7% of US and Pakistani surfaces, respectively, include common nosocomial pathogens, rare opportunistic pathogens, and novel taxa. Common nosocomial isolates are dominated by single lineages of different clones, are phenotypically MDR, and have high resistance gene burdens. Many resistance genes (e.g., blaNDM, blaOXA carbapenamases), are shared by multiple species and flanked by mobilization elements. We identify Acinetobacter baumannii and Enterococcus faecium co-association on multiple surfaces, and demonstrate these species establish synergistic biofilms in vitro. Our results highlight substantial MDR pathogen burdens in hospital built-environments, provide evidence for spatiotemporal-dependent transmission, and demonstrate potential mechanisms for multi-species surface persistence.


Conflict of interest statement

The authors declare no competing interests.

Figures

Fig. 1
Fig. 1
Overview of sample collection and processing. Samples were collected from surfaces longitudinally over the course of 1 year from PAK-H ICU and USA-H ICU. Four rooms from each ICU were chosen for sampling and five surfaces within each room were surveyed for every collection time. Bacteria were cultured from the collection swabs, identified by MALDI-TOF MS, and then whole-genome sequenced
Fig. 2
Fig. 2
Bacterial isolate taxonomic identification and location. a MALDI-TOF MS identifications of bacterial isolates recovered from surfaces at PAK-H (above) and USA-H (below), colored by family. b Overview of PAK-H bacterial surface collections. Each horizontal gray panel represents a PAK-H room. Within each room, the horizontal gridded white lines are the five sampled surfaces. Each vertical white line is one of the collection weeks. Places where the horizontal and vertical white lines intersect represent a sampling. Large, open black boxes are around any surface where one or more bacteria were collected. The five most abundant species in the collections are indicated as colored shapes within the black boxes of surfaces where they were collected (blue squares are A. baumannii, red diamonds are E. faecium, green circles are K. pneumoniae, orange triangles are P. stutzeri, and purple triangles are P. aeruginosa). Source data for both panels are provided in the source data file
Fig. 3
Fig. 3
Phylogenetic trees of high abundance species from core genome alignments. Maximum likelihood phylogenetic trees from core genome alignments of A. baumannii (a), E. faecium (b), K. pneumoniae (c), and P. aeruginosa (d). Tree branches are colored by hierBAPS lineage and these lineages are colored in subsequent figures. Sequence type, week, room, and surface are annotated as colored bars next to the isolate number. Week is given as grayscale with darker values corresponding to later weeks. The US room that yielded isolates is annotated dark brown. The Pakistan rooms are red, olive, turquoise, and purple for rooms 1–4, respectively. Surfaces are lime green for nursing call button, light orange for bedside rail, pink for bedside light switch, blue for room sink, and light brown for alcohol foam dispenser. Scale bars for nucleotide substitutions per site are indicated for each tree. Source data for all panels are provided in the source data file
Fig. 4
Fig. 4
Relationship of core genome SNP groups to spatial and temporal distance. a Clonality results for A. baumannii. Squares represent A. baumannii collected from surfaces. Colors represent clonal subgroup membership. Each colored set is a clonal subgroup with fewer than five SNPs different between all members of the group. Unfilled squares did not have fewer than five SNPs different with any other isolates. Lineage from BAP (identified in Fig. 3 by branch color) is indicated in the legend on the left. b Clonality results for E. faecium. Diamonds represent E. faecium collected from surfaces. Colors represent clonal subgroup membership. Each colored set is a clonal subgroup with fewer than five SNPs different between all members of the group. Unfilled diamonds did not have fewer than five SNPs different with any other isolates. Lineage from BAP is indicated in the legend on the left. For c, d, temporal distances are calculated as +1 for every 2-week span separating isolate collections. Spatial distances are given as +0 if isolates were collected from the same surface and room, +1 if they were collected from the same room, but different surfaces, and +2 if they were collected from different rooms. c Temporal linkage for A. baumannii clones. The expected temporal distance distribution is shown in blue and the observed temporal distribution is shown as a solid black line. d Spatial linkage for A. baumannii clones. The expected spatial distance distribution is shown in blue and the observed spatial distribution is shown as a solid black line. e Temporal linkage for E. faecium clones. The expected temporal distance distribution is shown in red and the observed temporal distribution is shown as a solid black line. f Spatial linkage for E. faecium clones. The expected spatial distance distribution is shown in red and the observed spatial distribution is shown as a solid black line. Source data for all panels are provided in the source data file
Fig. 5
Fig. 5
A. baumannii optimal pairwise variant distance cliques identified by spatial and temporal data. A. baumannii isolate clique groupings with the lowest observed spatial and temporal distances compared to the expected distribution. Panels ae give information on the clique groupings for each unique variant distance cutoff (x-axis) starting at the minimum variant distance and extending until the minimum variant distance between two isolates from different lineages. Panel a shows the number of completely connected cliques identified at the current cutoff value. Panel b shows the number of isolates per clique, with the black dots showing each individual clique and the blue points showing the average per clique. Panels c and d show the deviation (z-score given as blue points) of the observed temporal (c) or spatial (d) distance compared to the expected distribution. The dotted lines show the upper and lower significance bounds. e Histogram of the number of pairwise comparisons in different variant distance cutoff ranges. Blue dashed lines show the minimum z-score cutoffs for the temporal and spatial distances given in c and d. Panels f and g show the observed distance value vs the expected distribution for the minimum z-score values identified in c and d for temporal (f) and spatial (g) distance. The black vertical line is the observed distance and blue filled histogram is the expected distribution. Panels h and i show the cliques identified at the minimum z-score cutoffs for temporal (h) and spatial (i) distance measurements. Source data for all panels are provided in the source data file
Fig. 6
Fig. 6
E. faecium optimal pairwise variant distance cliques identified by spatial and temporal data. E. faecium isolate clique groupings with the lowest observed spatial and temporal distances compared to the expected distribution. Panels ae give information on the clique groupings for each unique variant distance cutoff (x-axis) starting at the minimum variant distance and extending until the minimum variant distance between two isolates from different lineages. Panel a shows the number of completely connected cliques identified at the current cutoff value. Panel b shows the number of isolates per clique, with the black dots showing each individual clique and the red points showing the average per clique. Panels c and d show the deviation (z-score given as red points) of the observed temporal (c) or spatial (d) distance compared to the expected distribution. The dotted lines show the upper and lower significance bounds. e Histogram of the number of pairwise comparisons in different variant distance cutoff ranges. Red dashed lines show the minimum z-score cutoffs for the temporal and spatial distances given in c and d. Panels f and g show the observed distance value vs the expected distribution for the minimum z-score values identified in c and d for temporal (f) and spatial (g) distance. The black vertical line is the observed distance and red filled histogram is the expected distribution. Panels h and i show the show the cliques identified at the minimum z-score cutoffs for temporal (h) and spatial (i) distance measurements. Source data for all panels are provided in the source data file
Fig. 7
Fig. 7
Genotypic antibiotic resistance in major species. Resfinder results for A. baumannii (a), K. pneumoniae (b), E. faecium (c), P. aeruginosa (d). Resistance genes are grouped by antibiotic class on the y-axis and individual isolates are hierarchically clustered by their resistance genes on the x-axis. Black squares indicate the presence of a specific resistance gene in an isolate. Colored annotations are added next to the resistance genes for resistance gene class and above the charts for hierBAPS lineage (identified in Fig. 3 by branch color), week, surface, and room. Source data for all panels are provided in the source data file
Fig. 8
Fig. 8
Shared antibiotic resistance genes across diverse taxonomic groups. a Species and resistance gene network diagram. Species are represented as rectangles colored by family. Resistance genes are represented by ovals colored by resistance gene class. Lines colored by species family are drawn from each species to all the resistance genes annotated by Resfinder in that species isolates. b Annotated blaNDM-1 contigs in 11 isolates. Protein annotations colored by putative function are shown as arrows for each isolate’s blaNDM-1 contig. BLAST similarity values greater than 98% between contigs are shown in blue if they are oriented in the forward direction and red if they are oriented in the reverse direction. Species names are shown on the left in rectangular boxes colored by family and isolate ID, room, and week are also labeled. Source data for both panels are provided in the source data file
Fig. 9
Fig. 9
Synergistic biofilm interactions for A. baumannii and E. faecium predicted by surface collections. Permutation test of co-association between A. baumannii and E. faecium on surfaces conducted using species a absolute counts and b relative species frequencies. The expected distribution of the number of co-occurrences is shown in red and the observed number of co-occurrences in the dataset is shown as a vertical blue line. Total crystal violet stained c biofilm biomass and d XTT reduction for A. baumannii and E. faecium model biofilm strains grown in single and in co-culture (P-values were generated using unpaired, nonparametric Mann–Whitney statistical tests are indicated using the following mapping: **<0.01, ***<0.001, ****<0.0001). y-Axis for both plots is optical density at 590 nm and 450 nm, respectively, and error bars are 1 standard deviation. Synergy scores of dual vs single strain cultures for e biofilm biomass and f viable cells. Source data for all panels are provided in the source data file

Similar articles

Cited by

References

    1. Crofts TS, Gasparrini AJ, Dantas G. Next-generation approaches to understand and combat the antibiotic resistome. Nat. Rev. Microbiol. 2017;15:422–434. doi: 10.1038/nrmicro.2017.28. - DOI - PMC - PubMed
    1. Stone PW, et al. Attributable costs and length of stay of an extended-spectrum beta-lactamase-producing Klebsiella pneumoniae outbreak in a neonatal intensive care unit. Infect. Control Hosp. Epidemiol. 2003;24:601–606. doi: 10.1086/502253. - DOI - PubMed
    1. Cosgrove SE, Kaye KS, Eliopoulous GM, Carmeli Y. Health and economic outcomes of the emergence of third-generation cephalosporin resistance in Enterobacter species. Arch. Intern. Med. 2002;162:185–190. doi: 10.1001/archinte.162.2.185. - DOI - PubMed
    1. Carmeli Y, Eliopoulos G, Mozaffari E, Samore M. Health and economic outcomes of vancomycin-resistant enterococci. Arch. Intern. Med. 2002;162:2223–2228. doi: 10.1001/archinte.162.19.2223. - DOI - PubMed
    1. Allcock S, et al. Antimicrobial resistance in human populations: challenges and opportunities. Glob. Health Epidemiol. Genom. 2017;2:e4. doi: 10.1017/gheg.2017.4. - DOI - PMC - PubMed

Publication types

MeSH terms

Substances