. 2019 Oct 8;10(1):4575.
doi: 10.1038/s41467-019-12393-1.

Context-specific regulation of surface and soluble IL7R expression by an autoimmune risk allele

Affiliations

Context-specific regulation of surface and soluble IL7R expression by an autoimmune risk allele

Hussein Al-Mossawi et al. Nat Commun. .

Abstract

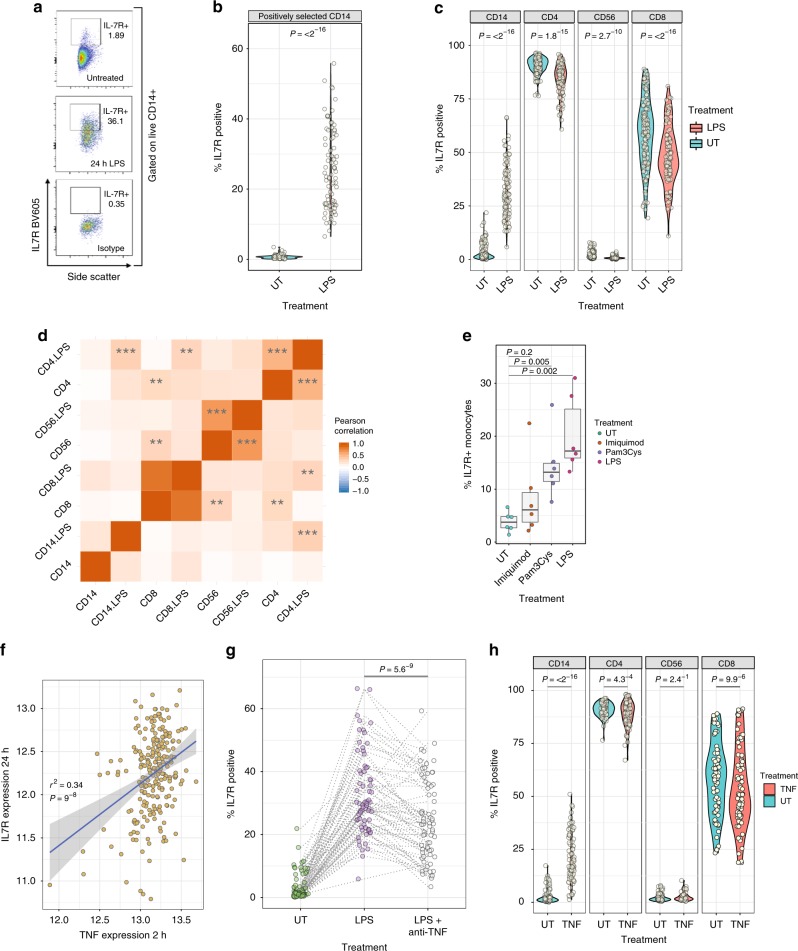
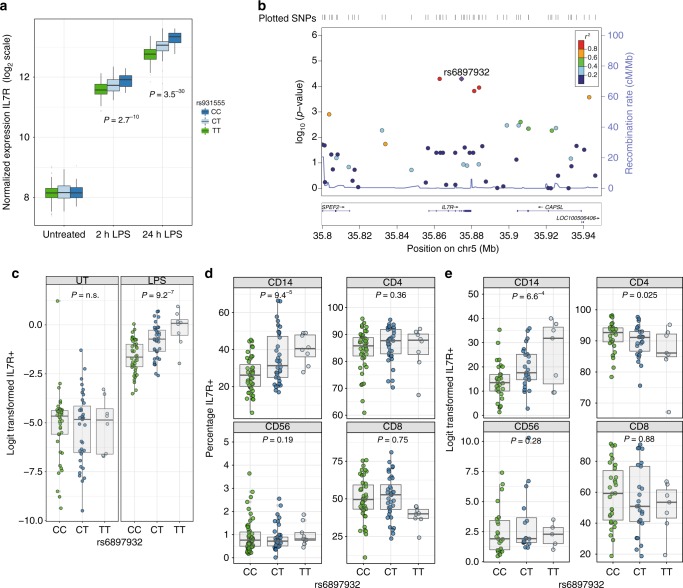
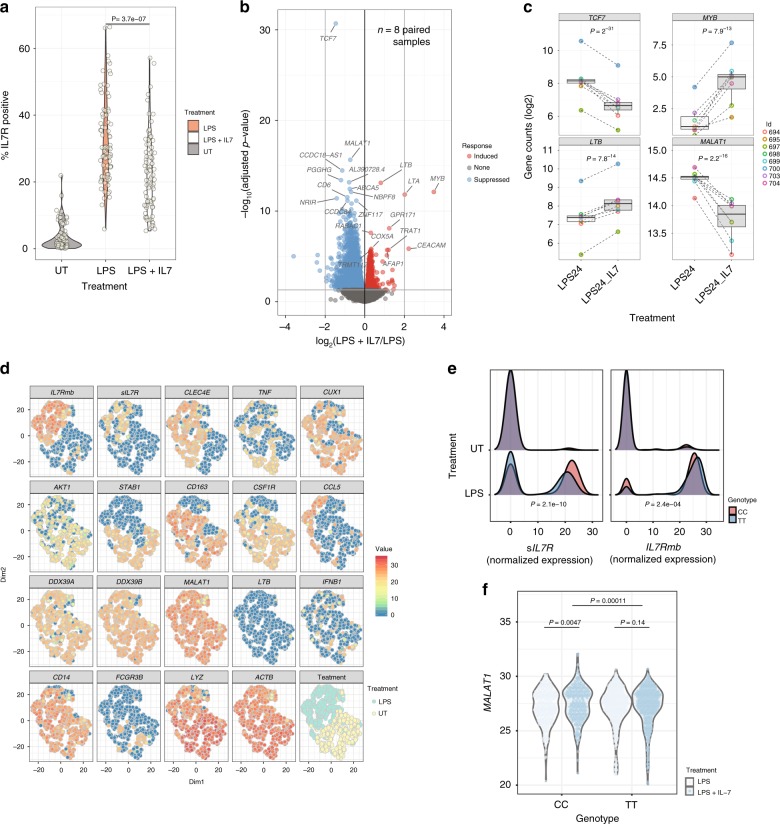
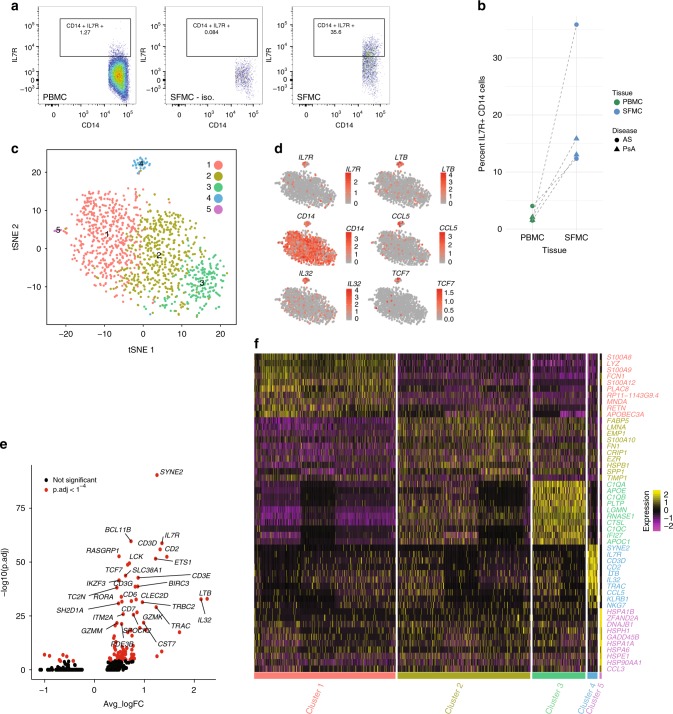
IL-7 is a key factor in T cell immunity and common variants at IL7R, encoding its receptor, are associated with autoimmune disease susceptibility. IL7R mRNA is induced in stimulated monocytes, yet a function for IL7R in monocyte biology remains unexplored. Here we characterize genetic regulation of IL7R at the protein level in healthy individuals, and find that monocyte surface and soluble IL7R (sIL7R) are markedly induced by lipopolysaccharide. In monocytes, both surface IL7R and sIL7R expression strongly associate with allelic carriage of rs6897932, a disease-associated IL7R polymorphism. Monocytes produce more sIL7R than CD4 + T cells, and the amount is additionally correlated with the expression of DDX39A, encoding a splicing factor. Synovial fluid-derived monocytes from patients with spondyloarthritis are enriched for IL7R+ cells with a unique transcriptional profile that overlaps with IL-7-induced gene sets. Our data thus suggest a previously unappreciated function for monocytes in IL-7 biology and IL7R-associated diseases.


Conflict of interest statement

The authors declare no competing interests.

Figures

Fig. 1
Fig. 1
LPS induces profound monocyte IL7R cell surface expression. a Representative flow cytometry plots from live gated positively selected CD14 monocytes from one individual where cells were incubated for 24 h alone (top panel) or in presence of LPS (bottom panels). b Violin plot demonstrating significant induction of IL7R+ monocytes in paired cultures of positively selected monocytes (Monocyte IL7R+ post LPS- median: 23.8, min: 6.5, max: 55.8, IQR: 15.6–34.9%; n = 84, paired t-test). c Comparative effects of LPS on IL7R+  counts across CD14+ monocytes, CD4+ and CD8+ T cells, and CD56+ NK cells from the same PBMC cultures, untreated or with LPS for 24 h (PBMC IL7R+ post LPS-median: 29.9%, min: 5.9, max: 66.40, IQR: 22.3–40.0; n = 103, paired t-test). d Pearson correlation analyses were performed between indicated cells and treatments on number of IL7R+ cells. ***P < 0.001, **P < 0.01. e Comparative induction of IL7R+ monocytes from 6 individuals with monocytes treated for 24 h with either the TLR7 agonist Imiquimod, TLR1/2 agonist Pam3CysK4 or TLR4 agonist LPS (paired t-tests). Error bars show mean, IQR, min and max. f Array derived RNA expression of TNF at 2 h LPS assayed versus RNA expression of IL7R from monocytes from same individuals at 24 h LPS. g Comparative incubation of monocytes alone (n = 69), with LPS or with LPS + anti-TNF monoclonal antibody (Infliximab). Incubation with TNF antagonist significantly reduces LPS induced IL7R+ monocyte counts (paired t-test). h Violin plots of responses across cell types of PBMCs treated with TNF alone leads to significant induction of IL7R+ monocytes and significantly reduces CD4 and CD8 T cell IL7R+ positivity (n = 78, paired t-test). Source data are provided as a Source Data file
Fig. 2
Fig. 2
rs6897932 specifically regulates monocyte cell surface IL7R levels. a Microarray data demonstrating eQTL to IL7R noted at rs931555 after both 2 and 24 h treatment with LPS (2 h LPS: n = 261, 24 h LPS n = 322). b Local association plot for monocyte IL7R after exposure to LPS from positively selected monocytes demonstrates peak association to rs6897932 (n = 84). c Batch corrected log values for surface IL7R from positively selected monocytes demonstrating significant effect of rs6897932 carriage after stimulation in comparison to baseline monocytes (n = 84, ANOVA for linear model). d Surface IL7R in PBMCs across cell subsets after exposure to LPS. (n = 87, Note a significant effect of rs6897932 on surface IL7R is only observed in CD14+ monocytes, ANOVA for linear model). e As per d but PBMCs treated with TNF for 24 h (n = 62). Error bars show mean, IQR, min, and max. Source data are provided as a Source Data file
Fig. 3
Fig. 3
Monocyte-derived soluble IL7R is regulated by rs6897932 carriage and DDX39A expression. a ELISA of sIL7R performed on supernatants of monocytes treated with LPS for 24 h. Samples were randomly chosen from original eQTL dataset and genotypes revealed post-hoc – a significant association was observed at rs6897932 (n = 161, ANOVA for linear model). b ELISA data from a showing additional effect of rs931555 genotype on sIL7R (linear model). c Correlation analysis performed between 15421 microarray probes and soluble IL7R (y-axis) identified DDX39A expression (x-axis) to be significantly anti-correlated with soluble IL7R levels, supporting evidence for its regulation of soluble IL7R. Trend lines indicate correlation by allele, with rho and P-value for all data (n = 161, Spearman rank analysis). d ELISA of sIL7R from isolated primary CD14+ and CD4+ cells cultured for 24 h either alone or in the presence of LPS, LPS + IL-7 and CD3/CD28 activating beads. (n = 6). e ELISA of sIL7R from isolated primary CD14+ cultured for 24 h either alone, in the presence of TNF or in the presence of LPS (n = 5, ANOVA). Error bars show mean, IQR, min and max. Source data are provided as a Source Data file
Fig. 4
Fig. 4
Monocyte surface IL7R is functional, activating multiple transcriptional pathways. a Violin plot demonstrating monocytes from PBMC cultures in the untreated state, after exposure to LPS and after exposure to LPS with recombinant IL-7. IL-7 leads to marked downregulation of IL7R on LPS stimulated monocytes, indicative sensitivity to exogenous cytokine (paired t-test). b Volcano plot of mRNA from RNAseq experiments of 8 paired monocyte samples either treated with LPS alone for 24 h or with LPS with additional IL-7 added for the last 2 h of culture. Treatment leads to widespread differential transcript expression with the most significant 20 transcripts labelled. c Example boxplots of genes differentially regulated by recombinant IL-7 in monocytes (linear model). d t-SNE plot of single-cell real-time quantitative PCR (RT-qPCR) data from 10 individuals (1218 cells) either untreated or in the presence LPS showing expression of membrane-bound IL7R (IL7Rmb), soluble IL7R (sIL7R), CLEC4E, TNF, CUX1, AKT1, STAB1, CD163, CSF1R, CCL5, DDX39A, DDX39B, MALAT1, LTB, IFNB1, CD14, FCGR3B, LYZ, and ACTB. e Density plots of single-cell RT-qPCR expression of sIL7R and mbIL7R normalized expression in untreated and LPS treated monocytes according to rs6897932 genotype. Kolmogorov Smirnov test. f Violin plots of single-cell RT-qPCR expression of MALAT1 in LPS stimulated monocytes either alone or in the presence of recombinant human IL-7 according to rs6897932 genotype, t-test
Fig. 5
Fig. 5
IL7R+ monocytes form a distinct subset detectable in synovial fluid. a Representative flow cytometry of IL7R staining of spondyloarthritis matched patient PBMC (left) and SFMC (middle isotype control, right) gated on CD3-CD14+ as per sequential gating strategy shown in Supplementary Fig. 1. b Results from 4 patients demonstrating comparative monocyte IL7R staining in matched PBMC and SFMC using flow cytometry. c t-SNE clustering of monocytes from single-cell RNA sequencing of spondyloarthritis patient SFMC showing 5 clusters (n = 3). d Single-cell monocyte expression of IL7R, LTB, CD14, CCL5, IL32, and TCF7 overlaid on t-SNE clustering in c. e Volcano plot of genes significantly upregulated in the SFMC monocyte cluster 4 compared to all other SFMC monocyte clusters with top 20 genes annotated. Wilcoxon rank sum test. f Heatmap of top 10 genes from the each of the five SFMC monocyte clusters identified in c

References

    1. Gregory SG, et al. Interleukin 7 receptor α chain (IL7R) shows allelic and functional association with multiple sclerosis. Nat. Genet. 2007;39:1083–1091. doi: 10.1038/ng2103. - DOI - PubMed
    1. Cortes A, et al. Identification of multiple risk variants for ankylosing spondylitis through high-density genotyping of immune-related loci. Nat. Genet. 2013;45:730–738. doi: 10.1038/ng.2667. - DOI - PMC - PubMed
    1. Nakamura M, et al. Genome-wide association study identifies TNFSF15 and POU2AF1 as susceptibility loci for primary biliary cirrhosis in the Japanese population. Am. J. Hum. Genet. 2012;91:721–728. doi: 10.1016/j.ajhg.2012.08.010. - DOI - PMC - PubMed
    1. Lundstrom W, et al. Soluble IL7R potentiates IL-7 bioactivity and promotes autoimmunity. Proc. Natl Acad. Sci. USA. 2013;110:E1761–E1770. doi: 10.1073/pnas.1222303110. - DOI - PMC - PubMed
    1. Fairfax BP, et al. Innate immune activity conditions the effect of regulatory variants upon monocyte gene expression. Science. 2014;343:1246949. doi: 10.1126/science.1246949. - DOI - PMC - PubMed

Publication types

MeSH terms