. 2019 Oct 8;10(1):4560.
doi: 10.1038/s41467-019-12478-x.

Hypothalamic neuronal circuits regulating hunger-induced taste modification

Affiliations

Hypothalamic neuronal circuits regulating hunger-induced taste modification

Ou Fu et al. Nat Commun. .

Abstract

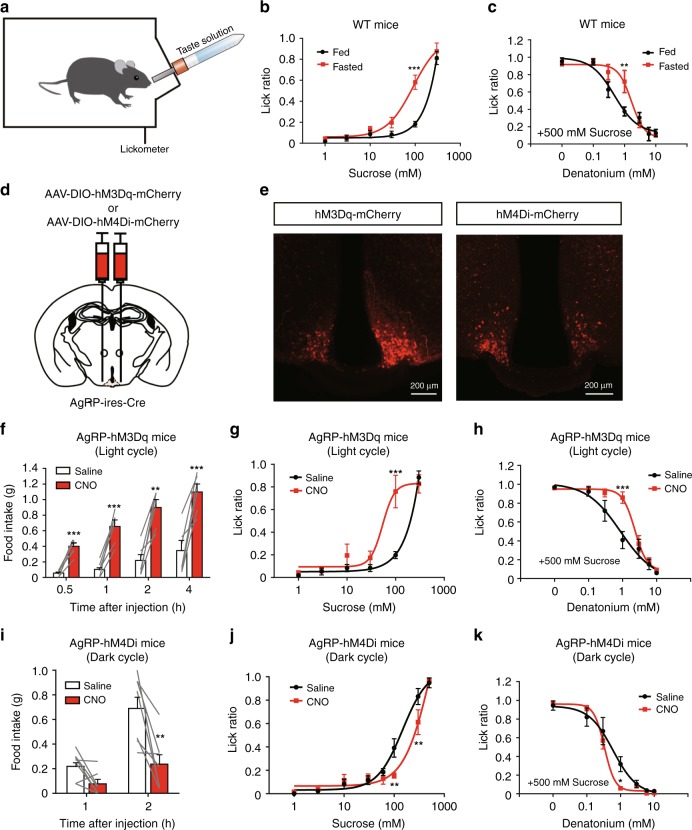
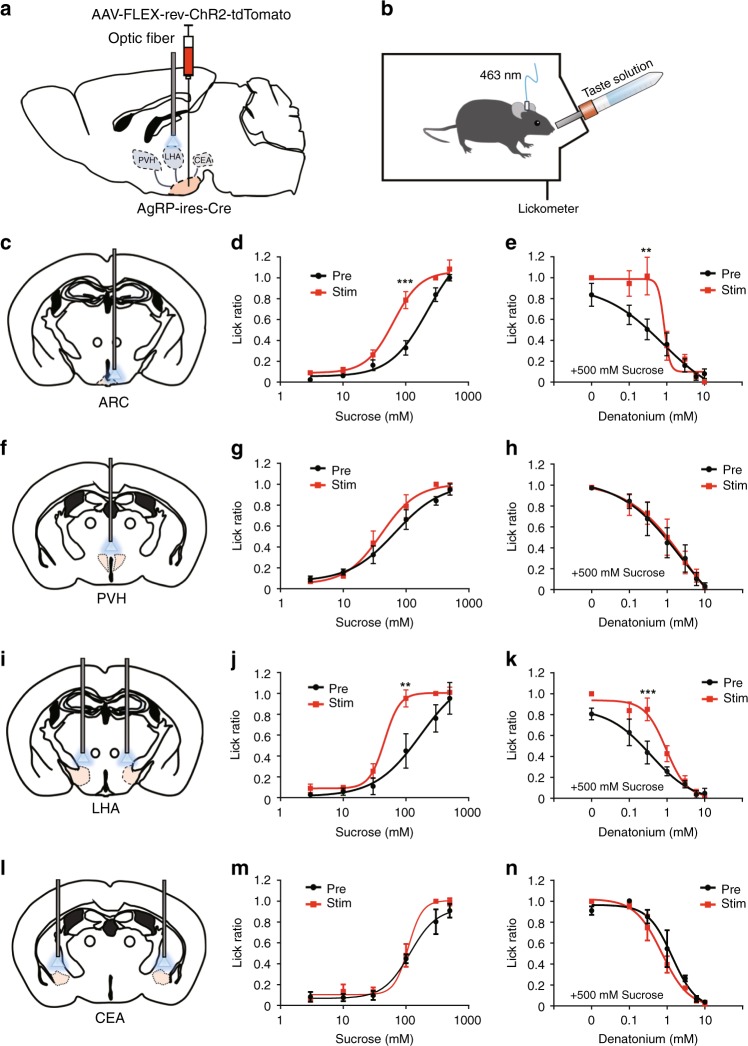
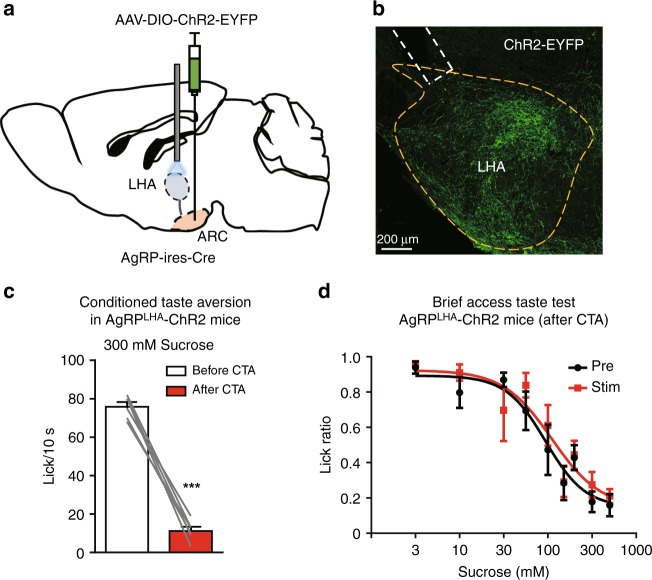
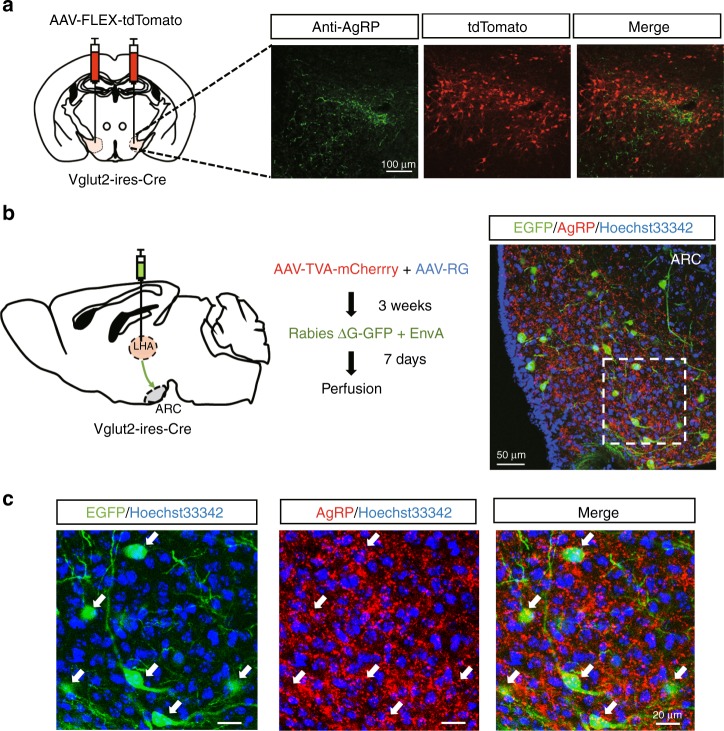
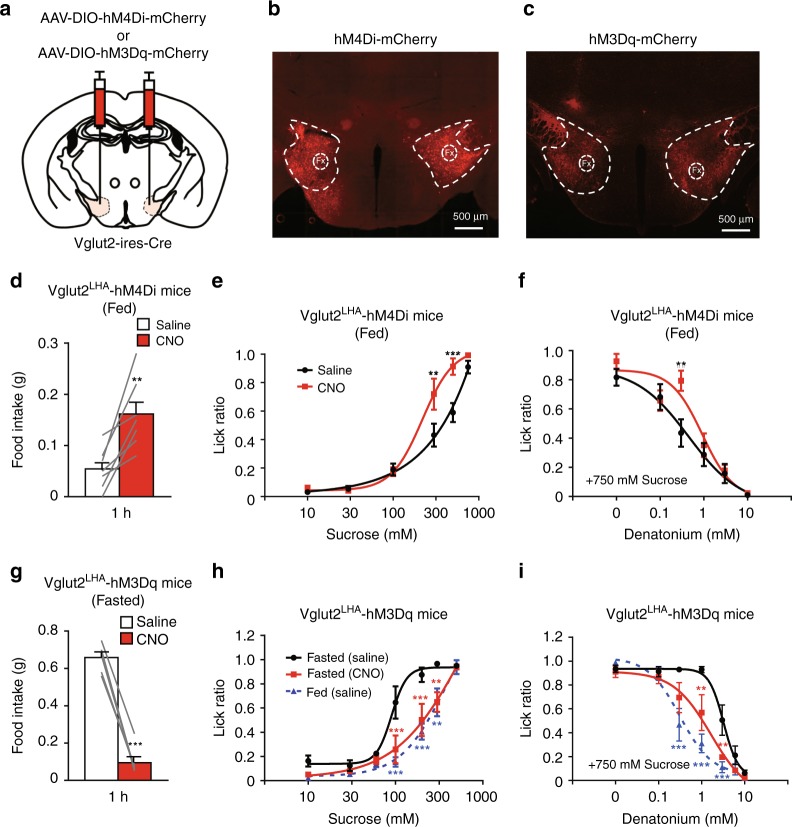
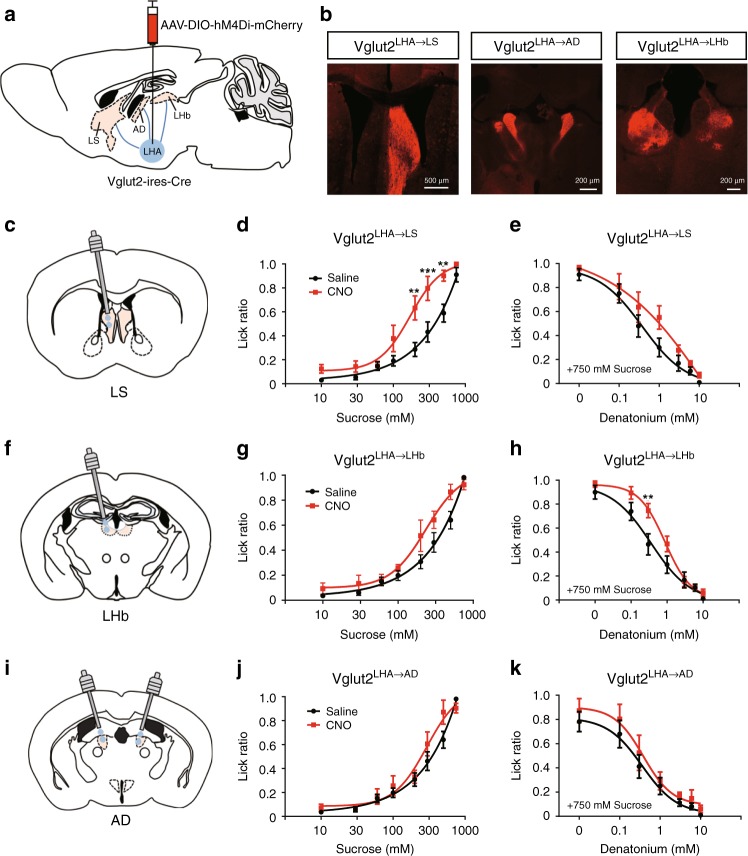
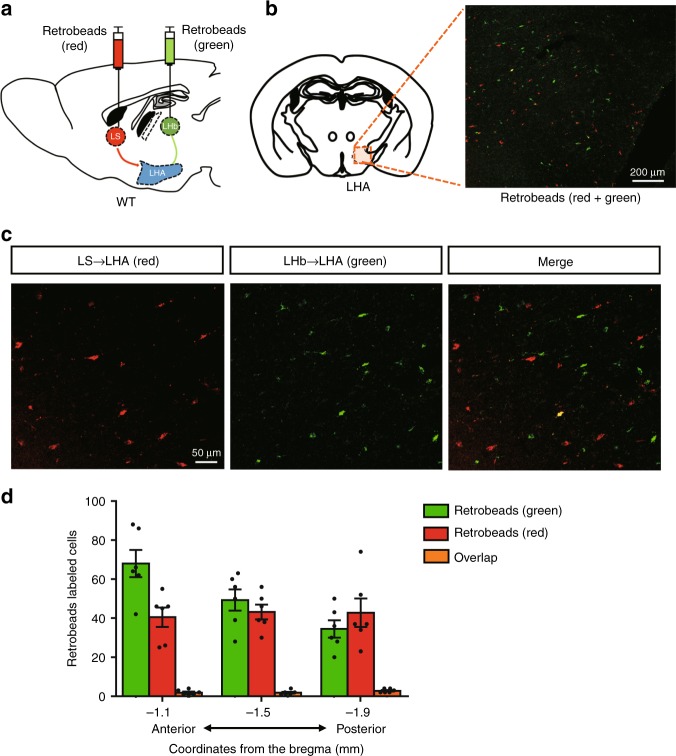
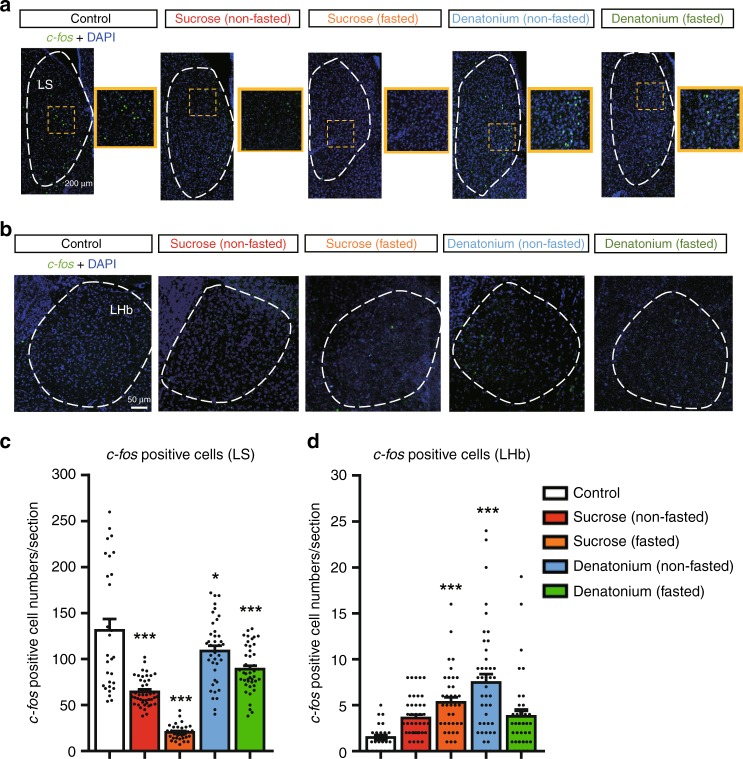
The gustatory system plays a critical role in sensing appetitive and aversive taste stimuli for evaluating food quality. Although taste preference is known to change depending on internal states such as hunger, a mechanistic insight remains unclear. Here, we examine the neuronal mechanisms regulating hunger-induced taste modification. Starved mice exhibit an increased preference for sweetness and tolerance for aversive taste. This hunger-induced taste modification is recapitulated by selective activation of orexigenic Agouti-related peptide (AgRP)-expressing neurons in the hypothalamus projecting to the lateral hypothalamus, but not to other regions. Glutamatergic, but not GABAergic, neurons in the lateral hypothalamus function as downstream neurons of AgRP neurons. Importantly, these neurons play a key role in modulating preferences for both appetitive and aversive tastes by using distinct pathways projecting to the lateral septum or the lateral habenula, respectively. Our results suggest that these hypothalamic circuits would be important for optimizing feeding behavior under fasting.


Conflict of interest statement

The authors declare no competing interests.

Figures

Fig. 1
Fig. 1
Chemogenetic activation of AgRP neurons induces changes in taste preference. a Schematic image of the brief access taste test. The number of licks is measured during 10 s from the first lick. b, c Sweet (b) or bitter (c) taste preferences in fed or fasted mice. Sucrose or denatonium–sucrose solutions were presented to fed or 23-h-fasted C57BL/6J WT mice. n = 6, F = 17.81, and P = 9.4 × 10–5 in b and n = 6, F = 4.14, and P = 0.045 in c, two-way ANOVA with Bonferroni post hoc test. d Bilateral injection of AAV encoding Cre-dependent hM3Dq-mCherry or hM4Di-mCherry into the arcuate nucleus (ARC) of AgRP-ires-Cre mouse. e Representative image showing hM3Dq-mCherry-expressing AgRP neurons (left) in the AgRP-hM3Dq mouse and hM4Di-mCherry-expressing AgRP neurons (right) in the AgRP-hM4Di mouse. f Chemogenetic activation of AgRP neurons led to acute food intake in AgRP-hM3Dq mice during the light period. n = 6, paired Student’s t test. g, h Brief access taste tests for sweet (g) or bitter (h) measured in AgRP-hM3Dq mice treated with saline or CNO (1.0 mg/kg i.p.) during the light cycle. n = 6, F = 8.783, and P = 0.0045 in g and n = 6, F = 7.929, and P = 0.0064 in h, two-way ANOVA with Bonferroni post hoc test. i Chemogenetic inhibition of AgRP neurons led to a reduction of food intake in AgRP-hM4Di mice during the dark cycle. n = 7, paired Student’s t test. j, k Brief access taste tests for sweet (j) or bitter (k) measured in AgRP-hM4Di mice treated with saline or CNO (1.0 mg/kg i.p.) during the dark cycle. n = 7, F = 4.748, and P = 0.032 in j and n = 7, F = 4.761, and P = 0.032 in k, two-way ANOVA with Bonferroni post hoc test. The experiments were carried out with 8- to 16-week-old male mice. Data are given as means ± SEM. *P < 0.05, **P < 0.01, ***P < 0.001
Fig. 2
Fig. 2
Optogenetic activation of LHA-projecting AgRP neurons modulates taste preferences. a AAV-FLEX-rev-ChR2-tdTomato was bilaterally injected into the ARC of AgRP-ires-Cre mice, and optical fibers were placed above the projection regions of AgRP neurons. b Schematic image of the brief access taste test during in vivo optogenetic activation of AgRP axon terminals in AgRP-ChR2 mice. ce Brief access taste tests toward sweet (d) or bitter (e) solutions during photostimulation of the soma of AgRPARC neurons. n = 11, F = 19.41, and P = 2.8 × 10–5 in d and n = 11, F = 6.926, and P = 0.01 in e, two-way ANOVA with Bonferroni post hoc test. fn Brief access taste tests for sweet and bitter solutions when exclusively activating PVH-projecting (fh), LHA-projecting (ik), and CEA-projecting (ln) AgRP neurons, respectively. n = 6, F = 2.263, and P = 0.138 in g, n = 6, F = 0.2445, and P = 0.87 in h, n = 5, F = 11.42, and P = 0.0015 in j, n = 5, F = 13.88, and P = 0.0005 in k, n = 5, F = 3.174, and P = 0.081 in m, and n = 5, F = 1.729, and P = 0.194 in n, two-way ANOVA with Bonferroni post hoc test. All experiments were carried out with 10- to 16-week-old male mice. Data are given as means ± SEM. *P < 0.05, **P < 0.01, ***P < 0.001, as compared with the corresponding control group
Fig. 3
Fig. 3
LHA-projecting AgRP neurons do not affect sweet taste sensitivity after CTA. a Schematic image of the injection of AAV-DIO-ChR2-EYFP into the ARC with bilateral optic fiber insertion above the LHA for photostimulation in the AgRP-ChR2-EYFP mouse. b Representative image showing ChR2-EYFP expression at axon terminals of AgRP neurons in the LHA and the approximate placement of an optic fiber (dashed lines). c Licks for 300 mM sucrose in 10 s before and after CTA conditioning. n = 6, paired Student’s t test. d Brief access taste tests for sucrose solution in the presence or absence of optogenetic activation of LHA-projecting AgRP neurons after CTA conditioning. n = 6, F = 1.272, and P = 0.262, two-way ANOVA with Bonferroni post hoc test. All experiments were carried out with 10- to 16-week-old male mice. Data are given as means ± SEM. ***P < 0.001
Fig. 4
Fig. 4
AgRP neurons connect to parts of the glutamatergic Vglut2-expressing neurons in the LHA. a Representative immunohistochemical image of a coronal section of AgRP axon terminals (green) and Vglut2 neurons (red) in the LHA. Vglut2 neurons were labeled with mCherry by injection of AAV-FLEX-tdTomato in the LHA of Vglut2-ires-Cre mice. b Schematic image of the monosynaptic rabies tracing of Vglut2 neurons in the LHA (left) and a brain section after monosynaptic-tracing neurons in the ARC that are synaptically connected to Vglut2LHA neurons in the ARC (right). c Enlarged view of ARC neurons that are monosynaptically connected to Vglut2LHA neurons (green) and AgRP immunostaining (red) in the ARC. Arrows show parts of AgRP neurons monosynaptically connected to Vglut2LHA neurons
Fig. 5
Fig. 5
Vglut2 neurons are necessary for hunger-induced modulation of taste preference. a Bilateral injection of AAV-DIO-hM4Di-mCherry or AAV-DIO-hM3Dq-mCherry into the LHA of Vglut2-ires-Cre mice. bc Representative images of hM4Di-mCherry (b) and hM3Dq-mCherry (c) expression in Vglut2LHA neurons. Fx, fornix. d Chemogenetic inhibition (CNO 1.0 mg/kg i.p.) of Vglut2 neurons in the LHA promotes food intake in Vglut2-hM4Di mice within 1 h n = 7, paired Student’s t test. ef Brief access tests with sweet (e) and bitter (f) taste solutions in Vglut2LHA-hM4Di mice in the presence or absence of CNO (1.0 mg/kg i.p.). n = 6, F = 11.99, and P = 0.001 in e and n = 6, F = 5.37, and P = 0.023 in f, two-way ANOVA with Bonferroni post hoc test. g Chemogenetic activation (CNO 1.0 mg/kg i.p.) of Vglut2 neurons in the LHA led to a decrease in 1-h food intake in 23-h-fasted Vglut2LHA-hM3Dq mice. hi Brief access test with sweet (h) and bitter (i) taste solutions in Vglut2LHA-hM3Dq mice under fed or 23-h-fasted conditions in the presence or absence of CNO (1.0 mg/kg i.p.). n = 6, F = 21.77, and P = 1.5 × 10–8 in h and n = 6, F = 19.51, and P = 1.1 × 10–7 in i, two-way ANOVA with Bonferroni post hoc test. All experiments were carried out with 10- to 16-week-old male mice. Data are given as means ± SEM. *P < 0.05, **P < 0.01, ***P < 0.001, as compared with the saline group (dg) and with the fasted (saline) group (hi)
Fig. 6
Fig. 6
Two distinct hypothalamic pathways contribute to the modulation of sweet and bitter preferences. a Injection of AAV-DIO-hM4Di-mCherry into the LHA of Vglut2-ires-Cre mice. b Representative image of the projection regions (LS, AD, and LHb) of Vglut2LHA neurons. ck Brief access taste tests after local inhibition of Vglut2LHA neurons projecting to the LS (c), LHb (f), or AD (i) by microinfusion of CNO, respectively. Preferences toward sweet taste (d, g, j) or bitter taste (e, h, k) were evaluated 10 min after microinjection of CNO (0.1 mg/ml, 200 nl). n = 6, F = 34.32, and P = 8.9 × 10–8 in d, n = 6, F = 4.768, and P = 0.0326 in e, n = 6, F = 7.727, and P = 0.0071 in g, n = 6, F = 13.44, and P = 0.0005 in h, n = 5, F = 3.564, and P = 0.063 in j, and n = 5, F = 2.823, and P = 0.098 in k, two-way ANOVA with Bonferroni post hoc test. All experiments were carried out with 10- to 16-week-old male mice. Data are given as means ± SEM. *P < 0.05, **P < 0.01, ***P < 0.001
Fig. 7
Fig. 7
Different neuronal populations in the LHA project to the LS and LHb. a Schematic image of the retrobead injections into the LS (red) and LHb (green) in WT mice. b Retrograde transport of redbeads (from the LS) and green beads (from the LHb) in the LHA. c Representative enlarged confocal image of redbead-labeled cells (from the LS) and greenbead-labeled cells (from the LHb) in the LHA. d Quantification of red and green retrobead-labeled cells in the LHA along the anterior–posterior axis. Retrobead-positive cells were counted in three sections at different AP locations from n = 2 mice. Data are given as means ± SEM
Fig. 8
Fig. 8
Fasting differentially affects taste-induced c-fos expression in the LS and the LHb. a, b Representative images showing c-fos-positive cells in the LS (a) and in the LHb (b). c, d Quantification of c-fos-positive cells in the LS (c) and in the LHb (d). The mice were treated with sucrose or bitter taste under fed or fasted conditions. n = 3–5 mice per group and ~10 brain slices per mouse were analyzed. F = 51.25 and P = 4.9 × 10–8 in c, F = 11.1 and P = 0.0069 in d, one-way ANOVA with Dunnett’s post hoc test. All experiments were carried out with 10- to 16-week-old male mice. Data are given as means ± SEM. *P < 0.05, **P < 0.01, ***P < 0.001 as compared with the control group

References

    1. Berthoud HR. Metabolic and hedonic drives in the neural control of appetite: who is the boss? Curr. Opin. Neurobiol. 2011;21:888–896. doi: 10.1016/j.conb.2011.09.004. - DOI - PMC - PubMed
    1. Augustine V, Gokce SK, Oka Y. Peripheral and central nutrient sensing underlying appetite regulation. Trends Neurosci. 2018;41:526–539. doi: 10.1016/j.tins.2018.05.003. - DOI - PMC - PubMed
    1. Roper SD, Chaudhari N. Taste buds: cells, signals and synapses. Nat. Rev. Neurosci. 2017;18:485–497. doi: 10.1038/nrn.2017.68. - DOI - PMC - PubMed
    1. Yarmolinsky DA, Zuker CS, Ryba NJP. Common sense about taste: from mammals to insects. Cell. 2009;139:234–244. doi: 10.1016/j.cell.2009.10.001. - DOI - PMC - PubMed
    1. Hanci D, Altun H. Hunger state affects both olfactory abilities and gustatory sensitivity. Eur. Arch. Otorhinolaryngol. 2016;273:637–1641. - PubMed

Publication types

Substances

LinkOut - more resources