. 2019 Aug 22;15(11):2282-2295.
doi: 10.7150/ijbs.32899. eCollection 2019.

A robust 6-mRNA signature for prognosis prediction of pancreatic ductal adenocarcinoma

Affiliations

A robust 6-mRNA signature for prognosis prediction of pancreatic ductal adenocarcinoma

Chenhao Zhou et al. Int J Biol Sci. .

Abstract

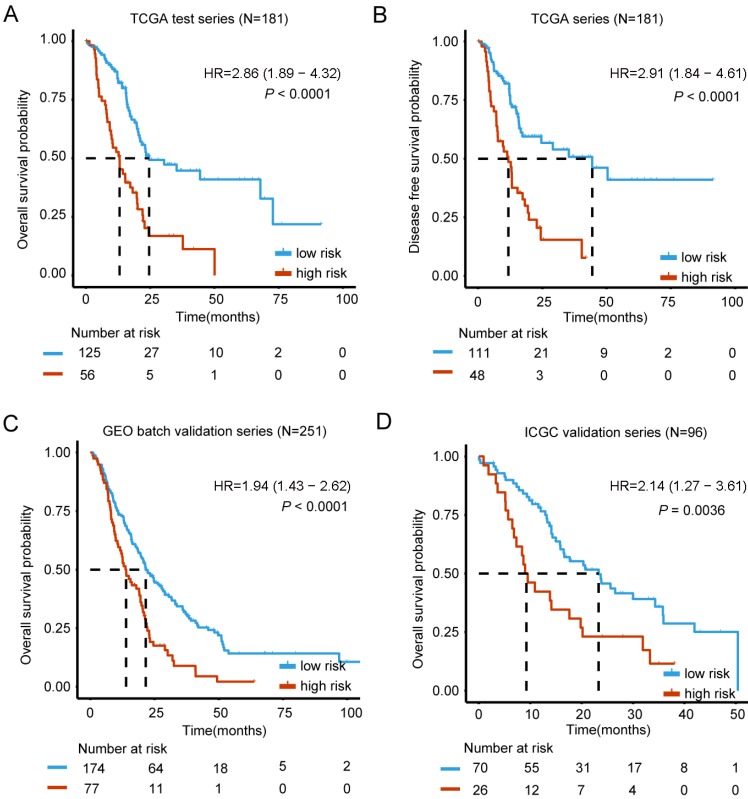
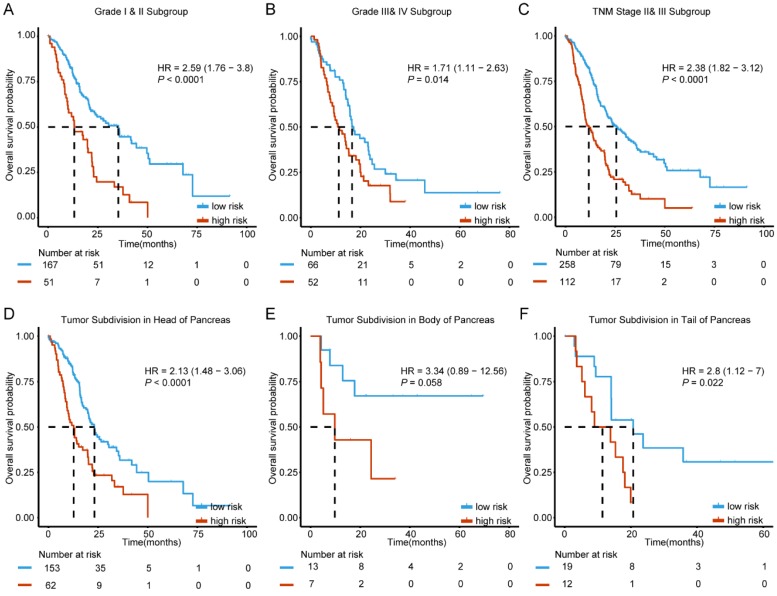
Pancreatic ductal adenocarcinoma (PDAC) is one of the most fatal malignancies worldwide. PDAC prognostic and diagnostic biomarkers are still being explored. The aim of this study is to establish a robust molecular signature that can improve the ability to predict PDAC prognosis. 155 overlapping differentially expressed genes between tumor and non-tumor tissues from three Gene Expression Omnibus (GEO) datasets were explored. A least absolute shrinkage and selection operator method (LASSO) Cox regression model was employed for selecting prognostic genes. We developed a 6-mRNA signature that can distinguish high PDAC risk patients from low risk patients with significant differences in overall survival (OS). We further validated this signature prognostic value in three independent cohorts (GEO batch, P < 0.0001; ICGC, P = 0.0036; Fudan, P = 0.029). Furthermore, we found that our signature remained significant in patients with different histologic grade, TNM stage, locations of tumor entity, age and gender. Multivariate cox regression analysis showed that 6-mRNA signature can be an independent prognostic marker in each of the cohorts. Receiver operating characteristic curve (ROC) analysis also showed that our signature possessed a better predictive role of PDAC prognosis. Moreover, the gene set enrichment analysis (GSEA) analysis showed that several tumorigenesis and metastasis related pathways were indeed associated with higher scores of risk. In conclusion, identifying the 6-mRNA signature could provide a valuable classification method to evaluate clinical prognosis and facilitate personalized treatment for PDAC patients. New therapeutic targets may be developed upon the functional analysis of the classifier genes and their related pathways.

Keywords: Pancreatic ductal adenocarcinoma; molecular signature; survival.


Conflict of interest statement

Competing Interests: The authors have declared that no competing interest exists.

Figures

Figure 1
Figure 1
Differentially expressing analyses of genes in GEO datasets. (A) Identification of 155 commonly changed differentially expressed genes (DEGs) from three cohort profile datasets (GSE15471, GSE28735 and GSE62452). Different color areas represent different datasets. The cross areas showed the commonly changed DEGs. DEGs were identified with classical t test; statistically significant DEGs were defined with P< 0.001 and |log2 fold change|> 1 as the cut-off criteria. (B) Volcano plots of the DEGs in GSE15471. Among 1265 DEGs, 1128 were up-regulated and 137 were down-regulated. (C) Volcano plots of the DEGs in GSE28735. Among 350 DEGs, 131 were up-regulated and 219 were down-regulated. (D) Volcano plots of the DEGs in GSE62452. Among 229 DEGs, 157 were up-regulated and 72 were down-regulated.
Figure 2
Figure 2
Kaplan-Meier estimates of the overall survival (OS) or disease free survival (DFS) using the six-mRNA signature. The Kaplan-Meier plots were used to visualize the OS or DFS probabilities for the low-risk versus high-risk group of patients based on the best cut-off points (0.1868) of risk score from corresponding TCGA, GEO, ArrayExpress or ICGC datasets. (A) Kaplan-Meier curves for OS in TCGA test series patients (N= 181); (B) Kaplan-Meier curves for DFS in TCGA series patients (N= 181) (C) Kaplan-Meier curves for OS in GEO batch validation series patients (N= 251); (D) Kaplan-Meier curves for OS in ICGC validation series patients (N= 96). The tick marks on the Kaplan-Meier curves represent the censored subjects. The differences between the two curves were determined by the two-side log-rank test. The number of patients at risk was listed below the survival curves.
Figure 3
Figure 3
Forest plot summary of analyses of overall survival (OS). Univariable and multivariable analyses of the six-mRNA risk score, age, gender, histological grade and TNM stage on TCGA (A, B), GEO batch (C, D) and ICGC datasets (E, F). The green squares on the transverse lines represent the hazard ratio (HR), and the red transverse lines represent 95% CI. Risk score and age are continuous variables, gender, histological grade and TNM stage are discontinuous variables.
Figure 4
Figure 4
Kaplan-Meier survival analysis to evaluate the independence of the six-mRNA signature from histological grade, TNM stage and tumor subdivision of pancreas. The patients from combined datasets were stratified into subgroups. The six-mRNA signature was applied to the low histological grade patients (A), high histological grade patients (B), TNM stage II and III patients (C), patients with tumor subdivision in head (D), body (E) and tail (F) of pancreas, separately. The number of patients at risk was listed below the survival curves. The tick marks on the Kaplan-Meier curves represent the censored subjects. The differences between the two curves were determined by the two-sided log-rank test.
Figure 5
Figure 5
Receiver operating characteristic (ROC) analysis of the sensitivity and specificity of the overall survival (OS) prediction by the six-mRNA risk score, age, histological grade, TNM stage and all combined factors in combined datasets patients (N= 528). P values were from the comparisons of the area under the ROC (AUROC) of all combined factors versus six-mRNA risk score, age, histological grade and TNM stage, respectively. As can be seen, the six-mRNA risk score combined with other factors showed a better prediction of OS than age (P < 0.0001), histological grade (P < 0.0001) and TNM stage (P < 0.0001).
Figure 6
Figure 6
Gene Set Enrichment Analysis Delineates Biological Pathways and Processes associated with risk score. Cytoscape and Enrichment Map were used for visualization of the GSEA results. Nodes represent enriched gene sets, which are grouped and annotated by their similarity according to related gene sets. Enrichment results were mapped as a network of gene sets (nodes). Node size was proportional to the total number of genes within each gene set. Proportion of shared genes between gene sets was represented as the thickness of the green line between nodes.

References

    1. Rahib L, Smith BD, Aizenberg R, Rosenzweig AB, Fleshman JM, Matrisian LM. Projecting cancer incidence and deaths to 2030: the unexpected burden of thyroid, liver, and pancreas cancers in the United States. Cancer research. 2014;74:2913–21. - PubMed
    1. Siegel RL, Miller KD, Jemal A. Cancer Statistics, 2017. CA: a cancer journal for clinicians. 2017;67:7–30. - PubMed
    1. Kamisawa T, Wood LD, Itoi T, Takaori K. Pancreatic cancer. Lancet (London, England) 2016;388:73–85. - PubMed
    1. Tomczak K, Czerwinska P, Wiznerowicz M. The Cancer Genome Atlas (TCGA): an immeasurable source of knowledge. Contemporary oncology. 2015;19:A68–77. - PMC - PubMed
    1. Cancer Genome Atlas Research Network. Electronic address aadhe, Cancer Genome Atlas Research N. Integrated Genomic Characterization of Pancreatic Ductal Adenocarcinoma. Cancer Cell. 2017;32(e13):185–203. - PMC - PubMed

Publication types