. 2019 Nov 15;8(11):2524-2535.
doi: 10.1021/acssynbio.9b00215. Epub 2019 Oct 18.

Model-Driven Engineering of N-Linked Glycosylation in Chinese Hamster Ovary Cells

Affiliations

Model-Driven Engineering of N-Linked Glycosylation in Chinese Hamster Ovary Cells

Christopher S Stach et al. ACS Synth Biol. .

Abstract

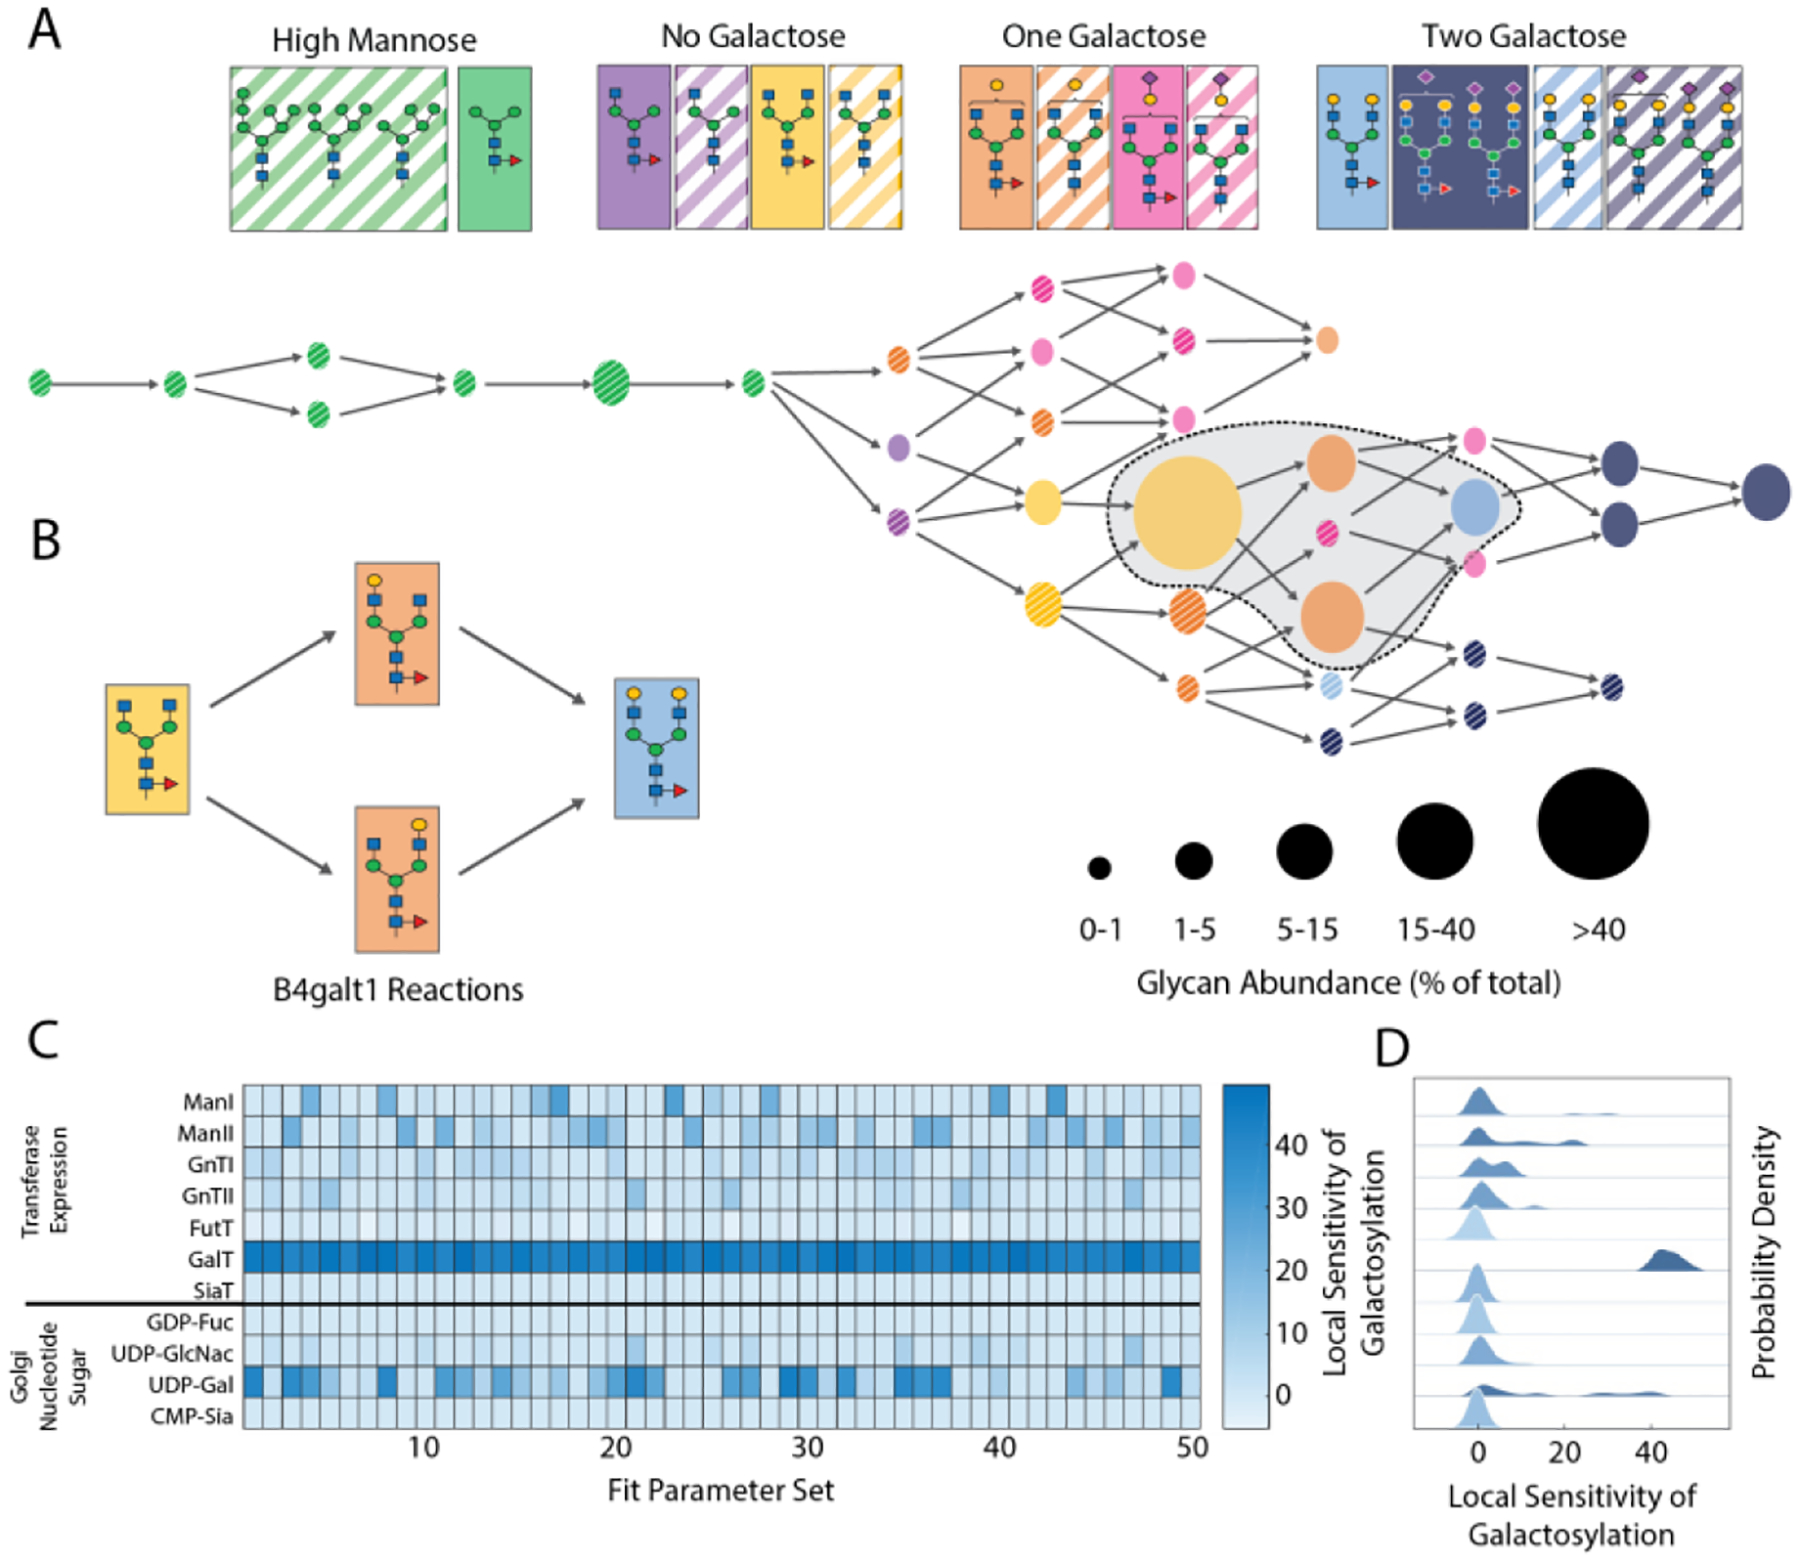
Chinese hamster ovary (CHO) cells are used for industrial production of protein-based therapeutics (i.e., "biologics"). Here we describe a method for combining systems-level kinetic models with a synthetic biology platform for multigene overexpression to rationally perturb N-linked glycosylation. Specifically, we sought to increase galactose incorporation on a secreted Immunoglobulin G (IgG) protein. We rationally design, build, and test a total of 23 transgenic cell pools that express single or three-gene glycoengineering cassettes comprising a total of 100 kilobases of engineered DNA sequence. Through iterative engineering and model refinement, we rationally increase the fraction of bigalactosylated glycans five-fold from 11.9% to 61.9% and simultaneously decrease the glycan heterogeneity on the secreted IgG. Our approach allows for rapid hypothesis testing and identification of synergistic behavior from genetic perturbations by bridging systems and synthetic biology.

Keywords: CHO cells; DNA assembly; IgG glycosylation; post-translational modification; systems-level modeling.


Conflict of interest statement

CONFLICT OF INTEREST

The authors declare no competing financial interest.

Figures

Figure 1.
Figure 1.
Design and assembly of glycoengineering cassettes. (A) Schematic illustration of model-based iterative glycoengineering. Synthetic Biology Open Language (SBOL) iconography is used to represent genetic constructs here and throughout this manuscript. (B) Genetic design of reporter construct with red fluorescent protein (rfp) internal reference standard (top) and relative expression data (bottom) for mammalian promoters and 3’-UTR elements used in glycoengineering constructs. The variant promoter and terminator positions are marked with dashed boxes. (C) Representative UPLC trace for glycan structures cleaved from IgG isolated from CHO-2C10 cells (sugar legend in D). (D) Systems-level schematic of N-linked protein glycosylation, including (i) NDP-sugar biosynthesis in the cytoplasm, (ii) transport into the ER/Golgi lumen, and (iii) oligosaccharide extension and remodeling. Coding sequences for genes underlined are included in the CDS library.
Figure 2.
Figure 2.
Model-driven design of single-gene overexpression constructs. (A) Baseline glycan profile in CHO-2C10 visualized using GlycoVis network. Nodes in the network diagram are colored according to the legend above, with node size denoting glycan abundance from the baseline UPLC analysis. Arrow (edges) represent known chemical transformations catalyzed by glycotransferases or mannosidases. (B) Structures of predominant glycans, corresponding to the shaded sub-network in (A). Arrows in (B) correspond to B4GalT1-catalyzed reactions. (C) Simulated sensitivity analysis of kinetic N-linked glycosylation model to perturbations in glycotransferase, mannosidase, or nucleotide-sugar concentration. Heatmap shows predicted sensitivity of galactose content in total glycan profile. Galactosylation is defined as percentage of ‘G1’ glycans plus 2x percentage of ‘G2’ glycans. (D) Probability density plot of local sensitivity analysis from (C), with plot order corresponding to rows in heatmap. Color intensity corresponds to mean sensitivity.
Figure 3.
Figure 3.
Single-gene overexpression and model refinement. (A) Glycan profile for CHO-2C10 and single-gene overexpression cells. Bars are colored according to glycan structure using the legend in Fig. 2 and are arranged to highlight the different total fractions of agalactosylated (‘G0’, left of dashed line) and mono- or bi-galactosylated glycans (‘G1’ and ‘G2’, respectively; right of dashed line). † denotes glycan analysis from triplicate experiments, * denotes significantly different galactose incorporation based on χ2-analysis, with p-value < 0.05 after Bonferonni correction for multiple comparisons (raw p-value < 0.0045). (B) Kinetic model robustness analysis for overexpression of UDP-galactose biosynthesis/transport genes and glycosyltransferases from single-gene overexpression experiment. Red and blue traces represent different parameter combinations, with blue indicated the down-selected subset carried forward to future modeling. (C) Principle components analysis of 50 parameter sets with points colored as in (B).
Figure 4.
Figure 4.
Model-driven multi-gene glycoengineering. (A) Kinetic modeling of the interdependence of UDP-galactose levels and galactosyltransferase activity on galactose incorporation levels. (B) Glycan profile of original CHO-2C10 and engineered cells with randomly integrated three-gene glycosylation constructs. Bars are colored according to glycan structure using the legend in Fig. 2 and are arranged to highlight the different total fractions of agalactosylated (‘G0’, left of dashed line) and mono- or bi-galactosylated glycans (‘G1’ and ‘G2’, respectively; right of dashed line). † denotes glycans measured from triplicate experiments, * denotes significantly different galactose incorporation based on χ2-analysis, with p-value < 0.05 after Bonferonni correction for multiple comparisons (raw p-value < 0.007). (C) Genomic location and organization of dual RMCE landing pad, including integration design for three-gene glycosylation constructs. (D) Glycan profile of original CHO-2C10 and engineered cell lines highlighting reproducibility of glycan perturbation following site-specific integration. n.s. denotes non-significant difference of swapping clones from randomly integrated B4GalT1-SLC35D1-GALK1 construct, based on χ2-analysis. All are significantly different from CHO-2C10.

References

    1. Walsh G Biopharmaceutical benchmarks 2014. Nat. Biotechnol 32, 992 (2014). - PubMed
    1. Browne SM & Al-Rubeai M Selection methods for high-producing mammalian cell lines. Trends Biotechnol. 25, 425–432 (2007). - PubMed
    1. Wells E & Robinson AS Cellular engineering for therapeutic protein production: product quality, host modification, and process improvement. Biotechnol. J 12, (2017). - PubMed
    1. Kornfeld R Assembly of Asparagine-Linked Oligosaccharides. Annu. Rev. Biochem 54, 631–664 (2002). - PubMed
    1. Helenius A & Aebi M Roles of N-Linked Glycans in the Endoplasmic Reticulum. Annu. Rev. Biochem 73, 1019–1049 (2004). - PubMed

Publication types