

Measuring Relationships Between Proactive Reporting State-level Prescription Drug Monitoring Programs and County-level Fatal Prescription Opioid Overdoses
- PMID: 31596794
- PMCID: PMC7027962
- DOI: 10.1097/EDE.0000000000001123
Measuring Relationships Between Proactive Reporting State-level Prescription Drug Monitoring Programs and County-level Fatal Prescription Opioid Overdoses
Abstract
Background: Prescription drug monitoring programs (PDMPs) that collect and distribute information on dispensed controlled substances have been adopted by nearly all US states. We know little about program characteristics that modify PDMP impact on prescription opioid (PO) overdose deaths.
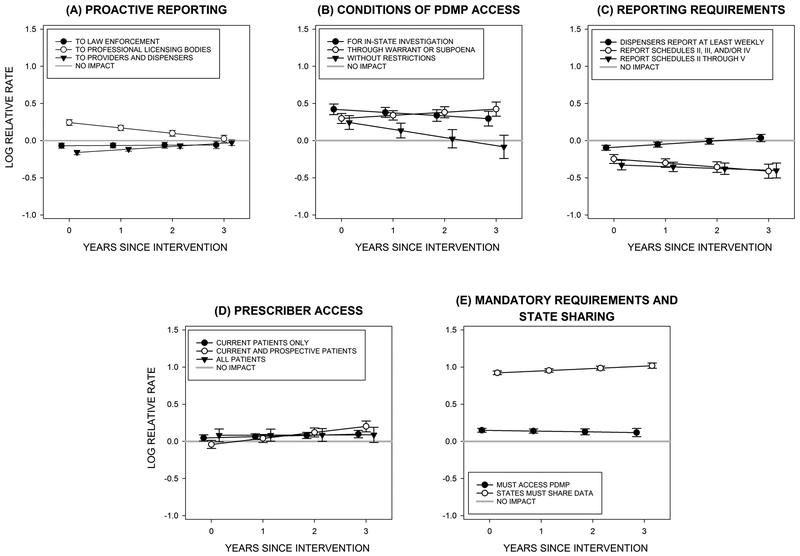
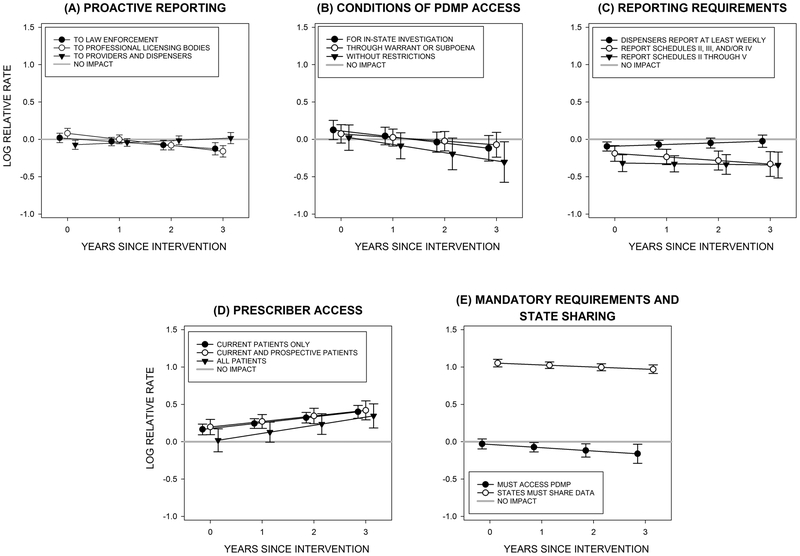
Methods: We measured associations between adoption of any PDMP and changes in fatal PO overdoses in 2002-2016 across 3109 counties in 49 states and D.C. We then measured changes related to the adoption of "proactive PDMPs," which report outlying prescribing/dispensing patterns and provide broader access to PDMP data by law enforcement. Comparisons were made within 3 time intervals that broadly represent the evolution of PDMPs (2002-2004, 2005-2009, and 2010-2016). We modeled overdoses using Bayesian space-time models.
Results: Adoption of electronic PDMP access was associated with 9% lower rates of fatal PO overdoses after three years (rate ratio [RR] = 0.91, 95% credible interval [CI]: 0.88-0.93) with well-supported effects for methadone (RR = 0.86,95% CI: 0.82-0.90) and other synthetic opioids (RR = 0.82, 95% CI: 0.77-0.86). Compared with states with no/weak PDMPs, proactive PDMPs were associated with fewer deaths attributed to natural/semi-synthetic opioids (2002-2004: RR = 0.72 [0.66-0.78]; 2005-2009: RR = 0.93 [0.90-0.97]; 2010-2016: 0.89 [0.86-0.92]) and methadone (2002-2004: RR = 0.77 [0.69-0.85]; 2010-2016: RR = 0.90 [0.86-0.94]). Unintended effects were observed for synthetic opioids other than methadone (2005-2009: RR = 1.29 [1.21-1.38]; 2010-2016: RR = 1.22 [1.16-1.29]).
Conclusions: State adoption of PDMPs was associated with fewer PO deaths overall while proactive PDMPs alone were associated with fewer deaths related to natural/semisynthetic opioids and methadone, the specific targets of these programs. See video abstract at, http://links.lww.com/EDE/B619.
Conflict of interest statement
Figures


References
-
- Rudd RA, Seth P, David F, Scholl L. Increases in Drug and Opioid-Involved Overdose Deaths - United States, 2010-2015. MMWR Morb Mortal Wkly Rep 2016;65(5051):1445–1452. - PubMed
-
- Kolodny A, Courtwright DT, Hwang CS, Kreiner P, Eadie JL, Clark TW, Alexander GC. The prescription opioid and heroin crisis: a public health approach to an epidemic of addiction. Annu Rev Public Health 2015;36:559–74. - PubMed
-
- CDC. Opioid Prescribing: Where you live matters CDC Vital Signs. Atlanta, GA: Centers for Disease Control and Prevention, 2017.
