. 2019 Oct 8;29(2):270-282.e5.
doi: 10.1016/j.celrep.2019.08.092.

Identification of a Paracrine Signaling Mechanism Linking CD34high Progenitors to the Regulation of Visceral Fat Expansion and Remodeling

Affiliations

Identification of a Paracrine Signaling Mechanism Linking CD34high Progenitors to the Regulation of Visceral Fat Expansion and Remodeling

Márcio Buffolo et al. Cell Rep. .

Abstract

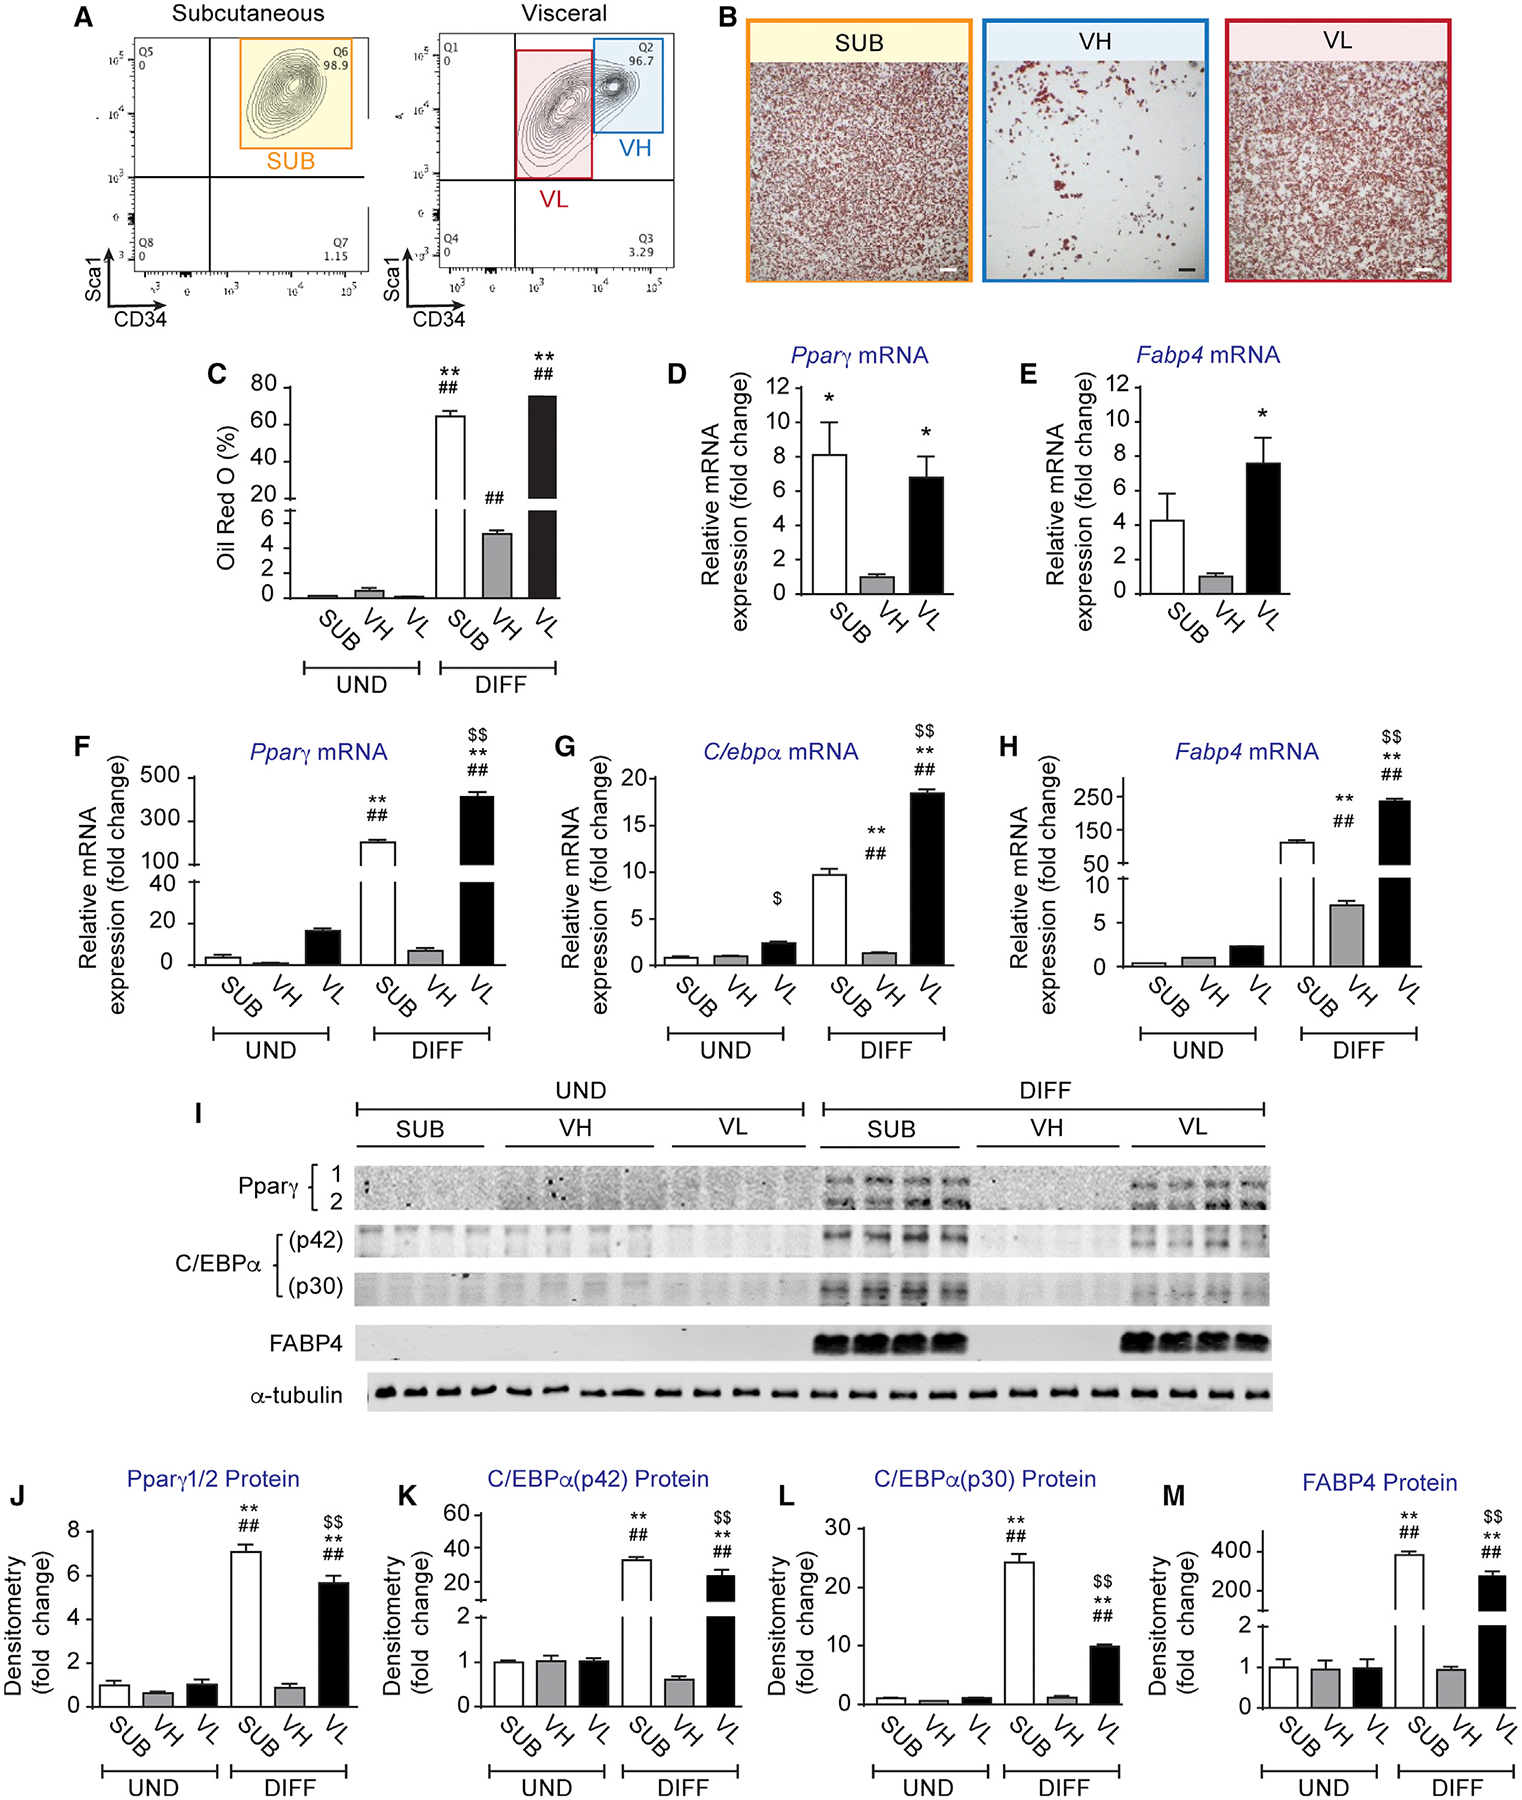
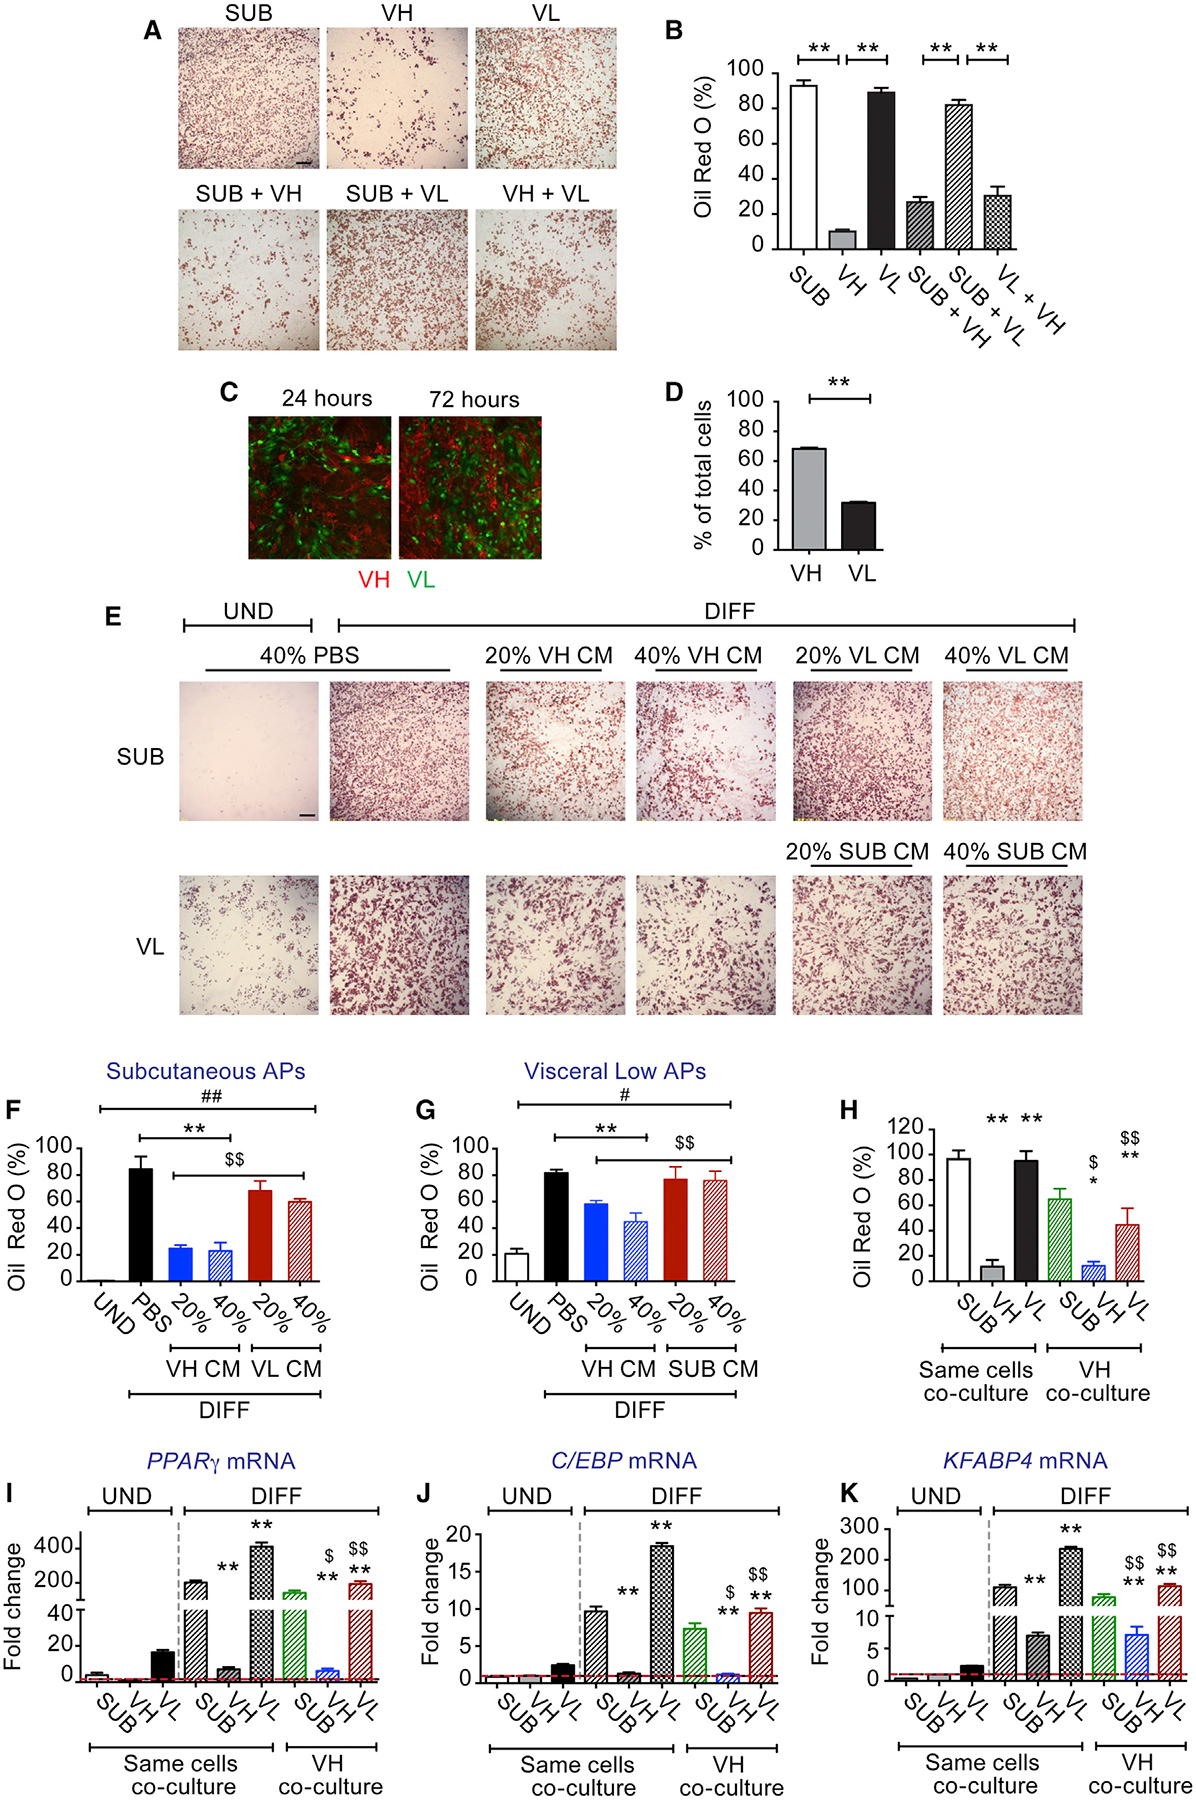
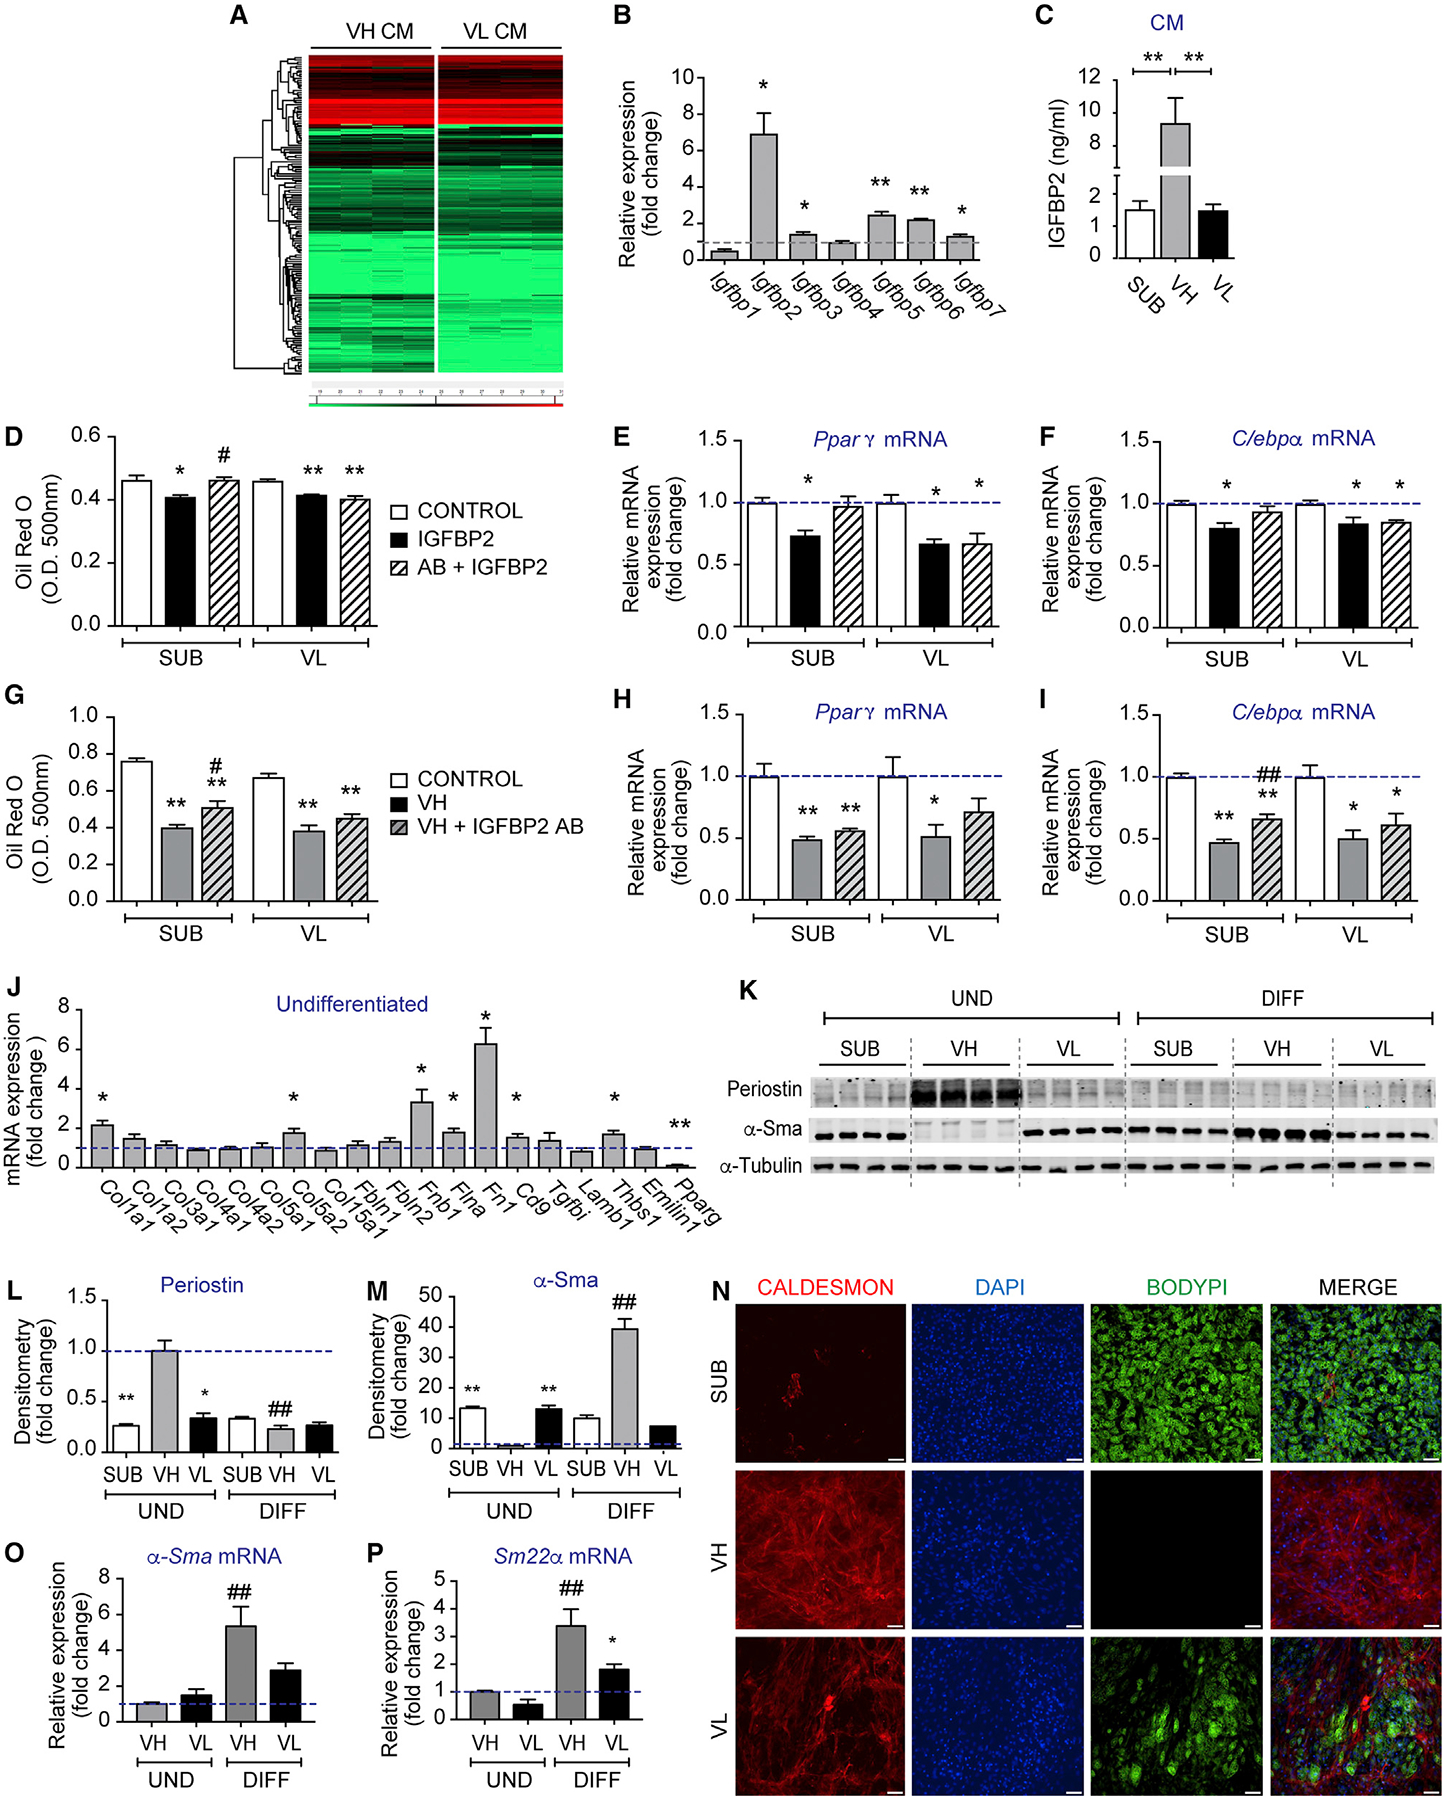
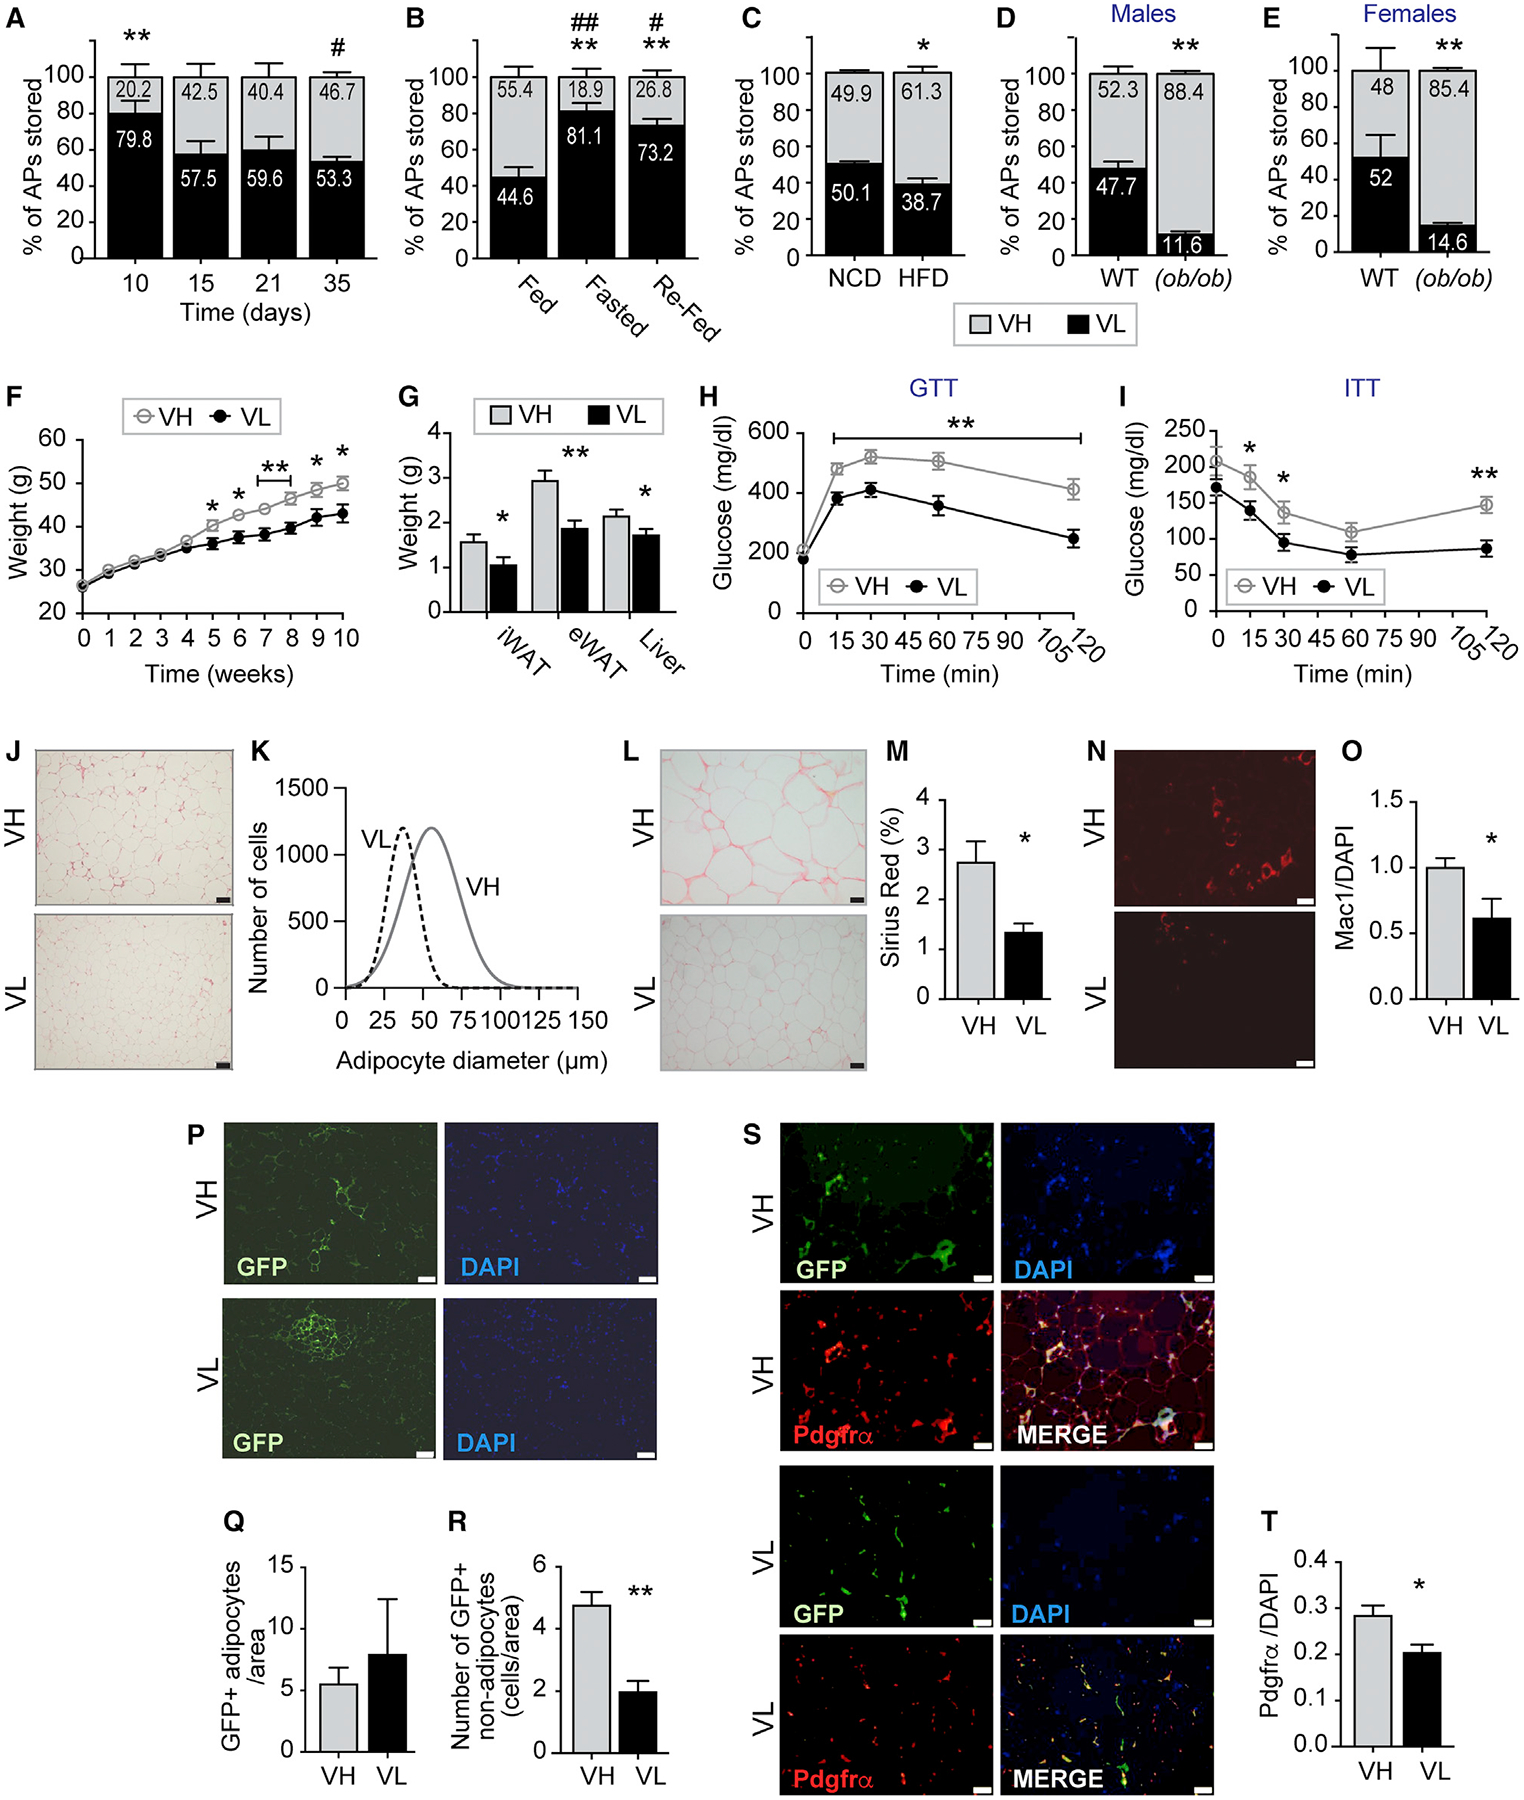
Accumulation of visceral (VIS) is a predictor of metabolic disorders and insulin resistance. This is due in part to the limited capacity of VIS fat to buffer lipids allowing them to deposit in insulin-sensitive tissues. Mechanisms underlying selective hypertrophic growth and tissue remodeling properties of VIS fat are not well understood. We identified subsets of adipose progenitors (APs) unique to VIS fat with differential Cd34 expression and adipogenic capacity. VIS low (Cd34 low) APs are adipogenic, whereas VIS high (Cd34 high) APs are not. Furthermore, VIS high APs inhibit adipogenic differentiation of SUB and VIS low APs in vitro through the secretion of soluble inhibitory factor(s). The number of VIS high APs increased with adipose tissue expansion, and their abundance in vivo caused hypertrophic growth, fibrosis, inflammation, and metabolic dysfunction. This study unveils the presence of APs unique to VIS fat involved in the paracrine regulation of adipogenesis and tissue remodeling.

Keywords: adipose progenitors; cell sorting; fat expansion; transplantation; visceral fat.


Conflict of interest statement

DECLARATION OF INTERESTS

The authors declare no competing interests.

Figures

Figure 1.
Figure 1.. Distinct Adipogenic Potential among Visceral Adipose Tissue Progenitors
(A) FACS plots of Lin, CD29+ Sca1+, and CD34+ adipose progenitors (APs) in subcutaneous (inguinal) and visceral (epididymal) adipose tissue of C57BL/6 control mice. (B) Representative images of oil red O staining of differentiated subcutaneous (SUB), visceral low (VL), and visceral high (VH) APs. (C) Oil red O quantification expressed as percentage of staining. (D and E) Relative mRNA expression of (D) Pparγ and (E) Fabp4 in sorted not cultured VH, SUB, and VL AP subsets, respectively, expressed as fold change from VH. (F–H) Relative mRNA expression of (F) Pparγ, (G) C/ebpα, and (H) Fabp4 in undifferentiated (UND) and 6-days-differentiated (DIFF) VH, SUB, and VL APs, respectively, expressed as fold change from VH. (I) Representative Western blots of Pparγ, C/ebpα, Fabp4, and α-Tubulin expression in UND and 6-days-DIFF VH, SUB, and VL APs. (J–M) Densitometry of (J) Pparγ, (K) C/ebpα (p42), (L) C/ebpα (p30), and (M) Fabp4 protein expression normalized by α-Tubulin and expressed as fold change from VH. Values are mean ± SEM (*p < 0.05; **p < 0.005 versus VH under the same condition; ##p < 0.005 versus UND within the same progenitor subset; $ $p < 0.005 versus SUB under the same condition (n = 3–4 independent experiments, each including 10–15 mice each). Scale bar in (B) is 400 μm.
Figure 2.
Figure 2.. Visceral High APs Inhibit Differentiation of Visceral Low and SUB APs
(A) Representative images of oil red O staining of AP co-cultures DIFF for 6 days. VH, SUB, and VL APs were cultured alone or with equal amounts of VH APs. (B) Oil red O staining quantification expressed as percentage of staining. (C) Representative images of co-cultures of UND VL (obtained from UBC-GFP transgenic mice) and VH (obtained from mT/mG transgenic mice) APs for 24 and 72 h, respectively. (D) Flow cytometry quantification of green (VL) and red cells (VH) expressed as percentage of total cells 72 h post-co-culture. (E) Representative images of oil red O staining of SUB and VL AP cultures treated during the first 3 days of differentiation with PBS or with different concentrations of conditioned media (CM) from 3-days-DIFF VH cultures. (F and G) The corresponding quantification of oil red O staining expressed as percentage of staining in (F) SUB and (G) VL APs treated with PBS or with CM from VH, respectively. (H) Quantification of oil red O staining expressed as percentage of staining in transwell co-cultures. VH, SUB, and VL APs were co-cultured on a transwell system either with the same AP subtype or with VH APs on top. Cells were DIFF for 6 days, and the bottom cultures were stained with oil red O. (I–K) Relative mRNA expression of (I) Pparγ, (J) C/ebpα, and (K) Fabp4, respectively, in UND and DIFF transwell co-cultures. Values are mean ± SEM (*p < 0.05; **p < 0.005 versus UND VH; $p < 0.05; $ $p < 0.005 versus same cell co-cultures under the same condition; n = 3–4 independent experiments, each including 10–15 mice each). Scale bar in (A) and (E) is 400 μm and in (C) is 200 μm.
Figure 3.
Figure 3.. Visceral High APs Secrete Adipogenic Inhibitors and Acquired a Smooth Muscle Fate upon Adipogenic Differentiation
(A) Hierarchical clustering of differentially abundant proteins in CM from 3-days-DIFF VH and VL APs, respectively. (B) Relative mRNA expression of Igfbp1–7 in VIS low and VIS high APs at day 2 post-differentiation. Levels are expressed as fold change relative to VIS low APs. (C) Igfbp2 levels in CM of SUB, VIS low, and VIS high cultures at day 6 post-differentiation. (D–F) Oil red O quantification (D) and relative mRNA expression of Pparγ (E) and C/ebpα (F) in SUB and VIS low AP cultures DIFF in the presence of PBS control, 25 ng/mL mouse recombinant Igfbp2 alone or combined with 30 μg/mL Igfbp2 neutralizing antibody during the first 3 days of differentiation. (G–I) Oil red O quantification (G) and relative mRNA expression of Pparγ (H) and C/ebpα (I) in SUB and VIS low AP cultures DIFF in the presence of 20% of PBS or VIS high CM from cells treated or not with 30 μg/mL Igfbp2 neutralizing antibody during differentiation. (J) Relative mRNA expression of genes encoding extracellular matrix (ECM) components and fibroblast markers in 6 days UND VIS low and VIS high APs expressed as fold change from VIS low. (K) Representative Western blots of periostin, α-Sma, and α-Tubulin in UND and 6-days-DIFF SUB, VH, and VL APs, respectively. (L and M) The corresponding densitometry of (L) periostin and (M) α-Sma expression normalized by α-Tubulin and expressed as fold change from UND VH. (N) Representative images of immunocytochemistry in 6-days-DIFF SUB, VH, and VL APs stained for caldesmon, 4′,6-diamidino-2-phenylindole (DAPI), and BODIPY. (O and P) Relative mRNA expression of (O) α-Sma and (P) Sm22a in UND and 6 days DIFF VH and VL APs expressed as fold change from UND VH. Values are mean ± SEM (*p < 0.05; **p < 0.005 versus VH under the same condition; #p < 0.05; ##p < 0.005 versus UND within the same progenitors subset; $p <0.05; $ $p < 0.005 versus SUB under the same condition (n = 3–4 independent experiments, each including 10–15 mice). Scale bar size is 50 μm.
Figure 4.
Figure 4.. Visceral High AP Proportions Correlate Positively with Visceral Adipose Tissue Healthy and Unhealthy Expansion
(A) Visceral high and low AP proportions in C57BL/6 male mice at post-natal day 10, 15, 21, and 35, respectively. (B) Visceral high and low AP proportions in C57BL/6 male mice fed, fasted, or fasted and then refed. (C) Visceral high and low AP proportions in C57BL/6 male mice fed normal chow diet (NCD) or high-fat diet (HFD) for 7 weeks. (D and E) Visceral high and low AP proportions in male (D) and female (E) (ob/ob) and wild-type mice, respectively. (F–T) Visceral low and high APs were isolated from eWAT of UBC-GFP transgenic male mice and transplanted into C57BL/6 recipient mice. Mice were fed HFD for 10 weeks before being sacrificed. (F) Body weights in transplanted mice. (G) Inguinal (iWAT), epididymal (eWAT), brown adipose tissue (BAT), and liver weights normalized by body weights in C57BL/6 recipient mice. (H) Glucose tolerance test (GTT) of VIS low and VIS transplanted mice. (I) Insulin tolerance test (ITT) of VIS low and VIS transplanted mice. (J) Representative images of eWAT sections of VIS low and VIS transplanted mice stained with H&E. (K) Adipocyte diameter in eWAT of VIS low and VIS transplanted mice. (L and M) Representative images of eWAT of VIS low and VIS transplanted mice stained with Sirius Red (L) and the corresponding quantification (M) expressed as percentage. (N and O) Representative images of eWAT of VIS low and VIS transplanted mice stained with Mac1 antibody (N) and the corresponding quantification (O) normalized by DAPI. (P–R) Representative images of eWAT of VIS low and VIS high transplanted mice stained with GFP antibody (P) and quantification of GFP-labeled adipocytes (Q) and non-adipocytes (R) normalized by DAPI. (S and T) Representative images of eWAT of VIS low and VIS transplanted mice stained with Pdgfrα antibody (S) and the corresponding quantification (T) normalized by DAPI. Values are mean ± SEM (*p < 0.05; **p < 0.005 versus VH under the same condition; #p < 0.05; ##p < 0.005 versus 10 days, fed or NCD within the same progenitors subset; n = 5–12 mice per group). Scale bar size is 50 μm.

References

    1. Abderrahim-Ferkoune A, Bezy O, Astri-Roques S, Elabd C, Ailhaud G, and Amri EZ (2004). Transdifferentiation of preadipose cells into smooth muscle-like cells: role of aortic carboxypeptidase-like protein. Exp. Cell Res 293, 219–228. - PubMed
    1. Arner P, Andersson DP, Thörne A, Wirén M, Hoffstedt J, Näslund E, Thorell A, and Rydén M (2013). Variations in the size of the major omentum are primarily determined by fat cell number. J. Clin. Endocrinol. Metab 98, E897–E901. - PubMed
    1. Bastien M, Poirier P, Lemieux I, and Després JP (2014). Overview of epidemiology and contribution of obesity to cardiovascular disease. Prog. Cardiovasc. Dis 56, 369–381. - PubMed
    1. Berry R, and Rodeheffer MS (2013). Characterization of the adipocyte cellular lineage in vivo. Nat. Cell Biol 15, 302–308. - PMC - PubMed
    1. Britton KA, Massaro JM, Murabito JM, Kreger BE, Hoffmann U, and Fox CS (2013). Body fat distribution, incident cardiovascular disease, cancer, and all-cause mortality. J. Am. Coll. Cardiol 62, 921–925. - PMC - PubMed

Publication types

MeSH terms