. 2019 Nov;575(7783):512-518.
doi: 10.1038/s41586-019-1631-3. Epub 2019 Oct 9.

Resolving the fibrotic niche of human liver cirrhosis at single-cell level

Affiliations

Resolving the fibrotic niche of human liver cirrhosis at single-cell level

P Ramachandran et al. Nature. 2019 Nov.

Abstract

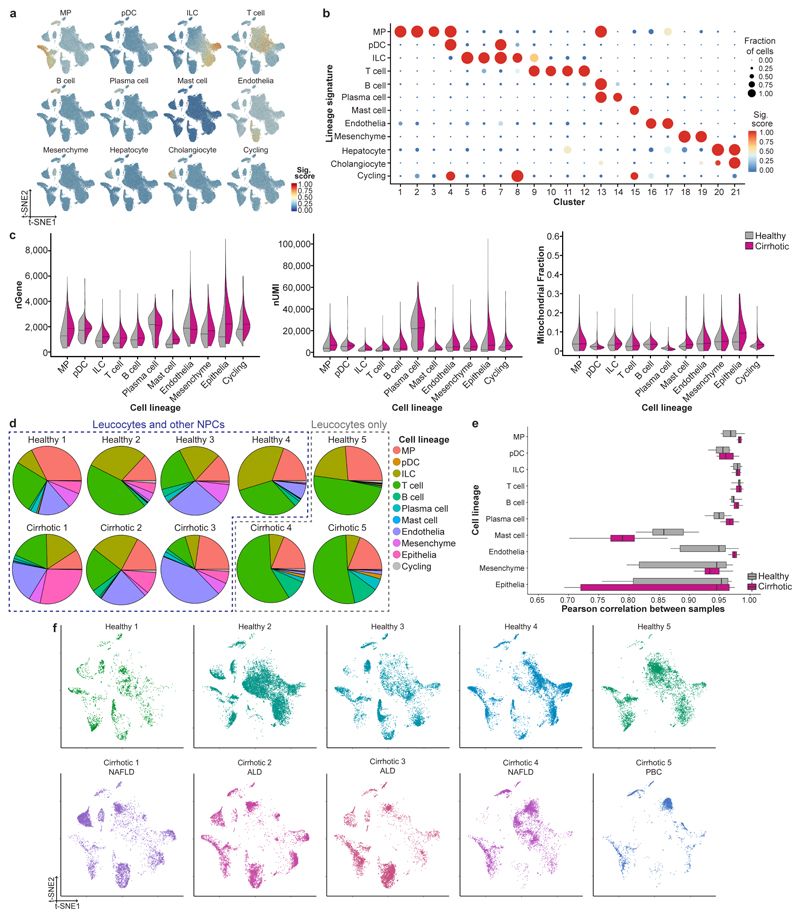
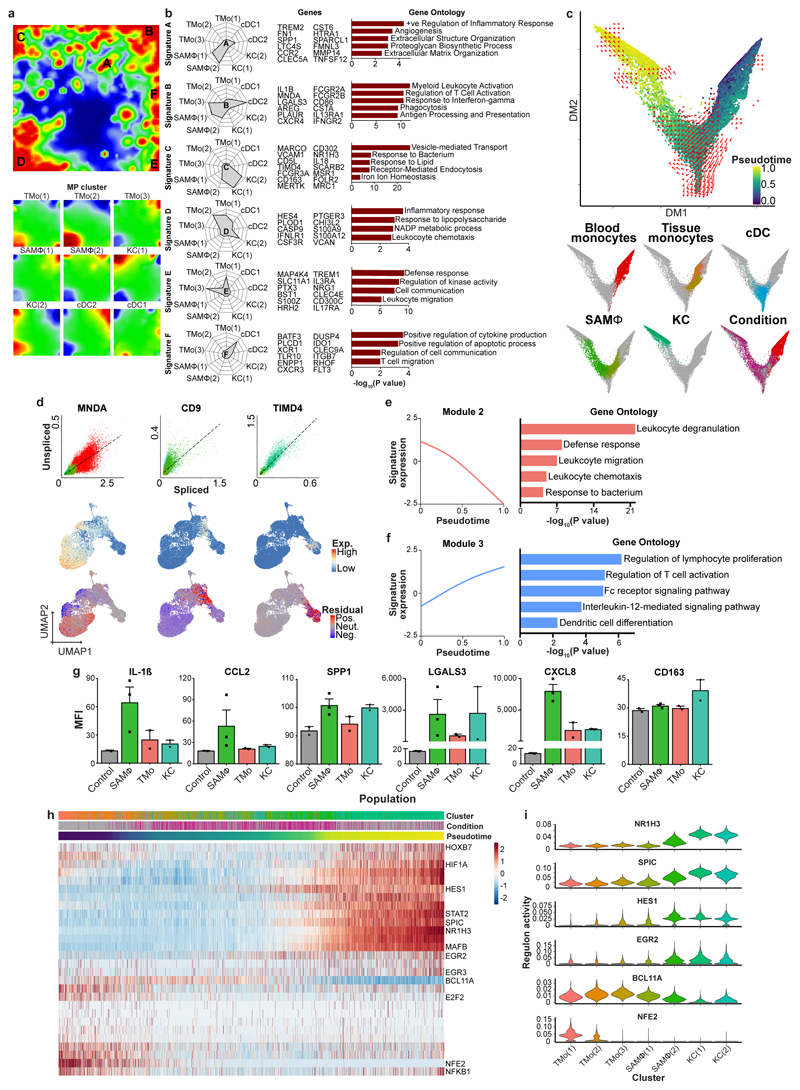
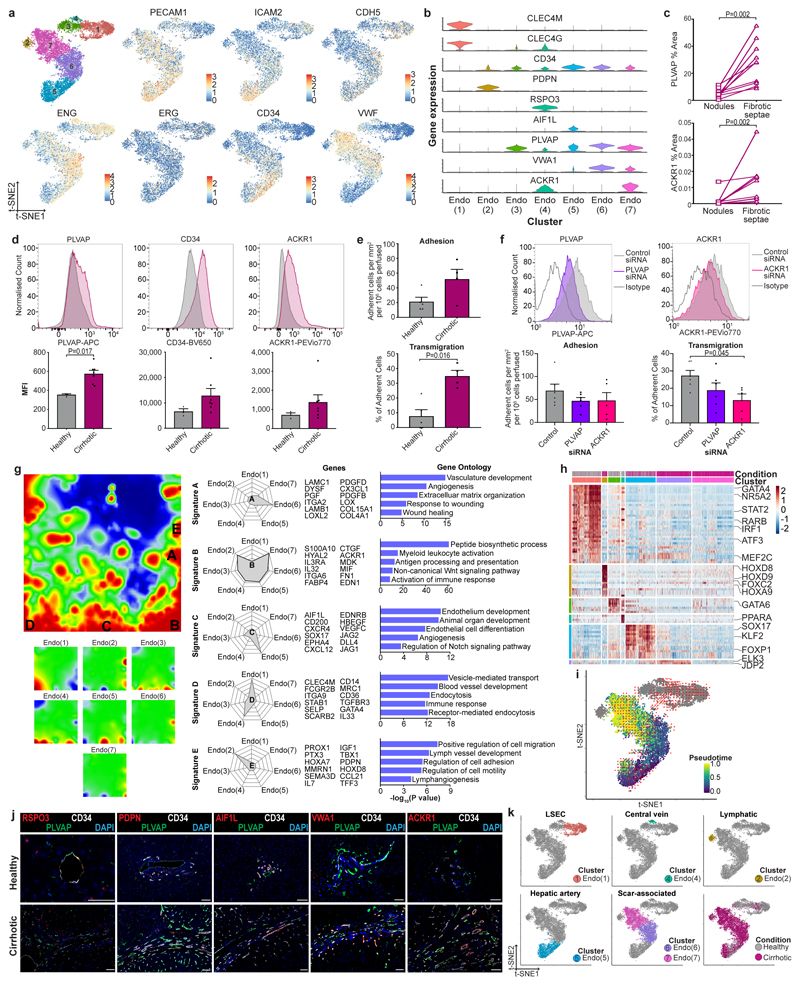
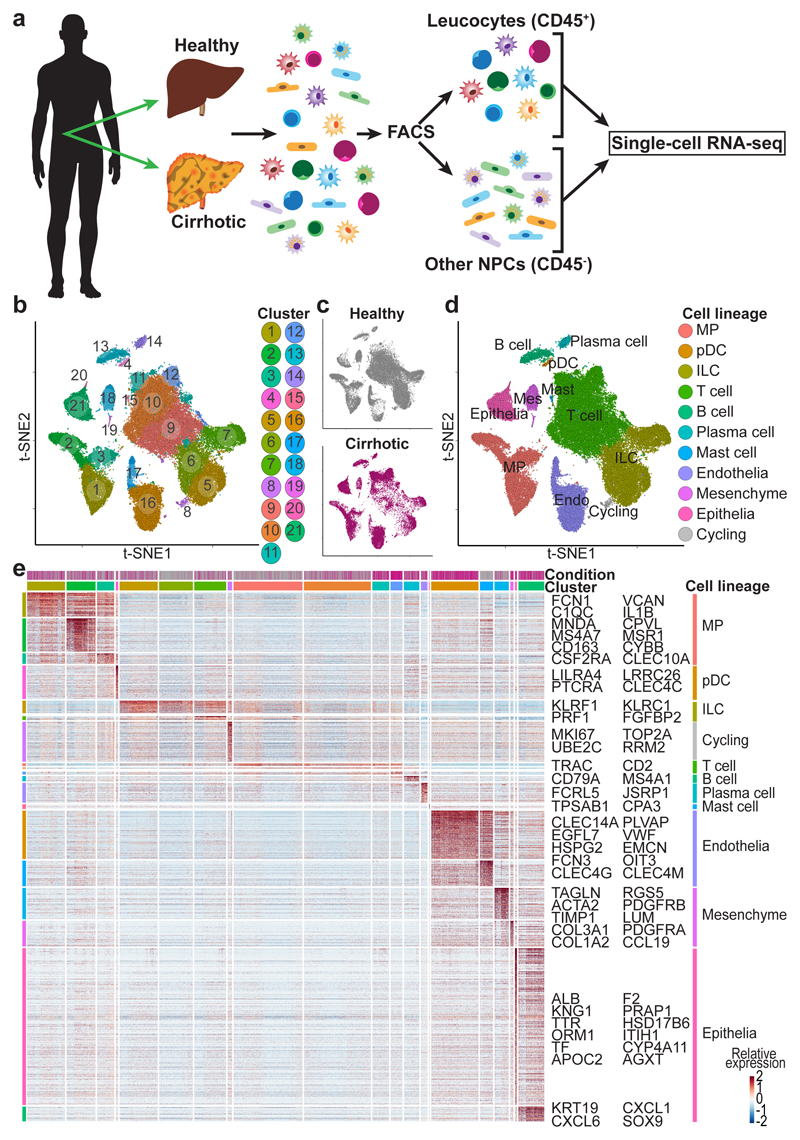
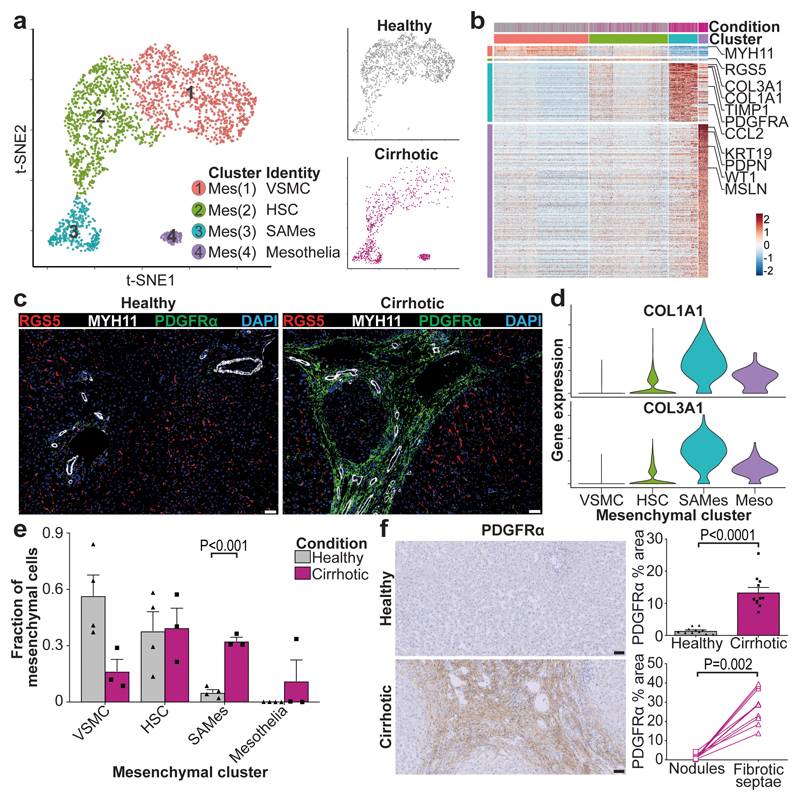
Liver cirrhosis is a major cause of death worldwide and is characterized by extensive fibrosis. There are currently no effective antifibrotic therapies available. To obtain a better understanding of the cellular and molecular mechanisms involved in disease pathogenesis and enable the discovery of therapeutic targets, here we profile the transcriptomes of more than 100,000 single human cells, yielding molecular definitions for non-parenchymal cell types that are found in healthy and cirrhotic human liver. We identify a scar-associated TREM2+CD9+ subpopulation of macrophages, which expands in liver fibrosis, differentiates from circulating monocytes and is pro-fibrogenic. We also define ACKR1+ and PLVAP+ endothelial cells that expand in cirrhosis, are topographically restricted to the fibrotic niche and enhance the transmigration of leucocytes. Multi-lineage modelling of ligand and receptor interactions between the scar-associated macrophages, endothelial cells and PDGFRα+ collagen-producing mesenchymal cells reveals intra-scar activity of several pro-fibrogenic pathways including TNFRSF12A, PDGFR and NOTCH signalling. Our work dissects unanticipated aspects of the cellular and molecular basis of human organ fibrosis at a single-cell level, and provides a conceptual framework for the discovery of rational therapeutic targets in liver cirrhosis.


Conflict of interest statement

Author Information

The authors declare no competing financial interests.

Figures

Extended Data Figure 1
Extended Data Figure 1. Strategy for isolation of human liver non-parenchymal cells.
a, Patient demographics and clinical information, Mean±SEM. b, Flow cytometry gating strategy for isolating leucocytes (CD45+) and other non-parenchymal cells (CD45-) from human liver, representative plots from 10 livers. c, Flow cytometry plots: gating strategy for isolating peripheral blood mononuclear cells (PBMC), representative plots from 4 patients. d, Clustering 103,568 cells from 5 healthy human livers, 5 cirrhotic human livers, 1 healthy PBMC and 4 cirrhotic PBMC (left), annotating source (PBMC versus liver; middle) and cell lineage inferred from known marker gene signatures (right). Endo, endothelial cell; ILC, innate lymphoid cell; Mast, mast cell; Mes, mesenchymal cell; MP, mononuclear phagocyte; pDC, plasmacytoid dendritic cell. e, Dotplot: annotating PBMC and liver clusters by lineage signatures. Circle size indicates cell fraction expressing signature greater than mean; colour indicates mean signature expression (red, high; blue, low). f, CXCR4 gene expression in single cells derived from blood or liver tissue, divided by cell lineage. Representative immunofluorescence micrograph, human liver: CXCR4 (green), DAPI (blue), arrows CXCR4- cells in the lumen of a blood vessel. Scale bar 50μm. g, Violin plots: number of unique genes (nGene), number of total Unique Molecular Identifiers (nUMI) and mitochondrial gene fraction expressed in 5 PBMC samples; Black line, median. g, Pie charts: proportion of cell lineage per PBMC sample. h, Box and whisker plot: agreement in expression profiles across 5 PBMC samples. Pearson correlation coefficients between average expression profiles for cell in each lineage, across all pairs of samples. Black bar, median value; box edges, 25th and 75th percentiles; whiskers, full range.
Extended Data Figure 2
Extended Data Figure 2. Quality control and annotation of human liver-resident cells.
a, Lineage signature expression across 66,135 liver-resident cells from 5 healthy and 5 cirrhotic human livers (red, high; blue, low). b, Dotplot: annotating liver-resident cell clusters by lineage signature. Circle size indicates cell fraction expressing signature greater than mean; colour indicates mean signature expression (red, high; blue, low). c, Violin plot: number of unique genes (nGene; left), number of total Unique Molecular Identifiers (nUMI; middle) and mitochondrial gene fraction (right) across 66,135 liver-resident cells from 5 healthy versus 5 cirrhotic livers; Black line, median. d, Pie charts: proportion of cell lineage per liver sample. e, Box and whisker plot: agreement in expression profiles across 5 healthy and 5 cirrhotic liver samples. Pearson correlation coefficients between average expression profiles for cell in each lineage, across all pairs of samples. Black bar, median value; box edges, 25th and 75th percentiles; whiskers, range. f, t-SNE visualisation: liver-resident cells per liver sample; Cirrhotic samples annotated by aetiology of underlying liver disease; NAFLD, Non-alcoholic fatty liver disease; ALD, Alcohol-related liver disease; PBC, Primary biliary cholangitis.
Extended Data Figure 3
Extended Data Figure 3. Annotating human liver lymphoid cells.
a, Clustering and annotating 36,900 T cells and innate lymphoid cells (ILC) (left) from 5 healthy and 5 cirrhotic human livers, annotating injury condition (right). cNK, cytotoxic NK cell. b, Fractions of T cell and ILC subpopulations in healthy (n=5) versus cirrhotic (n=5) livers, Mean±SEM, Wald. c, Selected gene expression in 36,900 T cells and ILC. d, Heatmap: T cell and ILC cluster marker genes (colour coded top by cluster and condition), exemplar genes labelled right. Cells columns, genes rows. e, t-SNE visualisations: downsampled T cell and ILC dataset (7,380 cells from 5 healthy and 5 cirrhotic human livers) pre- and post-imputation; annotating data used for visualisation and clustering, inferred lineage, injury condition. No additional heterogeneity was observed following imputation. f, Clustering 2,746 B cells and plasma cells (left) from 5 healthy and 5 cirrhotic human livers, annotating injury condition (right). g, Heatmap: B cell and plasma cell cluster marker genes (colour coded top by cluster and condition), exemplar genes labelled right. Cells columns, genes rows. h, Fractions of B cell and plasma cell subpopulations in healthy (n=5) versus cirrhotic (n=5) livers, Mean±SEM.
Extended Data Figure 4
Extended Data Figure 4. Annotating human liver mononuclear phagocytes.
a, Clustering and selected genes expressed in 10,737 mononuclear phagocytes (MP) from 5 healthy and 5 cirrhotic human livers. b, Scaled gene expression of Kupffer cell (KC) cluster markers across MP cells from healthy (n=5) and cirrhotic (n=5) livers. c, Representative immunofluorescence images, healthy versus cirrhotic liver: TIMD4 (red), CD163 (white), MARCO (green), DAPI (blue), arrows CD163+MARCO+TIMD4- cells, scale bars 50μm. d, TIMD4 immunohistochemistry, cell counts healthy (n=12) versus cirrhotic (n=9) liver, Mean±SEM, scale bars 50μm. e, MARCO immunohistochemistry, cell counts healthy (n=8) versus cirrhotic (n=8) liver, Mean±SEM, Mann-Whitney two-tailed, scale bars 50μm. f, Flow cytometry: gating strategy for identifying KC, TMo and SAMΦ in healthy (n=2) and cirrhotic (n=3) liver. SAMΦ are detected as TREM2+CD9+ cells within the TMo and SAMΦ gate (see Fig. 2f). g, Representative immunofluorescence image, cirrhotic liver: TREM2 (red), MNDA (white), collagen 1 (green), DAPI (blue), scale bars 50μm. h, Representative image, cirrhotic liver: TREM2 (smFISH; red), MNDA (immunofluorescence; green), DAPI (blue), scale bars 50μm. i, Representative immunofluorescence image, cirrhotic liver: CD9 (red), MNDA (white), collagen 1 (green), DAPI (blue), scale bars 50μm. j,TREM2 immunohistochemistry, cell counts healthy (n=10) versus cirrhotic (n=9) liver, Mann-Whitney two-tailed, scale bars 50μm. k,CD9 immunohistochemistry, cell counts healthy (n=12) versus cirrhotic (n=10) liver, Mann-Whitney two-tailed, scale bars 50μm. l, Exemplar tissue segmentation of cirrhotic liver section into fibrotic septae (orange) and parenchymal nodules (purple) (top); TREM2 (n=9), CD9(n=11), TIMD4 (n=9) and MARCO (n=7) immunohistochemistry and cell counts in parenchymal nodules versus fibrotic septae, Wilcoxon two-tailed. m, Clustering and annotation of 208 cycling MP cells from healthy (n=5) and cirrhotic (n=5) livers, scaled gene expression of MP subpopulation markers across 4 clusters of cycling MP cells (top), fractions of cycling MP subpopulations in 5 healthy versus 5 cirrhotic livers (bottom), Mean±SEM, Wald.
Extended Data Figure 5
Extended Data Figure 5. Phenotypic characterisation of mononuclear phagocytes in healthy and cirrhotic human livers.
a, Self-Organising Map (SOM; 60x60 grid): smoothed scaled metagene expression of 10,737 mononuclear phagocyte (MP) cells from healthy (n=5) and cirrhotic (n=5) livers. 20,952 genes, 3,600 metagenes, 44 signatures. A-F label metagene signatures overexpressed in one or more MP subpopulations (top). Smoothed mean metagene expression profile for each MP subpopulation (bottom). b, Radar plots (left): metagene signatures A-F showing distribution of signature expression across MP subpopulations from 10,737 MP cells, exemplar genes (middle) and selected Gene Ontology (GO) enrichment (right), Fisher’s exact test. c, Diffusion map visualisation, blood monocytes and liver-resident MP lineages (23,075 cells from healthy (n=5) and cirrhotic (n=5) liver samples and PBMCs (n=4), annotating monocle pseudotemporal dynamics (purple to yellow). RNA velocity field (red arrows) visualised using Gaussian smoothing on regular grid (top). Annotation of MP subpopulation, injury condition (bottom). d, Unspliced-spliced phase portraits (top row), 23,075 cells coloured and visualised as in Fig 3a, monocyte (MNDA), SAMΦ (CD9) and KC marker genes (TIMD4). Cells plotted above or below the steady-state (black dashed line) indicate increasing or decreasing expression of gene, respectively. Spliced expression profile for stated genes (middle row; red high, blue low). Unspliced residuals for stated genes (bottom row), positive (red) indicating expected upregulation, negative (blue) indicating expected downregulation. MNDA displays negative velocity in SAMΦ, CD9 displays positive velocity in monocytes and SAMΦ, TIMD4 velocity is restricted to KC. e, Cubic smoothing spline curve fitted to averaged expression of all genes in module 2 from blood monocyte-SAMΦ pseudotemporal trajectory (see Fig. 3c), selected GO enrichment (right), Fisher’s exact test. f, Cubic smoothing spline curve fitted to averaged expression of all genes in module 3 from blood monocyte-cDC pseudotemporal trajectory (see Fig. 3c), selected GO enrichment (right), Fisher’s exact test. g, Luminex assay: quantification of levels of stated proteins in culture medium from FACS-isolated scar-associated macrophages (SAMΦ, n=3), tissue monocytes (TMo, n=2), Kupffer cells (KC, n=2), and control (media alone, n=2), Mean±SEM, MFI median fluorescence intensity. h, Heatmap: transcription factor regulons across MP pseudotemporal trajectory and in KC (colour coded top by MP cluster, condition and pseudotime), selected regulons labelled right. Cells columns, regulons rows. i, Scaled regulon expression of selected regulons across MP clusters from healthy (n=5) and cirrhotic (n=5) livers.
Extended Data Figure 6
Extended Data Figure 6. Characterisation of macrophages in mouse liver fibrosis.
a, Clustering and annotating 3,250 mouse mononuclear phagocytes (mMP) from healthy (n=3) and fibrotic (4 weeks carbon tetrachloride treatment, n=3) livers. mTMo, tissue monocyte; mSAMΦ, scar-associated macrophage; mKC, Kupffer cell; mcDC, conventional dendritic cell. b, Annotating mMP cells by injury condition. c, Heatmap: mMP cluster marker genes (top, colour coded by cluster and condition), exemplar genes labelled (right). Cells columns, genes rows. d, Selected genes expressed in 3,250 mMP e, Flow cytometry: gating strategy for identifying KC, TMo and SAMΦ in healthy (n=2) and cirrhotic (n=3) liver. Flow cytometry plots: gating strategy for identifying mKC, CD9- mTMo and CD9+ mSAMΦ in fibrotic mice (n=8 from 2 independent experiments). f, Quantifying mouse macrophage subpopulations by flow cytometry: healthy (n=6) and fibrotic (n=8) mouse livers from 2 independent experiments, macrophage subpopulation (x-axis) as a percentage of total viable CD45+ cells (y-axis), Mean±SEM, Mann-Whitney two-tailed. g, Hepatic stellate cell activation assay: co-culture of hepatic stellate cells (HSC) from uninjured mouse liver and FACS-isolated macrophage subpopulations (MΦ) from fibrotic mouse liver (left). Co-culture with CD9- mTMo or CD9+ mSAMΦ isolated from 8 fibrotic mice (2 independent experiments), qPCR of Col3a1 in HSC, expression relative to mean expression of quiescent HSC (right), Wilcoxon two-tailed. h, Clustering 3,250 mouse mononuclear phagocytes (mMP) and 10,737 human mononuclear phagocytes (hMP) into 5 clusters using canonical correlation analysis (CCA). Annotation of cross-species clusters (identity). i, Annotation of human and mouse macrophage subpopulations from 3,250 mMP and 10,737 hMP. j, Selected genes expressed in 3,250 mMP and 10,737 hMP.
Extended Data Figure 7
Extended Data Figure 7. Scar-associated macrophage expansion in human NASH
a to d,Deconvolution: publicly available whole liver microarray data (n=73) assessed for frequency of scar-associated macrophages (SAMΦ), Kupffer cells (KC) and tissue monocytes (TMo) using Cibersort algorithm. a, Macrophage composition: x-axis, GEO accession number; y-axis, fraction of monocyte-macrophages; Top, annotated by liver phenotype; NASH, Non-alcoholic steatohepatitis. b, Frequency of SAMΦ in control (n=14), heathy obese (n=27), steatosis (n=14) and NASH (n=18) livers, Mean±SEM, Kruskal-Wallis and Dunn. c, Frequency of SAMΦ in patients with histological NAFLD activity score (NAS) of 0 (n=37), 1-3 (n=19) and 4-7 (n=17) (left). Frequency of SAMΦ in patients with histological fibrosis score of 0 (n=46), 1 (n=20) and 2-4 (n=5) (right), Mean±SEM, Kruskal-Wallis and Dunn. d, Frequency of SAMΦ in female (n=58) and male (n=15) patients (left). Frequency of SAMΦ in patients aged 23-39 (n=22), 40-49 (n=29) and 50-80 (n=22) (middle). Frequency of SAMΦ in patients with a body mass index (BMI) of 17-30 (n=18), 31-45 (n=28) and 46-70 (n=27) (right). e, CD9 and TREM2 staining in NASH liver biopsy sections (left), Scale bars, 50μm. Cell counting (right): CD9 staining, NAS 1-3 (n=13) versus NAS 4-8 (n=21), Mean±SEM, Mann-Whitney two-tailed. TREM2 staining, NAS 1-3 (n=12) versus NAS 4-8 (n=16), Mean±SEM. f, Correlation of cell counts with picrosirius red (PSR) digital morphometric pixel quantification in NAFLD liver biopsy tissue; CD9 staining (top; n=39); TREM2 staining (bottom; n=32); Pearson correlation and linear regression.
Extended Data Figure 8
Extended Data Figure 8. Phenotypic characterisation of endothelial cells in healthy and cirrhotic human livers.
a, Clustering and selected genes expressed in 8,020 endothelial cells from 4 healthy and 3 cirrhotic human livers. b, Scaled gene expression of endothelial cluster markers across endothelial cells from healthy (n=4) and cirrhotic (n=3) livers. c, Digital pixel quantification: PLVAP immunostaining of cirrhotic liver sections (n=10) in parenchymal nodules versus fibrotic septae (top), Wilcoxon two-tailed. ACKR1 immunostaining of cirrhotic liver sections (n=10) in parenchymal nodules versus fibrotic septae (bottom), Wilcoxon two-tailed. d, Flow cytometry: endothelial cells from healthy (n=3, grey) or cirrhotic (n=7, red) livers, representative histogram for stated marker (top), mean fluorescence intensity (MFI, bottom), Mean±SEM, Mann-Whitney two-tailed. e, Flow-based adhesion assay: peripheral blood monocytes assessed for adhesion (top) and % of adherent cells which transmigrate (bottom); endothelial cells from healthy (n=5) or cirrhotic (n=4) livers, Mean±SEM, Mann-Whitney two-tailed. f, Endothelial cell gene knockdown: cirrhotic endothelial cells treated with siRNA to PLVAP (n=6), ACKR1 (n=5) or control siRNA (n=6). Representative flow cytometry histograms for stated marker (top); comparison to isotype control antibody. Flow-based adhesion assay (bottom), peripheral blood mononuclear cells assessed for adhesion (bottom left) and % of adherent cells which transmigrate (bottom right) following siRNA treatment of endothelial cells, Mean±SEM, Kruskal-Wallis and Dunn. g, Self-Organising Map (SOM; 60 x 60 grid; top left): smoothed scaled metagene expression of endothelia lineage. 21,237 genes, 3,600 metagenes, 45 signatures. A-E label metagene signatures overexpressed in one or more endothelial subpopulations. SOM: smoothed mean metagene expression profile for each endothelial subpopulation (bottom left). Radar plots (middle): metagene signatures A-E showing distribution of signature expression across endothelial subpopulations, exemplar genes (middle) and Gene Ontology (GO) enrichment (right), Fisher’s exact test. h, Heatmap: endothelial subpopulation transcription factor regulon expression (colour coded top by cluster and condition) across 8,020 endothelial cells from 4 healthy and 3 cirrhotic human livers. Exemplar regulons labelled right. Cells in columns, regulons in rows. i, t-SNE visualisation, endothelial lineage (8,020 cells from healthy (n=4) and cirrhotic (n=3)), annotating monocle pseudotemporal dynamics (purple to yellow; grey indicates lack of inferred trajectory). RNA velocities (red arrows) visualised using Gaussian smoothing on regular grid. (purple to yellow). j, Representative immunofluorescence images healthy versus cirrhotic liver: RSPO3, PDPN, AIF1L, VWA1 or ACKR1 (red), CD34 (white), PLVAP (green), DAPI (blue), scale bars, 50μm. k, Annotation of 8,020 endothelial cells by subpopulation and injury condition. LSEC, Liver sinusoidal endothelial cells.
Extended Data Figure 9
Extended Data Figure 9. Characterisation of mesenchymal cells in healthy and cirrhotic human livers.
a, Selected genes expressed in 2,318 mesenchymal cells from 4 healthy and 3 cirrhotic human livers. b, Clustering 319 scar-associated mesenchymal cells (SAMes) into 2 further subclusters. c, Heatmap: SAMes subcluster marker genes (top, colour coded by cluster and condition), exemplar genes labelled (right). Cells columns, genes rows. d, Fractions of SAMes subpopulations in healthy (n=4) versus cirrhotic (n=3) livers, Mean±SEM, Wald. e, Representative immunofluorescence image, portal region of healthy liver: OSR1 (red), Collagen 1 (green), DAPI (blue), Scale bar 50μm. f, Representative immunofluorescence image, fibrotic niche of cirrhotic liver: OSR1 (red), Collagen 1 (green), DAPI (blue), Scale bar 50μm. g, Scaled gene expression of selected genes across 2,318 mesenchymal cells from healthy (n=4) and cirrhotic (n=3) livers. h, t-SNE visualisation, 1,178 Hepatic Stellate Cells (HSC) and SAMes from healthy (n=4) and cirrhotic (n=3) livers annotated by monocle pseudotemporal dynamics (purple to yellow). RNA velocity field (red arrows) visualised using Gaussian smoothing on regular grid. i, Heatmap: cubic smoothing spline curves fitted to genes differentially expressed across HSC-to-SAMes pseudotemporal trajectories, grouped by hierarchical clustering (k=2). Colour coded by pseudotime and condition (top). Gene co-expression modules (colour) and exemplar genes labelled right.
Extended Data Figure 10
Extended Data Figure 10. Characterisation of the cellular interactome in the fibrotic niche.
a to b, Representative immunofluorescence images, fibrotic niche cirrhotic liver. a, TREM2 (red), PLVAP (white), PDGFRα (green), DAPI (blue), Scale bars 50μm. b, TREM2 (red), ACKR1 (white), PDGFRα (green), DAPI (blue), Scale bars 50μm. c, Proliferation assay: Human hepatic stellate cells (HSC) treated with conditioned media from primary hepatic macrophage subpopulations SAMΦ (n=2), tissue monocytes (TMo, n=2), Kupffer cells (KC, n=2) or control media (n=2). y-axis, area under curve (AUC) of % change in HSC number over time (hours), Mean±SEM. d, Circle plot: potential interaction magnitude from ligands expressed by scar-associated macrophages (SAMΦ) and endothelial cells (SAEndo) to receptors expressed on scar-associated mesenchyme (SAMes). e, Circle plot: potential interaction magnitude from ligands expressed by SAMes to receptors expressed on SAMΦ and SAEndo. f, Dotplot: ligand-receptor interactions between SAMes (n=7 human livers), SAMΦ (n=10 human livers) and SAEndo (n=7 human livers). X-axis, ligand (red) and cognate receptor (blue); y-axis, ligand (red) and receptor (blue) expressing cell populations; circle size, P value (permutation test); colour (red, high; yellow, low), means of average ligand and receptor expression levels in interacting subpopulations. g, Representative immunofluorescence images, fibrotic niche in cirrhotic liver. Top; CCL2 (red), CCR2 (white), PDGFRα (green), DAPI (blue), arrows CCL2+PDGFRα+ cells. Bottom; ANGPT1 (red), TEK(white), PDGFRα (green), DAPI (blue), arrows ANGPT1+PDGFRα+ cells. Scale bars 50μm. h, Circle plot: potential interaction magnitude from ligands expressed by to receptors expressed on SAEndo. i, Dotplot: ligand-receptor interactions between SAMΦ (n=10 human livers) and SAEndo (n=7 human livers). X-axis, ligand (red) and cognate receptor (blue); y-axis, ligand (red) and receptor (blue) expressing cell populations; circle size, P value (permutation test); colour (red, high; yellow, low), means of average ligand and receptor expression levels in interacting subpopulations. j, Representative immunofluorescence image, fibrotic niche in cirrhotic liver. TREM2 (red), FLT1 (white), VEGFA (green), DAPI (blue), arrows TREM2+VEGFA+ cells, Scale bar 50μm. k, Circle plot: potential interaction magnitude from ligands expressed by SAEndo to receptors expressed on SAMΦ. l, Dotplot: ligand-receptor interactions between SAEndo (n=7 human livers) and SAMΦ (n=10 human livers). X-axis, ligand (red) and cognate receptor (blue); y-axis, ligand (red) and receptor (blue) expressing cell populations; circle size, P value (permutation test); colour (red, high; yellow, low), means of average ligand and receptor expression levels in interacting subpopulations. m, Representative immunofluorescence images, fibrotic niche in cirrhotic liver. Top; TREM2 (red), CD200 (white), CD200R (green), DAPI (blue), arrows TREM2+CD200R+ cells. Bottom; TREM2 (red), DLL4 (white), NOTCH2 (green), DAPI (blue), arrows TREM2+NOTCH2+ cells. Scale bars, 50μm.
Figure 1
Figure 1. Single cell atlas of human liver NPC.
a, Overview: isolation, FACS-sorting and sc-RNASeq of leucocytes (CD45+) and other NPC fractions (CD45-). b, Clustering 66,135 cells from 5 healthy and 5 cirrhotic human livers. c, Annotation by injury condition. d, Cell lineage inferred from expression of marker gene signatures. Endo, endothelial cell; ILC, innate lymphoid cell; Mast, mast cell; Mes, mesenchymal cell; MP, mononuclear phagocyte; pDC, plasmacytoid dendritic cell. e, Heatmap: cluster marker genes (top, colour coded by cluster and colour coded by condition) and exemplar genes and lineage annotation labelled (right). Cells columns, genes rows.
Figure 2
Figure 2. Identifying scar-associated macrophage subpopulations.
a, Clustering 10,737 mononuclear phagocytes (MP) from 5 healthy and 5 cirrhotic human livers. TMo, tissue monocyte; SAMΦ, scar-associated macrophage; KC, Kupffer cell; cDC, conventional dendritic cell. b, Annotation by injury condition. c, Fractions of MP subpopulations in 5 healthy versus 5 cirrhotic livers, Mean±SEM, Wald test. d, Heatmap: MP cluster marker genes (top, colour coded by cluster and condition), exemplar genes labelled (right). Cells columns, genes rows. e, Scaled gene expression of SAMΦ and TMo cluster markers across MP cells from healthy (n=5) and cirrhotic (n=5) livers. f, Flow cytometry: TREM2+CD9+ MP fraction in healthy (n=2) versus cirrhotic (n=3) liver, Mean±SEM. g, Primary human hepatic stellate cells (HSC) treated with conditioned media from SAMΦ (n=3) or TMo (n=3); qPCR of stated genes, expression relative to mean expression of control HSC (n=6), Mean±SEM, Kruskal-Wallis and Dunn. h, Representative immunofluorescence image, cirrhotic liver: TREM2 (red), CD9 (white), collagen 1 (green), DAPI (blue), scale bar 50μm.
Figure 3
Figure 3. Fibrogenic phenotype of scar-associated macrophages.
a, UMAP visualisation, 23,075 cells from liver-resident MP (5 healthy and 5 cirrhotic) and blood monocytes (5 PBMC), annotating monocle pseudotemporal dynamics (purple to yellow). RNA velocity field (red arrows) visualised using Gaussian smoothing on regular grid. Right: Annotation of MP subpopulation, injury condition. b, Transition probabilities per SAMΦ subpopulation, indicating for each cell the likelihood of transition into either SAMΦ(1) or SAMΦ(2), calculated using RNA velocity (yellow high; purple low; grey below threshold of 2x10⁻⁴). c, Heatmap: spline curves fitted to genes differentially expressed across blood monocyte-to-SAMΦ (right arrow) and blood monocyte-to-cDC (left arrow) pseudotemporal trajectories, grouped by hierarchical clustering (k=3). Gene co-expression modules (colour) labelled right with exemplar genes from each module. d, Spline curve fitted to averaged expression of all genes in module 1, along monocyte-to-SAMΦ pseudotemporal trajectory, selected GO enrichment (right), Fisher’s exact test.
Figure 4
Figure 4. Identifying scar-associated endothelial subpopulations.
a, Clustering 8,020 endothelial cells from 4 healthy and 3 cirrhotic human livers, annotating injury condition (right). b, Fractions of endothelial subpopulations in healthy (n=4) versus cirrhotic (n=3) livers, Mean±SEM, Wald. c, Heatmap: endothelial cluster marker genes (colour coded top by cluster and condition), exemplar genes labelled right. Cells columns, genes rows. d, Representative immunofluorescence images: CD34 (red), CLEC4M (white), PLVAP (green), DAPI (blue), scale bar 50μm. e, Digital pixel quantification: CLEC4M staining healthy (n=5) versus cirrhotic liver (n=8), PLVAP staining healthy (n=11) versus cirrhotic liver (n=11), ACKR1 staining healthy (n=10) versus cirrhotic liver (n=10), scale bars 50μm, Mean±SEM, Mann-Whitney two-tailed.
Figure 5
Figure 5. Identifying scar-associated mesenchymal cell populations.
a, Clustering 2,318 mesenchymal cells (Mes) from 4 healthy and 3 cirrhotic human livers, annotating injury condition (right). VSMC, vascular smooth muscle cell; HSC, hepatic stellate cell; SAMes, scar-associated mesenchymal cell. b, Heatmap: Mesenchymal cluster marker genes (top, colour coded by cluster and condition), exemplar genes labelled (right). Cells columns, genes rows. c, Representative immunofluorescence images: RGS5 (red), MYH11 (white), PDGFRα (green), DAPI (blue), scale bars 50μm d, Scaled gene expression of fibrillar collagens across mesenchymal cells from healthy (n=4) and cirrhotic (n=3) livers. Meso, mesothelial cell. e, Fraction of mesenchymal subpopulations in healthy (n=4) versus cirrhotic (n=3) livers, Mean±SEM, Wald test. f, PDGFRα immunohistochemistry, digital pixel quantification of healthy (n=11) versus cirrhotic (n=11) liver (top right), Mean±SEM, Mann-Whitney two-tailed. PDGFRα pixel quantification in fibrotic septae and parenchymal nodules in 10 cirrhotic livers (bottom right), Wilcoxon two-tailed, scale bars 50μm.
Figure 6
Figure 6. Multi-lineage interactions in the fibrotic niche.
a, Dotplot: ligand-receptor interactions between SAMΦ (n=10 human livers) and SAMes (n=7 human livers). X-axis, ligand (red) and cognate receptor (blue); y-axis, cell populations expressing ligand (red) and receptor (blue); circle size, P value (permutation test); colour (red, high; yellow, low), means of average ligand and receptor expression levels in interacting subpopulations. b, Representative immunofluorescence images, fibrotic niche. Left, TREM2 (red), PDGFB (white), PDGFRα (green), DAPI (blue), arrows TREM2+PDGFB+ cells. Right, TNFRSF12A (red), TNFSF12 (white), PDGFRα (green), DAPI (blue), arrows TNFRSF12A+PDGFRα+ cells, scale bars 50μm. c to d, HSC proliferation assay: y-axis, area under curve (AUC) of % change in HSC number over time (hours), Mean±SEM, one-way ANOVA and Tukey. c, Control, TNFSF12, anti-TNFRSF12A, isotype control, all n=3. d, Vehicle, PDGF-BB, Crenolanib, all n=3. e, Dotplot: ligand-receptor interactions between SAEndo (n=7 human livers) and SAMes (n=7 human livers). X-axis, ligand (red) and cognate receptor (blue); y-axis, cell populations expressing ligand (red) and receptor (blue); circle size, P value (permutation test); colour (red, high; yellow, low), means of average ligand and receptor expression levels in interacting subpopulations. f, Representative immunofluorescence image, fibrotic niche. NOTCH3 (red), DLL4 (white), PDGFRα (green), DAPI (blue), arrows NOTCH3+PDGFRα+ cells, scale bar 50μm. g, Endothelial cell JAG1 flow cytometry: healthy (n=3) or cirrhotic (n=9) liver, representative histogram (left), mean fluorescence intensity (MFI, right), Mean±SEM, Mann-Whitney two-tailed. h, Cirrhotic endothelial cell and HSC co-culture, Notch inhibitor Dibenzazepine (DBZ). Representative immunofluorescence images (left), Collagen 1 (magenta), PECAM1 (green), DAPI (blue). Digital pixel analysis (right); collagen 1 area, n=3, Mean±SEM, RM one-way ANOVA and Tukey. n, HSC gene knockdown: control (n=7) or NOTCH3 (n=7) siRNA, qPCR of stated gene, expression relative to mean expression of control siRNA, Mean±SEM, Mann-Whitney two-tailed.

Comment in

References

    1. Marcellin P, Kutala BK. Liver diseases: A major, neglected global public health problem requiring urgent actions and large-scale screening. Liver Int. 2018 doi: 10.1111/liv.13682. - DOI - PubMed
    1. Angulo P, et al. Liver Fibrosis, but No Other Histologic Features, Is Associated With Long-term Outcomes of Patients With Nonalcoholic Fatty Liver Disease. Gastroenterology. 2015;149:389–397.e10. - PMC - PubMed
    1. Ramachandran P, Henderson NC. Antifibrotics in chronic liver disease: tractable targets and translational challenges. Lancet Gastroenterol Hepatol. 2016;1:328–340. - PubMed
    1. Friedman SL, Neuschwander-Tetri BA, Rinella M, Sanyal AJ. Mechanisms of NAFLD development and therapeutic strategies. Nature Medicine. 2018;24:908–922. - PMC - PubMed
    1. Stubbington MJT, Rozenblatt-Rosen O, Regev A, Teichmann SA. Single-cell transcriptomics to explore the immune system in health and disease. Science. 2017;358:58–63. - PMC - PubMed

Publication types

MeSH terms