. 2019 Oct 15;8(20):e012748.
doi: 10.1161/JAHA.119.012748. Epub 2019 Oct 10.

Caveolae-Mediated Activation of Mechanosensitive Chloride Channels in Pulmonary Veins Triggers Atrial Arrhythmogenesis

Affiliations

Caveolae-Mediated Activation of Mechanosensitive Chloride Channels in Pulmonary Veins Triggers Atrial Arrhythmogenesis

Yuriy V Egorov et al. J Am Heart Assoc. .

Abstract

Background Atrial fibrillation often occurs in the setting of hypertension and associated atrial dilation with pathologically increased cardiomyocyte stretch. In the setting of atrial dilation, mechanoelectric feedback has been linked to the development of ectopic beats that trigger paroxysmal atrial fibrillation mainly originating from pulmonary veins (PVs). However, the precise mechanisms remain poorly understood. Methods and Results We identify mechanosensitive, swelling-activated chloride ion channels (ICl,swell) as a crucial component of the caveolar mechanosensitive complex in rat and human cardiomyocytes. In vitro optical mapping of rat PV, single rat PV, and human cardiomyocyte patch clamp studies showed that stretch-induced activation of ICl,swell leads to membrane depolarization and decreased action potential amplitude, which trigger conduction discontinuities and both ectopic and reentrant activities within the PV. Reverse transcription quantitative polymerase chain reaction, immunofluorescence, and coimmunoprecipitation studies showed that ICl,swell likely consists of at least 2 components produced by mechanosensitive ClC-3 (chloride channel-3) and SWELL1 (also known as LRRC8A [leucine rich repeat containing protein 8A]) chloride channels, which form a macromolecular complex with caveolar scaffolding protein Cav3 (caveolin 3). Downregulation of Cav3 protein expression and disruption of caveolae structures during chronic hypertension in spontaneously hypertensive rats facilitates activation of ICl,swell and increases PV sensitivity to stretch 10- to 50-fold, promoting the development of atrial fibrillation. Conclusions Our findings identify caveolae-mediated activation of mechanosensitive ICl,swell as a critical cause of PV ectopic beats that can initiate atrial arrhythmias including atrial fibrillation. This mechanism is exacerbated in the setting of chronically elevated blood pressures.

Keywords: arrhythmia; caveolae; caveolin 3; hypertension; mechanoelectrical transduction; pulmonary veins; stretch; volume‐activated chloride channels.


Figures
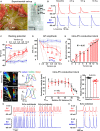
Figure 1
Figure 1
Effect of pathological stretch on the pulmonary vein (PV) myocardium. A, Photograph of the intact rat PVs (left). Central PV was isolated, cleaned, cut open, and placed in a tissue bath with the endocardial side facing upward (right). Anatomical regions selected for microelectrode action potential (AP) recordings are shown: PV ostium (PV ost) and PV distal (PV dis). B, Representative examples of APs simultaneously recorded in the PV dis (top recordings) and PV ost (bottom recordings) under different pathological stretch. C and D, Membrane resting potential (RP) and AP amplitude (APA) changes for individual rats (light blue lines indicate PV ost, and red lines indicate PV dis) and averaged (solid lines). E, Probability (in percentage from total preparations tested) of intra‐PV conduction block at different tensions. Data include 2 series of experiments: n=8 for tensions <10.5 g, and n=15 for tensions >10.5 g. *P<0.05, **<0.01, ***<0.001 within the same group vs baseline, and # P<0.05, ##<0.01, ###<0.001 for PV dis vs PV ost by repeated‐measurements 2‐way ANOVA with Bonferroni correction. F, Fluorescent optical mapping of electrical activity during the development of intra‐PV conduction block under pathological stretch. At left, PV activation maps are shown at baseline (no stretch applied; top) and during the development of intra‐PV conduction block (stretched; bottom). In the middle, superimposed upstrokes of optical action potentials (Vm) along the PV (PV ost in blue, PV middle in green, and PV dis in red) are shown for each condition. At right, distribution of conduction velocity along the PV and relative PV distance (in percentage from the PV length from a brightfield image) activated at baseline and during stretch. P value was determined by paired Student t test. G and H, Microreentry within the PV occurred under pathological stretch and application of norepinephrine (1 μmol/L). LA indicates left atrium; LAA, left atrial appendage.
Figure 2
Figure 2
Inhibition of volume‐activated chloride ion (Cl) channels hyperpolarizes resting potential (RP) in pulmonary veins distal (PV dis) and restores intra‐PV conduction in stretched PVs. Two simultaneous microelectrode recordings from PV dis (top recording in red) and PV ostium (PV ost; bottom recording in blue) are shown during conduction block and after application of nonselective chloride current blocker DIDS (A) or selective swelling‐activated chloride ion channel (IC l,swell) blocker DCPIB (B) (shown by arrows). Selected time windows (gray rectangles) are shown enlarged in corresponding panels. Left atrium (LA) was constantly paced with S1S1=300 ms. Notice progressive hyperpolarization of RP (shown by arrows) during conduction recovery. Transmembrane potential levels of −60 and −80 mV are shown by dotted lines for PV dis recording. At right, action potential amplitude and RP are shown at baseline (no stretch applied), during intra‐PV block (Block) and after application of corresponding IC l,swell antagonists. n=7 for DIDS and n=9 for DCPIB. *P<0.05, ***<0.001 vs baseline, and # P<0.05, ###<0.001 for PV dis vs PV ost by repeated‐measurements 2‐way ANOVA with Bonferroni correction. DCPIB indicates 4‐[(2‐butyl‐6,7‐dichloro‐2‐cyclopentyl‐2,3‐dihydro‐1‐oxo‐1H‐inden‐5‐yl)oxy]butanoic acid; DIDS, 4,4′‐diisothiocyanato‐2,2′‐stilbenedisulfonic acid disodium salt.
Figure 3
Figure 3
Activation of swelling‐activated chloride ion channels (IC l,swell) leads to resting potential depolarization and inhibition of spontaneous electrical activity in single cardiomyocytes. A, (Left) Whole‐cell IC l,swell recorded from single myocytes separately isolated from the pulmonary veins distal (PV dis; n=8 for isotonic [Iso], n=8 for hypotonic [Hypo], and n=6 for Hypo plus DCPIB 10 μmol/L; upper panel) and PV ostium (PV ost; n=4 for Iso and Hypo; lower panel), respectively, under Iso and Hypo conditions. DCPIB‐sensitive activation of IC l,swell was observed during Hypo condition exclusively in PV dis myocytes. (Right) Corresponding current‐voltage (I‐V) curves for IC l,swell from PV dis (upper panel) and PV ost (lower panel) myocytes. B, Activation of IC l,swell current by Hypo cell swelling led to depolarization of the membrane resting potential (RP) and inhibition of spontaneous electrical activity in single human induced pluripotent stem cell‐derived cardiomyocytes (iPSCMs). DIDS (100 μmol/L) recovered the automaticity and RPs in the single iPS myocytes. ***P<0.001 vs Iso condition by 1‐way ANOVA with Bonferroni correction. C, Similar to PV dis myocytes, the effect was observed in single human iPSCMs. *P<0.05, **0.01, ***0.001 vs treatment by 1‐way ANOVA with Bonferroni correction. DCPIB indicates 4‐[(2‐butyl‐6,7‐dichloro‐2‐cyclopentyl‐2,3‐dihydro‐1‐oxo‐1H‐inden‐5‐yl)oxy]butanoic acid; DIDS, 4,4′‐diisothiocyanato‐2,2′‐stilbenedisulfonic acid disodium salt.
Figure 4
Figure 4
Caveolar macromolecular mechanosensitive complex. Immunofluorescent analysis of colocalized expression of ClC‐3 (left), ClC‐2 (middle), and SWELL1 (right) chloride channels with caveolae scaffolding protein Cav3 (caveolin 3) in nonstretched rat pulmonary vein distal (PV dis; A) and human left atrium (B) myocardium. For colocalization analysis, intensity level of 30% was used as a threshold. Cav3 indicates caveolin 3; ClC, chloride channel; SWELL1, also known as LRRC8A (leucine rich repeat containing protein 8A).
Figure 5
Figure 5
Co‐IP Western blots showing degree of association of Cav3 and chloride channels ClC‐2, ClC‐3, and SWELL1 in rat pulmonary vein (PV; n=2). IB indicates immunoblot; IP, immunoprecipitation. Cav3 indicates caveolin 3; ClC, chloride channel; SWELL1, also known as LRRC8A (leucine rich repeat containing protein 8A).
Figure 6
Figure 6
Expression of chloride channels ClC‐2, ClC‐3, and SWELL1, caveolar scaffolding protein caveolin 3 (Cav3), and potassium channel Kir2.1 along the pulmonary vein (PV) vs left atrium (LA). A, Protein expression levels of Kir2.1, ClC‐2, Cav3, ClC‐3, and SWELL1 measured in PV distal (PV dis), PV ostium (PV ost), and LA from the same rat (n=4). B through F, Corresponding protein expression levels normalized to GAPDH (n=4 per group). **P<0.01 by 1‐way ANOVA with Bonferroni correction. G, Comparative analysis of mRNA expression levels for sarcolemmal chloride ion channel isoforms normalized to GAPDH. n=6 per region for SWELL1 and n=5 per region for ClC‐2, ClC‐3, and ANO1. ***P<0.01 vs PV dis for SWELL1; ## P<0.01, ### P<0.001 vs SWELL1 for PV dis; $$ P<0.01 vs ClC‐3 for PV dis; and && P<0.01 vs ClC‐3 for LA by 2‐way ANOVA with Bonferroni correction. ANO1 indicates anoctamin 1; Cav3, caveolin 3; ClC, chloride channel; SWELL1, also known as LRRC8A (leucine rich repeat containing protein 8A).
Figure 7
Figure 7
Effect of stretch on electrical activity of the pulmonary vein (PV) in spontaneously hypertensive rats (SHRs). A, Development of intra‐PV conduction block in SHRs. (Top) Negative exponential dependence between the aortic blood pressure (BP) and the maximal tension required to induce intra‐PV conduction block in normotensive rats (Wistar [WT]; black dots) and SHRs with BP <200 mm Hg (blue dots) and BP >200 mm Hg (red dots). (Bottom) Probability of intra‐PV conduction block estimated at different tensions applied to WT (n=8) and SHRs with BP <200 mm Hg and BP >200 mm Hg. B, (Top) PV activation maps and superimposed upstrokes of optical action potentials (Vm) recorded along the PV are shown for baseline (left) and pathological stretch (right) conditions in SHRs. (Bottom) Distribution of conduction velocity along the PV (left) and relative PV distance (in percentage from the PV length; right) activated at baseline, during stretch, and after application of swelling‐activated chloride ion channel (IC l,swell) blocker 9AC (9‐anthracenecarboxylic acid) are shown (n=4 per group). *P values were determined by 2‐way ANOVA with Bonferroni correction. C through F, Stretch‐induced changes in active potential (AP) parameters are shown for 2 groups of SHRs based on their BP. *P<0.05, **P<0.01, **P<0.01 vs SHR with BP <200 mm Hg, and # P<0.05, ## P<0.01, ### P<0.001 for PV distal (PV dis) vs PV ostium (PV ost) by repeated measurements 2‐way ANOVA with Bonferroni correction. APA indicates action potential amplitude; APD, action potential duration; FRP, functional refractory period.
Figure 8
Figure 8
Molecular and structural remodeling of caveolar mechanosensitive complex. A, Immunoblots for ClC‐2, ClC‐3, SWELL1, and Cav3 from Wistar (WT; n=4) and spontaneously hypertensive rat (SHR; n=4) pulmonary vein distal (PV dis) tissues. Expression levels were normalized to GAPDH. P values were determined by unpaired Student t test. B, Downregulation of Cav3 correlates with elevated membrane tension and disruption of caveolae structures during hypertension. Representative composite electron micrographs showing the lateral sarcolemmal membranes of cardiomyocytes from nonstretched WT and SHR PV dis tissues. Blue arrowheads denote caveolae connected to plasma membrane (scale bars=200 nm). C and D, Quantification of caveolae density, normalized to membrane length (C), and membrane convolution index (L/Lo−1) (D), n=40 cells per group. Box plots show medians with interquartile range; whiskers represent fifth and 95th percentile; each point represents 1 micrograph. P values were determined by unpaired Student t test. Cav3 indicates caveolin 3; ClC, chloride channel; L, length of membrane contour; Lo, shortest length connecting end points of membrane segment; SWELL1, also known as LRRC8A (leucine rich repeat containing protein 8A).

References

    1. Schotten U, Verheule S, Kirchhof P, Goette A. Pathophysiological mechanisms of atrial fibrillation: a translational appraisal. Physiol Rev. 2011;91:265–325. - PubMed
    1. Benjamin EJ, Levy D, Vaziri SM, D'Agostino RB, Belanger AJ, Wolf PA. Independent risk factors for atrial fibrillation in a population‐based cohort. The Framingham Heart Study. JAMA. 1994;271:840–844. - PubMed
    1. Haissaguerre M, Jais P, Shah DC, Takahashi A, Hocini M, Quiniou G, Garrigue S, Le Mouroux A, Le Metayer P, Clementy J. Spontaneous initiation of atrial fibrillation by ectopic beats originating in the pulmonary veins. N Engl J Med. 1998;339:659–666. - PubMed
    1. Tabatabaei N, Asirvatham SJ. Supravalvular arrhythmia: identifying and ablating the substrate. Circ Arrhythm Electrophysiol. 2009;2:316–326. - PubMed
    1. Sadek MM, Maeda S, Chik W, Santangeli P, Zado ES, Schaller RD, Supple GE, Frankel DS, Hutchinson MD, Garcia FC, Riley MP, Lin D, Dixit S, Callans DJ, Marchlinski FE. Recurrent atrial arrhythmias in the setting of chronic pulmonary vein isolation. Heart Rhythm. 2016;13:2174–2180. - PubMed

Publication types

Substances