. 2019 Nov 4;218(11):3548-3559.
doi: 10.1083/jcb.201809089. Epub 2019 Oct 9.

Phosphoregulation of tropomyosin is crucial for actin cable turnover and division site placement

Affiliations

Phosphoregulation of tropomyosin is crucial for actin cable turnover and division site placement

Saravanan Palani et al. J Cell Biol. .

Abstract

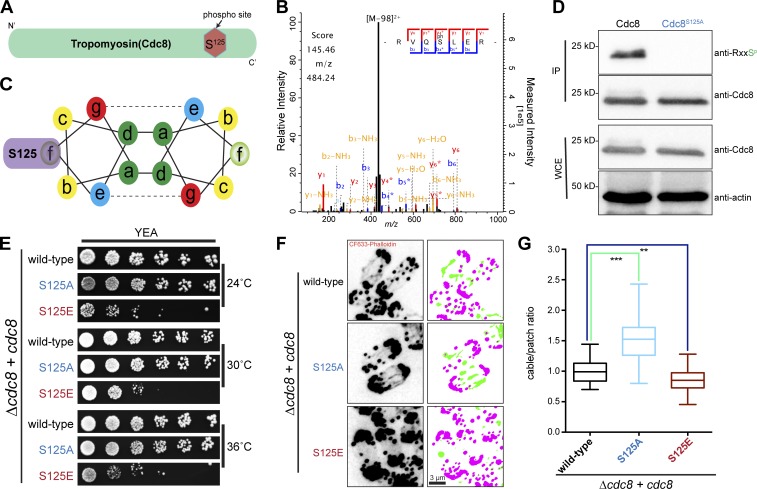
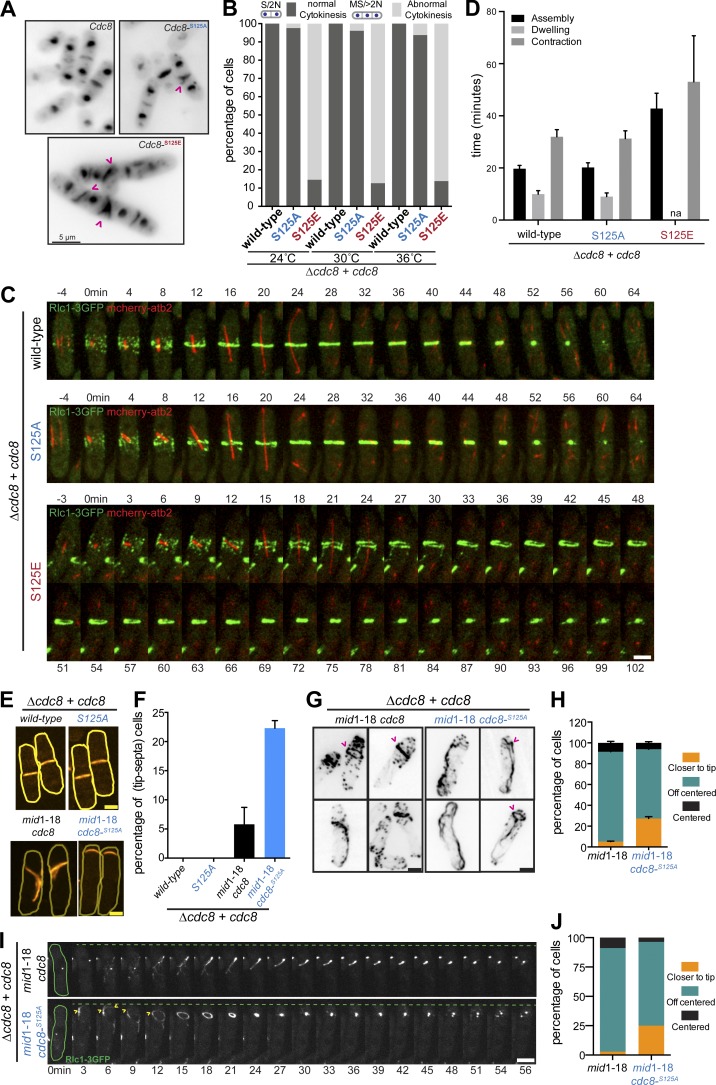
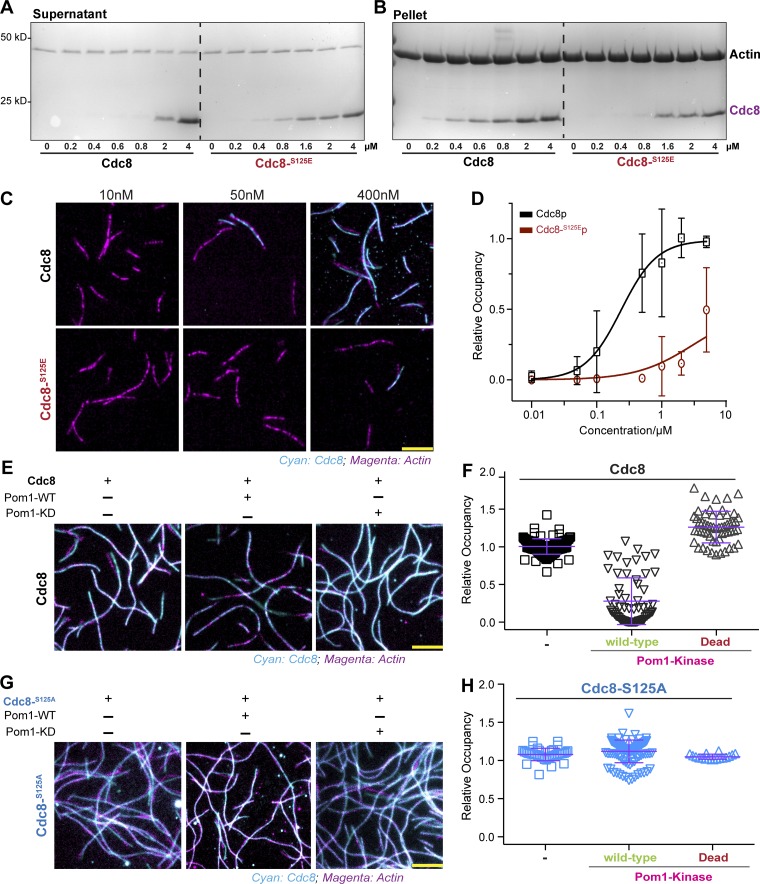
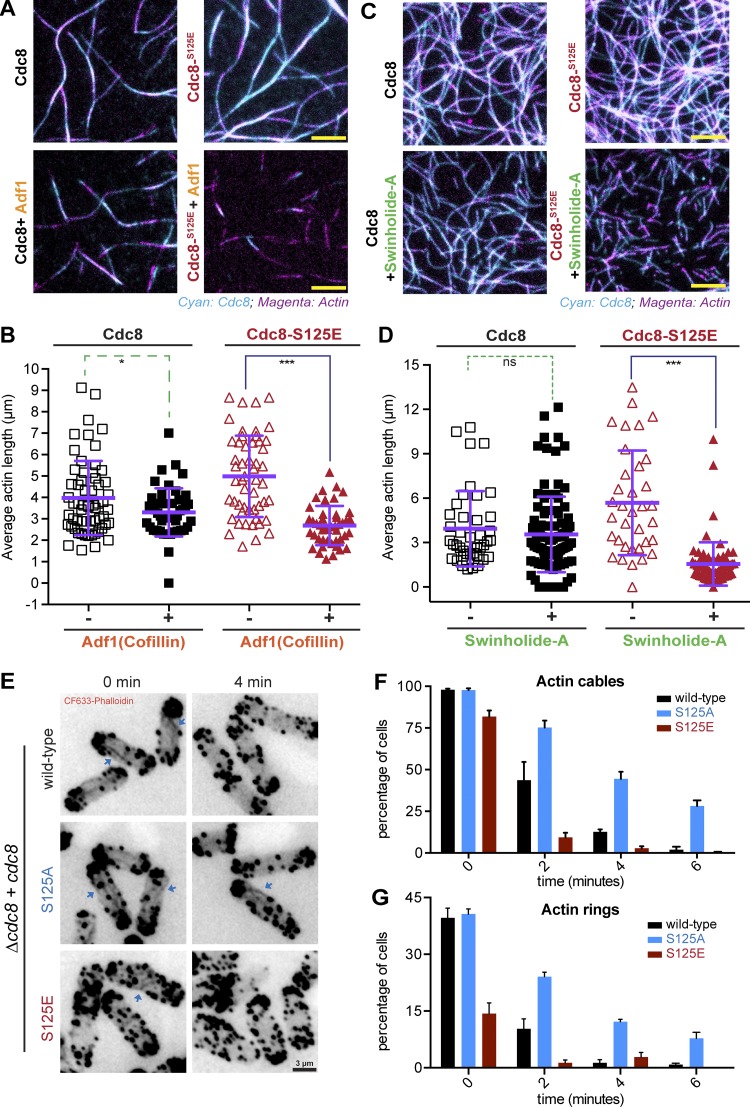
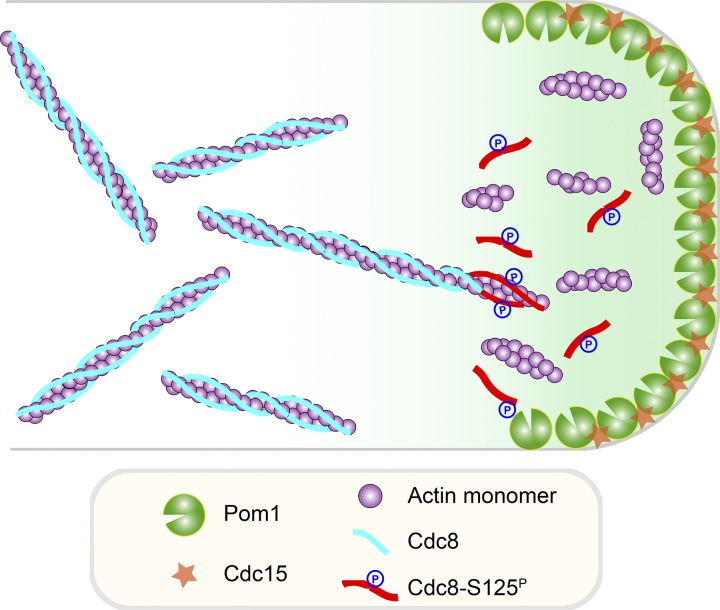
Tropomyosin is a coiled-coil actin binding protein key to the stability of actin filaments. In muscle cells, tropomyosin is subject to calcium regulation, but its regulation in nonmuscle cells is not understood. Here, we provide evidence that the fission yeast tropomyosin, Cdc8, is regulated by phosphorylation of a serine residue. Failure of phosphorylation leads to an increased number and stability of actin cables and causes misplacement of the division site in certain genetic backgrounds. Phosphorylation of Cdc8 weakens its interaction with actin filaments. Furthermore, we show through in vitro reconstitution that phosphorylation-mediated release of Cdc8 from actin filaments facilitates access of the actin-severing protein Adf1 and subsequent filament disassembly. These studies establish that phosphorylation may be a key mode of regulation of nonmuscle tropomyosins, which in fission yeast controls actin filament stability and division site placement.


Figures

Figure 1.
Figure 1.
Phosphoregulation of Cdc8-tropomyosin is important for actin cable stability and cytokinesis. (A) Schematic representation of the phosphorylation site on tropomyosin cdc8. (B) Graphical representation of the coiled-coil heptad repeat organization of Cdc8. Serine (S125) residue is positioned at f on the outside of the coiled-coil heptad. (C) Liquid chromatography-MS/MS spectra of one representative phosphopeptide carrying S125p. (D) Recognition of Cdc8 S125P, but not Cdc8 S125A, by an antibody against RXXSP. Cell lysates from cdc8 and cdc8-S125A cells were immunoprecipitated (IP) with Cdc8 antibodies and immune complexes or cell lysates (whole-cell extract; WCE) were immunoblotted using antibodies against Cdc8, RxxSp, and actin (loading control). (E) Assessment of colony formation by cdc8 mutants. 10-fold serial dilutions of cdc8+, cdc8-S125A, and cdc8-S125E inoculated on YES plates were incubated at indicated temperatures for 3 d. (F) Exponentially growing cdc8+, cdc8-S125A, and cdc8-S125E at 24°C were stained for actin structures with CF-633-phalloidin. Also shown are the corresponding segmentation of filaments (green) and patches (pink). Scale bar represents 3 µm. (G) Quantification of F by calculating the ratio of filament to patch area normalized to the average found in WT cells; n = [19, 30, 31] fields of view; box depicts median and 25% to 75% range, whiskers depict maximum and minimum. ***, P < 0.0001; **, P < 0.008.
Figure 2.
Figure 2.
A phosphomimetic Cdc8 mutant is affected for actin cable stability, actomyosin ring assembly, and contraction. (A) Exponentially growing cdc8+, cdc8-S125A, and cdc8-S125E at 24°C were fixed with 4% PFA. DAPI and anillin blue staining were used to visualize the DNA and septum. Abnormal septa in cdc8-S125E mutants (∼85% from >200 cells examined in two independent experiments) and split septa in cdc8-S125A (∼3% from two independent experiments; 200 cells with septa examined in each case) are highlighted with pink arrows. Scale bar represents 5 µm. (B) Quantification of cytokinetic defects in A. cdc8, cdc8-S125A, and cdc8-S125E cells following staining with DAPI (nucleus) and anillin blue (septa; n >300 each). (C) Time-lapse series of log-phase cells of the indicated genotypes (cdc8 [n = 23], cdc8-S125A [n = 36], and cdc8-S125E [n = 24]) expressing 3GFP-tagged myosin regulatory light chain (rlc1-3GFP) and mCherry-tagged tubulin (mCherry-atb2). Cells were grown at 24°C and imaged at 24°C. Images shown are maximum-intensity projections of z-stacks. Scale bar represents 3 µm. (D) Quantification of C. Timings of ring assembly, maturation, and contraction are shown. na, not applicable. (E) Exponentially growing WT, cdc8-S125A, mid1-18 cdc8, and mid1-18 cdc8-S125A were shifted from 24°C to 36°C for 3 h and stained with anillin blue. Scale bar represents 3 µm. (F) Quantification of septum position in E. n > 120 cells each, from two independent experiments. (G) Exponentially growing mid1-18 and mid1-18 cdc8-S125A were shifted from 24°C to 36°C for 3 h, fixed, and stained for actin structures with CF-633-phalloidin. Scale bar represents 3 µm. (H) Quantification of the actin ring position in G (n > 150 cells each, from two independent experiments). (I) Time-lapse series of exponentially growing mid1-18 [n = 34] and mid1-18 cdc8-S125A [n = 28] cells expressing (rlc1-3GFP). Cells were grown at 24°C and shifted to 36°C for 3 h before imaging. Images shown are maximum-intensity projections of z-stacks. Scale bar represents 3 µm. (J) Quantification of the actomyosin ring position in I (mid1-18, n = 34; mid1-18 cdc8-S125A n = 28). Error bars represent SD.
Figure 3.
Figure 3.
Phosphorylation of S125 in Cdc8 reduces affinity to F-actin. (A) Coomassie blue–stained gels of actin-tropomyosin cosedimentation assay using high-speed centrifugation. SDS-PAGE gel of supernatant. Each lane represents a pelleting experiment with a different concentration of ASCdc8 or ASCdc8-S125E. (B) Pellet fractions of ASCdc8 and ASCdc8-S125E mutants, respectively. Each lane represents a pelleting experiment with a different concentration of ASCdc8 or ASCdc8-S125E. (C) Image sequence showing the decoration of 125 nM F-actin-Alexa Fluor 488 (magenta) with ASCdc8-I76C-Atto-565 (top) or ASCdc8-I76C-S125E-Atto-565 (bottom) at indicated concentrations of Cdc8. Scale bar represents 5 µm. (D) Corresponding plot of relative F-actin decoration by ASCdc8-I76C (black) and ASCdc8-I76C-S125E (red), respectively, and fitted Hill functions (lines); WT, n = [20, 33, 46, 31, 25, 37, 6] filaments; S125E, n = [11, 9, 25, 20, 14, 27, 8] filaments. (E) Images showing decoration of 125 nM F-actin-Alexa Fluor 488 (magenta) with 400 nM ASCdc8-I76C-Atto-565 alone (left) or 5 min after addition of Pom1-WT (center) or Pom1-KD (right). Scale bar represents 5 µm. (F) Corresponding box plot of relative F-actin decoration by ASCdc8-I76C at indicated conditions; n = [119, 93, 56] fields of view. (G) Images showing decoration of 125 nM F-actin-Alexa Fluor 488 (magenta) with 400 nM ASCdc8-I76C-S125A-Atto-565 alone (left) or 5 min after addition of Pom1-WT (center) or Pom1-KD (right). Scale bar represents 5 µm. (H) Corresponding box plot of relative F-actin decoration by ASCdc8-I76C at indicated conditions; n = [40, 113, 18] fields of view. Error bars represent SD.
Figure 4.
Figure 4.
Cdc8 phosphorylation on S125 facilitates Adf1-mediated F-actin disassembly in vitro and actin cable turnover in vivo. (A) Images showing 125 nM F-actin-Alexa Fluor 488 (magenta) with 400 nM ASCdc8-I76C-Atto-565 (left) or 1,200 nM ASCdc8-I76C-S125E-Atto-565 (right) before (top) or after (bottom) addition of 100 nM Adf1/Cofilin (bottom). Scale bar represents 5 µm. (B) Corresponding box plot of average F-actin contour with ASCdc8-I76C (purple) and ASCdc8-I76C-S125E (red), respectively, before (hollow) and after (filled) Adf1 addition; WT, n = [74, 51] fields of view; S125E, n = [167, 221] fields of view. (C) Images showing 125 nM F-actin-Alexa Fluor 488 (magenta) with 400 nM ASCdc8-I76C-Atto-565 (left) or 1,200 nM ASCdc8-I76C-S125E-Atto-565 (right) before (top) or after (bottom) addition of 1,000 nM Swinholide-A (bottom). Scale bar represents 5 µm. (D) Corresponding box plot of average F-actin contour with ASCdc8-I76C (purple) and ASCdc8-I76C-S125E (red), respectively, before (hollow) and after (filled) Swinholide-A addition; WT, n = [41, 94] fields of view; S125E, n= [34, 76]. (E) cdc8+, cdc8-S125A and cdc8-S125E were treated with Lat-A (2.5 µM), and samples were taken every 2 min followed by 4% PFA fixation. Permeabilized cells were stained for actin structures with CF-633 (phalloidin). Scale bar represents 3 µm. (F) Quantification of E. Graph shows the fraction of cells with clearly detectable actin cables (n > 120 cells each from three independent experiments). (G) Quantification of E. Graph shows the fraction of cells with clearly detectable actin rings (n > 120 cells each from three independent experiments). Error bars represent SD. ns, not significant; ***, P < 0.0001; *, P < 0.017.
Figure 5.
Figure 5.
A schematic representation of Pom1-mediated Cdc8 phosphorylation and its role in actin dynamics. Pom1 kinase phosphorylates Cdc8, which causes an instability of actin filaments and inhibits actomyosin ring assembly near cell ends. See text for further details.

Similar articles

Cited by

References

    1. Bähler J., and Pringle J.R.. 1998. Pom1p, a fission yeast protein kinase that provides positional information for both polarized growth and cytokinesis. Genes Dev. 12:1356–1370. 10.1101/gad.12.9.1356 - DOI - PMC - PubMed
    1. Balasubramanian M.K., Helfman D.M., and Hemmingsen S.M.. 1992. A new tropomyosin essential for cytokinesis in the fission yeast S. pombe. Nature. 360:84–87. 10.1038/360084a0 - DOI - PubMed
    1. Barua B., Pamula M.C., and Hitchcock-DeGregori S.E.. 2011. Evolutionarily conserved surface residues constitute actin binding sites of tropomyosin. Proc. Natl. Acad. Sci. USA. 108:10150–10155. 10.1073/pnas.1101221108 - DOI - PMC - PubMed
    1. Bombardier J.P., Eskin J.A., Jaiswal R., Corrêa I.R. Jr., Xu M.Q., Goode B.L., and Gelles J.. 2015. Single-molecule visualization of a formin-capping protein ‘decision complex’ at the actin filament barbed end. Nat. Commun. 6:8707 10.1038/ncomms9707 - DOI - PMC - PubMed
    1. Brown J.H., and Cohen C.. 2005. Regulation of muscle contraction by tropomyosin and troponin: how structure illuminates function. Adv. Protein Chem. 71:121–159. 10.1016/S0065-3233(04)71004-9 - DOI - PubMed

Publication types

MeSH terms