. 2019 Nov 15;294(46):17437-17450.
doi: 10.1074/jbc.RA119.010401. Epub 2019 Oct 9.

Impact of key residues within chloroplast thioredoxin- f on recognition for reduction and oxidation of target proteins

Affiliations

Impact of key residues within chloroplast thioredoxin- f on recognition for reduction and oxidation of target proteins

Yuichi Yokochi et al. J Biol Chem. .

Abstract

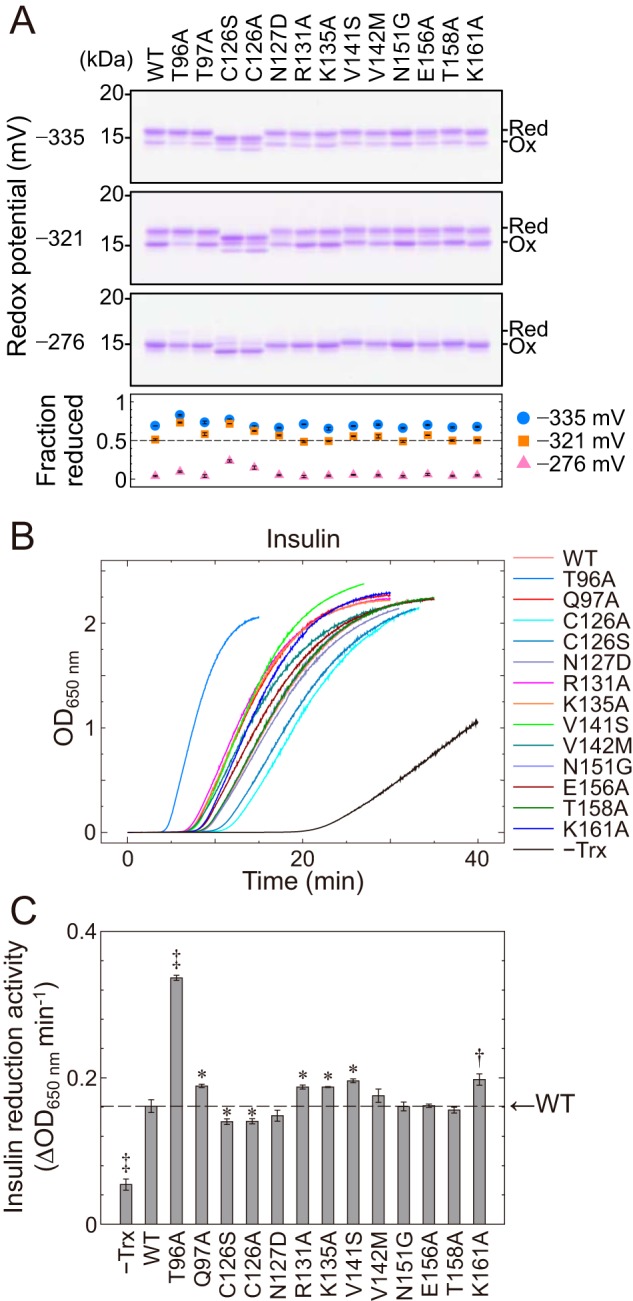
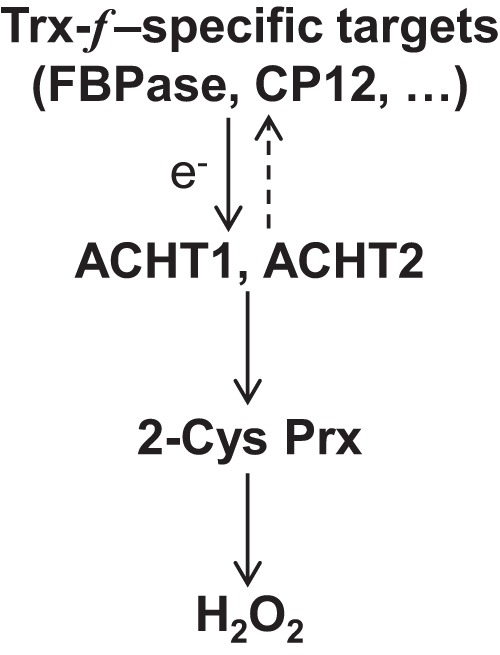
Thioredoxin (Trx) is a redox-responsive protein that modulates the activities of its target proteins mostly by reducing their disulfide bonds. In chloroplasts, five Trx isoforms (Trx-f, Trx-m, Trx-x, Trx-y, and Trx-z) regulate various photosynthesis-related enzymes with distinct target selectivity. To elucidate the determinants of the target selectivity of each Trx isoform, here we investigated the residues responsible for target recognition by Trx-f, the most well-studied chloroplast-resident Trx. As reported previously, we found that positively-charged residues on the Trx-f surface are involved in the interactions with its targets. Moreover, several residues that are specifically conserved in Trx-f (e.g. Cys-126 and Thr-158) were also involved in interactions with target proteins. The validity of these residues was examined by the molecular dynamics simulation. In addition, we validated the impact of these key residues on target protein reduction by studying (i) Trx-m variants into which we introduced the key residues for Trx-f and (ii) Trx-like proteins, named atypical Cys His-rich Trx 1 (ACHT1) and ACHT2a, that also contain these key residues. These artificial or natural protein variants could reduce Trx-f-specific targets, indicating that the key residues for Trx-f are critical for Trx-f-specific target recognition. Furthermore, we demonstrate that ACHT1 and ACHT2a efficiently oxidize some Trx-f-specific targets, suggesting that its target selectivity also contributes to the oxidative regulation process. Our results reveal the key residues for Trx-f-specific target recognition and uncover ACHT1 and ACHT2a as oxidation factors of their target proteins, providing critical insight into redox regulation of photosynthesis.

Keywords: atypical Cys His-rich thioredoxin; chloroplast; disulfide bond; oxidation-reduction (redox); photosynthesis; protein–protein interaction; redox regulation; target selectivity; thioredoxin.


Conflict of interest statement

The authors declare that they have no conflicts of interest with the contents of this article

Figures

Figure 1.
Figure 1.
Residues specifically conserved in each type of Trxs. A, amino acid sequence comparison of chloroplast Trxs from various plants. In the alignment result, the type-specific residues, active-site residues, and residues conserved among Trx-x, Trx-y, and Trx-z are highlighted in magenta or black, orange, and gray, respectively. The residue numbers of A. thaliana Trx-f1 (counted from the translational start site amino acid methionine) are shown above the figure. Each letter and an asterisk below the alignment result denote conserved residues in typical Trxs (2) and the cis-Pro−1 residue (20), respectively. The secondary structure of SoTrx-f (PDB code 1F9M) is shown on the Secondary structure line. On the Interaction interface line, the residues of Trxs that are predicted to interact with target proteins (upper, blue) or Trx reductases (bottom, green) are shown. Full names of the organisms are described in Table S1. B–D, model structure of A. thaliana Trx-f1. Trx-f–specific residues (magenta) and Cys residues in the active site (orange) (B and C), residues involved in the interaction with targets (blue) (D) are shown in a ribbon or molecular surface model.
Figure 2.
Figure 2.
Redox properties of A. thaliana Trx-f1 variants. A, Em range of Trx-f1 variants. Each variant was incubated in the buffer containing 50 mm oxidized DTT and 9, 3, and 0.09 mm reduced DTT, whose redox potential values are −335, −321, and −276 mV at pH 7.5, respectively. Other conditions are same as those for determination of Em described under “Experimental procedures.” Reduced (Red) and oxidized (Ox) Trxs were discriminated via the thiol group modification using 4-acetamido-4′-maleimidylstilbene-2,2′-disulfonate followed by SDS-PAGE. Values of reduced fractions are presented as the mean ± S.D. (n = 3). B, time-dependent insulin reduction by Trx-f1 variants. In the presence of 0.5 mm reduced DTT, 230 μm bovine insulin was incubated with 5 μm Trx-f1 variants. Turbidity resulting from reduced insulin was monitored at 650 nm. C, insulin reduction activities of Trx-f1 variants. The activity of each variant was determined by linear regression of the data shown in B. Values are presented as the mean ± S.D. (n = 3). Each symbol indicates a significant difference (*, p < 0.05; †, p < 0.01; ‡, p < 0.001; Welch's t test) between the designated value and the value of WT Trx-f1.
Figure 3.
Figure 3.
Trx-f–specific target reduction activities of Trx-f1 variants. A, determination of the redox state of FBPase reduced by Trx-f1 variants. In the presence of 0.5 mm DTT, 1 μm FBPase was incubated with 0.1 μm Trx and precipitated at each time point. Reduced (Red) and oxidized (Ox) Trxs were discriminated via the thiol group modification using 4-acetamido-4′-maleimidylstilbene-2,2′-disulfonate followed by SDS-PAGE. Magenta and blue bars at the left side of each gel image indicate molecular mass markers of 50 and 37 kDa, respectively. B, time-dependent reduction of CROST1 and FBPase. In the presence of 0.1 mm DTT, CROST1 (0.1 μm) reduction by 0.03 μm Trx was monitored by measuring the FRET intensity as described under “Experimental procedures.” Redox state of FBPase was determined in A and plotted. For the clarity, the graphs do not include error bars. The graphs with error bars are shown in Fig. S1. C, comparison of the Trx-f–specific target reduction activities of Trx-f1 variants. Reduction activity (μm−1 min−1) was determined by fitting the data of B to the pseudo first-order Equation 1. The obtained values were then normalized using the value of each WT Trx-f1 activity (CROST1: 23.8 μm−1 min−1; FBPase: 0.862 μm−1 min−1) and are presented as the mean ± S.D. (n ≥ 3). Each symbol indicates a significant difference (†, p < 0.01; ‡, p < 0.001; Welch's t test) between the designated value and the value of WT Trx-f1. n.d., not detected.
Figure 4.
Figure 4.
MD simulations of the model structure of Trx-f1/FBPase complex. A, stereo view of a Trx-f1/FBPase complex. Dark gray and cyan molecules are Trx-f1 and FBPase, respectively. The regulatory loop of FBPase and redox-active Cys residues of Trx and FBPase are highlighted in pink, orange, and yellow, respectively. Atoms and bonds of the key residues for Trx-f and redox-active Cys residues are shown. Residue numbers are shown in Movies S1–S3. B, time evolution of smallest pairwise heavy atom distances between the key residues of Trx-f and any residue of FBPase (dmin).
Figure 5.
Figure 5.
Trx-f–specific target reduction activities of Trx-m2 variants and ACHT proteins. A, time-dependent CROST1 reduction by Trx-m2 variants and ACHT proteins. In the presence of 0.1 mm DTT, CROST1 (0.1 μm) reduction by 0.03 μm Trx or ACHT was monitored by measuring the FRET intensity as described under “Experimental procedures.” B, CROST1 reduction activities of Trx-m2 variants and ACHT proteins. Activity (μm−1 min−1) was determined by fitting the data of A to the pseudo first-order Equation 1, and data are presented as the mean ± S.D. (n = 3). Each symbol indicates a significant difference (*, p < 0.05; †, p < 0.01; ‡, p < 0.001; Welch's t test) between the designated value and that of Trx-m2WT. C, FBPase reduction activities of Trx-m2 variants. After 30 min of incubation of 1 μm oxidized (Ox) FBPase with 2 μm Trx in the presence of 0.5 mm reduced (Red) form of DTT, the fraction of reduced FBPase was determined via a thiol group modification-based method followed by band intensity measurement. D, amino acid sequence comparison of A. thaliana Trx-f1, Trx-f2, Trx-m2, and ACHT proteins. The key residues for Trx-f and the active-site residues are highlighted in black and orange, respectively. Residue numbers of A. thaliana Trx-f1 (counted from the translational start site amino acid methionine) are shown above the figure. The phylogenetic tree is shown with bootstrap values (%). E, FBPase reduction activities of ACHT proteins. FBPase reduction by ACHT proteins was monitored as described in C.
Figure 6.
Figure 6.
Em values of ACHT proteins. A and B, redox titration of ACHT proteins. The SDS-polyacrylamide gel images of redox titration are shown with the molar ratio of reduced and oxidized form of DTT. Reduced (Red) and oxidized (Ox) ACHT proteins were discriminated via the thiol group modification using 4-acetamido-4′-maleimidylstilbene-2,2′-disulfonate followed by SDS-PAGE. A, data obtained from the gel image were fitted to the Nernst equation, and the Em values of ACHT1 and ACHT2a were determined. All data, including Em values, are presented as the mean ± S.D. (n = 3). B, Em of ACHT4a was not determined because multiple band-shift patterns appeared, and the redox states could not be assigned. C, Em values of typical Trx, TrxL2, and ACHT proteins at pH 7.5. The Em values of typical Trx and TrxL2 proteins were determined in our previous research (18, 21, 32), and those of ACHT proteins determined in this study are summarized. These Em values were determined by using the same method.
Figure 7.
Figure 7.
Capacity of ACHTs to oxidize Trx-f–specific targets. A, time-dependent oxidation of CROST1 by Trx-f1 and ACHT proteins. In the presence of 50 mm oxidized DTT, 0.1 μm reduced CROST1 was incubated with 1 μm Trx, 1 μm ACHT, 0.1 μm ACHT1, or 0.1 μm ACHT2a, and the redox state of CROST1 was monitored by measuring the FRET intensity. Each value represents the mean ± S.D. (n = 3). B, determination of the redox state of FBPase oxidized by Trx-f1 and ACHT proteins. Without the oxidizing reagent, 2 μm reduced FBPase was incubated with 2 μm oxidized Trx or ACHT and precipitated at each time point. Reduced (Red) and oxidized (Ox) proteins were discriminated via the thiol group modification using 4-acetamido-4′-maleimidylstilbene-2,2′-disulfonate followed by SDS-PAGE. C, time-dependent oxidation of FBPase by Trx-f1 and ACHT proteins. Redox state of FBPase was determined in B and plotted. Each value represents the mean ± S.D. (n = 3).
Figure 8.
Figure 8.
Trx- or ACHT-dependent H2O2 detoxification by Prxs. H2O2 detoxification by Prxs with 0.5 mm reduced DTT in the presence or absence of Trx-f1 or ACHT was monitored as described under “Experimental procedures.” Each value represents the mean ± S.D. (n = 3).
Figure 9.
Figure 9.
Conservation of the key residues for Trx-f in TrxL2 and NTRC molecules. A, amino acid sequence comparison of Trx-f1 and TrxL2 proteins. The residue numbers of Trx-f1 and TrxL2.1 counted from the translational start site amino acid methionine are indicated above (black) and below (sky blue) the alignment result, respectively. B, structure comparison of Trx-f1 (light gray) and TrxL2.1 (sky blue). A and B, residues of TrxL2.1 corresponding to the key residues for Trx-f are highlighted in green. C, amino acid sequence comparison of Trx-f1 and Trx domains of plant NTRCs. The residue numbers of A. thaliana NTRC counted from the translational start site amino acid methionine are shown above the figure. Residues highlighted in magenta are the cis-Pro−1 residues of NTRC. Full names of the organisms are described in Table S1. A–C, residues highlighted in orange and black are the active site and the key residues for Trx-f, respectively.
Figure 10.
Figure 10.
Conservation of the key residues for Trx-f among Trx-f proteins from various plants. The residue numbers of A. thaliana Trx-f1 (counted from the translational start site amino acid methionine) are shown above the figure. Residues highlighted in orange and black are the active site and the key residues for Trx-f, respectively. The phylogenetic tree is shown with bootstrap values (%). Full names of the organisms are described in Table S1.
Figure 11.
Figure 11.
Redox cascade proposed in this study. Arrows indicate electron transfer reactions. Dashed line arrow indicates less efficient reaction.

References

    1. Martin J. L. (1995) Thioredoxin–a fold for all reasons. Structure 3, 245–250 10.1016/S0969-2126(01)00154-X - DOI - PubMed
    1. Collet J. F., and Messens J. (2010) Structure, function, and mechanism of thioredoxin proteins. Antioxid. Redox Signal. 13, 1205–1216 10.1089/ars.2010.3114 - DOI - PubMed
    1. Ingles-Prieto A., Ibarra-Molero B., Delgado-Delgado A., Perez-Jimenez R., Fernandez J. M., Gaucher E. A., Sanchez-Ruiz J. M., and Gavira J. A. (2013) Conservation of protein structure over four billion years. Structure 21, 1690–1697 10.1016/j.str.2013.06.020 - DOI - PMC - PubMed
    1. Buchanan B. B. (1980) Role of light in the regulation of chloroplast enzymes. Annu. Rev. Plant Physiol. Plant Mol. Biol. 31, 341–374 10.1146/annurev.pp.31.060180.002013 - DOI
    1. Jacquot J.-P., Vidal J., Gadal P., and Schürmann P. (1978) Evidence for the existence of several enzyme-specific thioredoxins in plants. FEBS Lett. 96, 243–246 10.1016/0014-5793(78)80410-4 - DOI

Publication types

MeSH terms