. 2019 Oct;574(7778):413-417.
doi: 10.1038/s41586-019-1641-1. Epub 2019 Oct 9.

Population imaging of neural activity in awake behaving mice

Affiliations

Population imaging of neural activity in awake behaving mice

Kiryl D Piatkevich et al. Nature. 2019 Oct.

Abstract

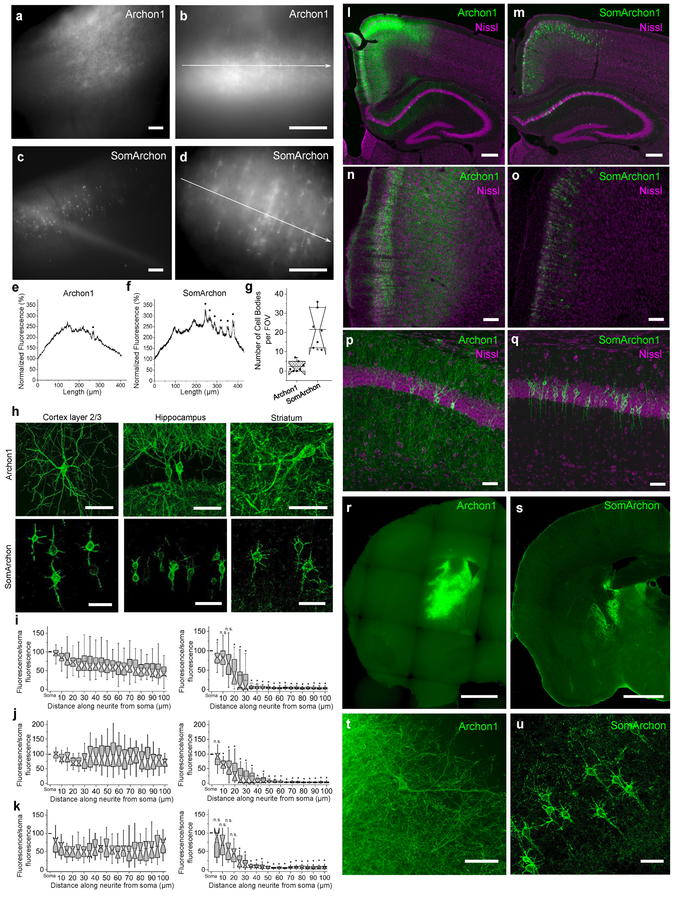
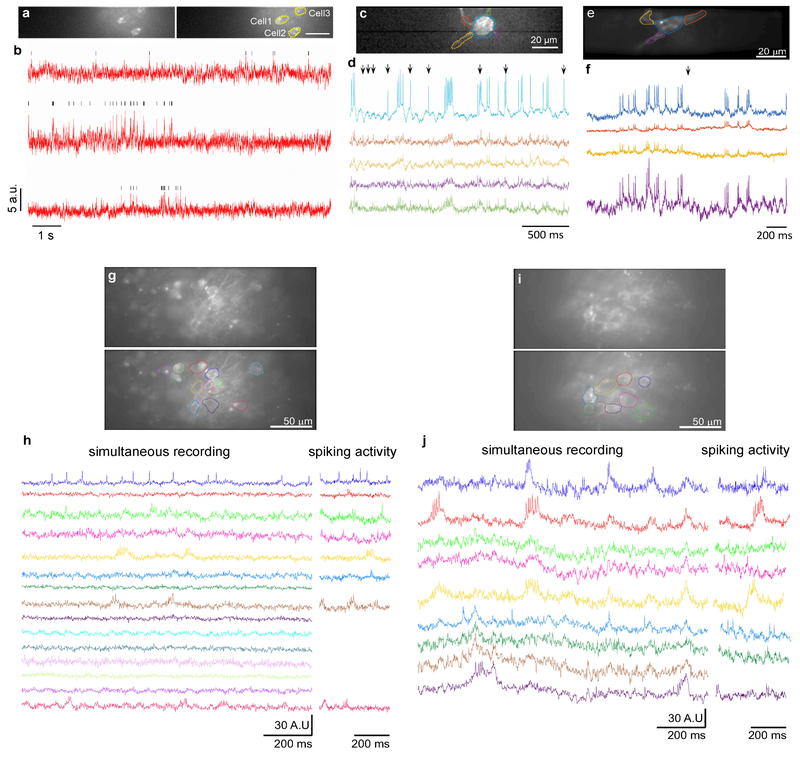
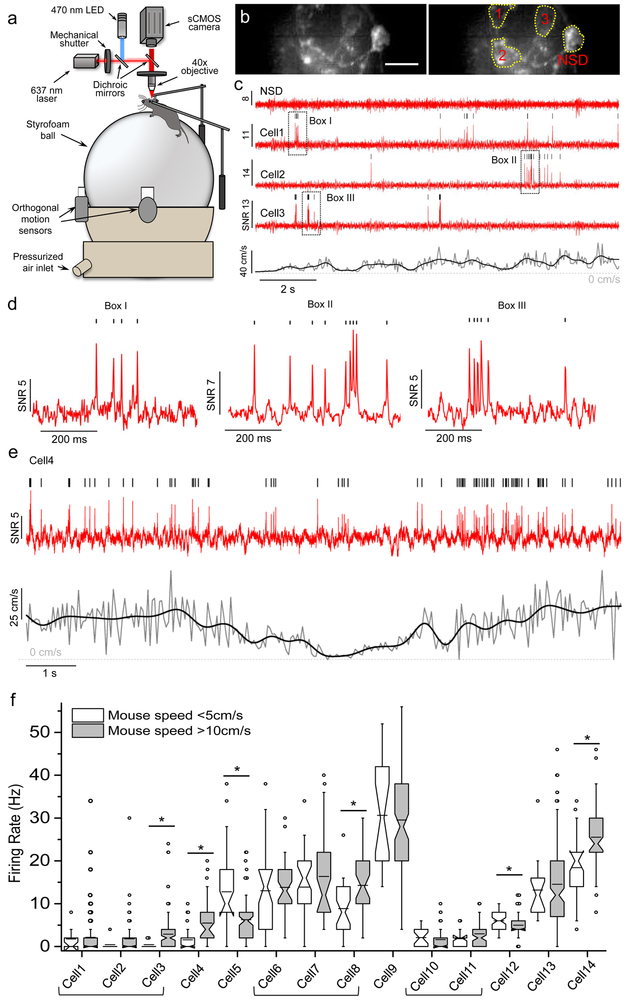
A longstanding goal in neuroscience has been to image membrane voltage across a population of individual neurons in an awake, behaving mammal. Here we describe a genetically encoded fluorescent voltage indicator, SomArchon, which exhibits millisecond response times and is compatible with optogenetic control, and which increases the sensitivity, signal-to-noise ratio, and number of neurons observable several-fold over previously published fully genetically encoded reagents1-8. Under conventional one-photon microscopy, SomArchon enables the routine population analysis of around 13 neurons at once, in multiple brain regions (cortex, hippocampus, and striatum) of head-fixed, awake, behaving mice. Using SomArchon, we detected both positive and negative responses of striatal neurons during movement, as previously reported by electrophysiology but not easily detected using modern calcium imaging techniques9-11, highlighting the power of voltage imaging to reveal bidirectional modulation. We also examined how spikes relate to the subthreshold theta oscillations of individual hippocampal neurons, with SomArchon showing that the spikes of individual neurons are more phase-locked to their own subthreshold theta oscillations than to local field potential theta oscillations. Thus, SomArchon reports both spikes and subthreshold voltage dynamics in awake, behaving mice.


Figures

Extended Data Fig. 1.
Extended Data Fig. 1.. Expression of Archon1 and SomArchon in mouse brain.
(a,b) Representative Archon1- and (c,d) SomArchon-expressing mouse brain slices (CAG promoter, via IUE) imaged with a wide-field microscope with (a,c) 10x and (b, d) 40x objective lenses (from n = 7 slices from 2 mice each). (e, f) Normalized EGFP fluorescence along white arrows shown in b and d. Black dots correspond to resolvable cells. (g) Number of resolvable cells per field of view (FOV) for Archon1- and SomArchon-expressing brain slices (2.4 ± 2.5 and 22 ± 9 neurons per FOV (350×415 μm2) for Archon1 and SomArchon respectively; mean ± standard deviation; n = 7 slices from 2 mice each; boxplots as in Fig. 1). Further confocal analysis with larger FOVs of 500×500×50 μm3 revealed that SomArchon can resolve ~15 times more neurons in the cortex than Archon1 (n = 4, 8, 9, 11, 11, 18, and 20 neurons from 7 slices for Archon1, versus n=180, 187, and 137 neurons from 3 slices for SomArchon). (h) Representative confocal images of neurons in cortex layer 2/3 (left), hippocampus (middle), and striatum (right) expressing Archon1 (top) and SomArchon (bottom). (i-k) EGFP fluorescence along a neurite, normalized to soma, for Archon1- (left) and SomArchon- (right) expressing neurons in (i) cortex layer 2/3 (n=39 and 37 neurites from 10 cells from 2 mice each), (j) hippocampus (n=20 and 34 neurites from 9 and 17 cells from 2 mice each), and (k) striatum (n=17 and 20 neurites from 7 cells from 2 mice each). Box plots as in Fig. 1. n.s.: not significant; *: p < 0.002 compared to Archon1 at corresponding position away from the soma; two-sample Kolmogorov-Smirnov test, see Supplementary Table 2. (l-u) Representative confocal fluorescence images of Archon (left column) and SomArchon-expressing slices (right column) via (l-q) IUE or (r-u) AAV injection (green: EGFP; magenta: Nissl staining) in (n,o) cortex layer 2/3 (n = 8 slices from 2 mice), (p,q) hippocampus (n = 8 slices from 2 mice), and (t,u) striatum (n = 6 slices from 2 mice). Scale bars: 100 μm, a-d; 50 μm, h,n-q,t,u; 250 μm, l,m,r,s.
Extended Data Fig. 2.
Extended Data Fig. 2.. Voltage imaging using SomArchon in mouse brain slices.
(a-d) Representative fluorescence wide-field images of cortex layer 2/3 neurons expressing SomArchon via (a) AAV transduction or (c) IUE with selected ROIs (bottom), and (b,d) corresponding fluorescence traces (n = 6 and 13 slices from 2 and 4 mice for AAV transduction and IUE, respectively). Acquisition rate: 632 Hz, b;, 440Hz, d. (e) Representative fluorescence wide-field images of striatal neurons expressing SomArchon via AAV transduction (top) with selected ROIs (bottom), and (f) corresponding fluorescence traces (n = 8 slices from 2 mice). Acquisition rate: 733 Hz. (g) Representative fluorescence wide-field images of hippocampal neurons expressing SomArchon via IUE (top) with selected ROIs (bottom), and (h) corresponding fluorescence traces (n = 8 slices from 2 mice). Acquisition rate: 333 Hz. (i) Fluorescence wide-field images of thalamus neurons expressing SomArchon (top) via AAV transduction with selected ROIs (bottom), and (j) corresponding fluorescence traces (n = 5 slices from 2 mice). Acquisition rate: 333 Hz. Scale bars, 25 μm.
Extended Data Fig. 3.
Extended Data Fig. 3.. SomArchon expression and voltage imaging do not alter membrane properties or cause phototoxicity.
(a) Membrane properties of Archon- (hashed boxes) and SomArchon-expressing (open boxes) neurons in cortex layer 2/3 brain slices (p=0.8026, 0.8895, 0.8236, two-side Wilcoxon Rank Sum test, comparing Archon1 versus SomArchon, for resistance, capacitance, and resting potential respectively; n= 8 and 18 cells from 1 and 2 mice for Archon1 and SomArchon). (b) Similar to a, but in hippocampus (p=0.6294, 0.9720, 0.8880, 0.0037, two-side Wilcoxon Rank Sum test, comparing negative versus SomArchon for resistance, capacitance, resting potential, FWHM, n = 8 and 7 cells from 2 mice each for negative and SomArchon for resistance and resting potential comparison; n= 7 and 7 cells from 2 mice each for negative and SomArchon for capacitance comparison. FWHM: p=0.0037, n= 7 and 8 cells from from 2 mice each for negative and SomArchon for FWHM comparison). (c) Similar to a, but in striatum (p=0.7380, 0.8357, 0.7751, 0.0931, two-side Wilcoxon Rank Sum test, comparing negative and SomArchon, for resistance, capacitance, resting potential and FWHM; n = 7 and 6 cells from 2 mice each for negative and SomArchon for resistance and capacitance comparisons; n = 6 and 7 cells from 2 mice each for negative and SomArchon for resting potential comparison; n = 6 and 6 cells from 2 mice each for negative and SomArchon for FWHM comparisons). (d) Changes of relative reactive oxygen species (ROS) concentration (normalized to that before illumination) over time in negative (solid line) and SomArchon-expressing (dashed line) cultured mouse neurons under various illumination protocols. (e) Maximal increase in ROS concentration during continuous illumination for conditions performed in d (n=45, 24, and 8 negative neurons from 2, 2, and 1 cultures for 390/22 nm, 475/36 nm, and 637 nm illumination, respectively; n = 24 SomArchon-expressing neurons for 637 nm illumination from 1 culture). (f) Cell death for negative (solid line) and SomArchon-expressing (dashed line) cultured neurons at DIV 14–18 under various illumination protocols. (n=45, 35, 91, 40, and 27 neurons from 2, 1, 2, 1, and 1 cultures respectively for 390/22 nm at 2.8 mW/mm2, 390/22 nm at 5.5 mW/mm2, 475/36 nm at 12 mW/mm2, 475/36 nm at 25 mW/mm2, and 637 nm at 1500 mW/mm2 illumination). (g) Bright-field and fluorescence images of representative neurons expressing SomArchon before and after 10 min of continuous 637nm laser illumination at 1500 mW/mm2, followed by 10 min in darkness (93% of imaged cells did not exhibit noticeable changes in morphology; n = 27 cells from 1 culture; non-illuminated cells did not show any changes in morphology; n = 10 cells from 1 cultures). Scale bar, 50 μm. (h) Representative SomArchon fluorescence trace from neuron co-expressing SomArchon and CoChR-Kv2.1motif. (i) Normalized spike rates (to initial value) elicited by blue light illumination dropped after 300 s of continuous recording, due to decrease in spike amplitude as a result of photobleaching (n = 10 neurons from 1 culture; plotted as mean ± standard deviation). (j) Normalized (to initial value) full width half maximum (FWHM) of spikes elicited by continuous light exposure as in h. Box plots displayed as in Fig. 1.
Extended Data Fig. 4.
Extended Data Fig. 4.. SomArchon expression in vivo does not cause gliosis.
SomArchon was expressed in the mouse brain by AAV2.9-Syn-SomArchon-P2A-CoChR-KV2.1motif injection into the cortex in P0 Swiss Webster mice. Brain tissues were analyzed 63 days post viral injection. (i) Merged fluorescence images from 50 μm-thick coronal sections were visualized via (ii) EGFP fluorescence of SomArchon, (iii) anti-Iba1 immunofluorescence, and (iv) anti-GFAP immunofluorescence (n = 4 slices from 2 mice). (a) Expression throughout the coronal section. (b) Zoomed-in view on the virally injected area (high expression cortex). (c) Zoomed-in view on the non-injected contralateral hemisphere (low expression cortex). GFAP and Iba1, commonly used glial and microglial markers, showed similar appearance on the virally injected hemisphere versus the non-injected hemisphere, suggesting that expression of SomArchon did not cause gliosis. Scale bars: 1 mm, a; and 250 μm, b,c.
Extended Data Fig. 5.
Extended Data Fig. 5.. Side-by-side comparison of next-generation voltage indicators in mouse brain slices.
(a) Representative fluorescence images of mouse cortex layer 2/3 neurons expressing ASAP3-KV2.1motif (ASAP3-Kv), Ace2N-HaloTag-KGC-ER2-KV2.1motif (Voltron-ST), QuasAr3-PP-mCitrine-KV2.1motif-ER2 (QuasAr3-s), and paQuasAr3-PP-mCitrine-KV2.1motif-ER2 (paQuasAr3-s). ASAP3-Kv, QuasAr3-s and paQuasAr3-s were visualized via cpGFP, mCitrine, and mCitrine fluorescence respectively, using laser excitation at 488 nm and emission at 525/50 nm under a confocal microscope. Voltron-ST was visualized via JF525 fluorescence using LED excitation at 510/25 nm and emission at 545/40 nm under a wide-field microscope. Scale bar, 50 μm. (b) Single-trial optical recordings of ASAP3-Kv (green) and Voltron-ST/JF525 (orange) fluorescence responses during 4-aminopyridine evoked neuronal activity, and QuasAr3-s (blue), paQuasAr3-s (brown), and SomArchon (red) fluorescence responses during CoChR-mTagBFP2-KV2.2motif evoked neuronal activity. Acquisition rate ~500 Hz. Blue light pulses (470/20nm, 2ms per pulse, 10Hz), shown as vertical blue bars, were used to activate CoChR to evoke spiking. (c,d) Quantification of (c) ΔF/F and (d) signal-to-noise ratio (SNR) per AP across all recordings (n=18, 14, 9, 13, and 14 neurons from 1, 2, 2, 2, and 2 mice for ASAP3-Kv, Voltron-ST/JF525, QuasAr3-s, paQuasAr3-s, and SomArchon, respectively). Box plots displayed as in Fig. 1. (*p < 0.01, Wilcoxon rank sum test; see Supplementary Table 2 for statistics) (e) Photobleaching curves of ASAP3-Kv, Voltron-ST/JF525, and SomArchon under continuous illumination (n=11, 8, and 17 neurons from 1 culture, respectively).
Extended Data Fig. 6.
Extended Data Fig. 6.. SomArchon enables both local dendritic and population imaging of neurons in multiple brain regions in vivo.
(a) Fluorescence images of selected FOV in motor cortex (left) with selected ROIs corresponding to somas of three neurons (right) (n = 1 FOV from 1 mouse). Scale bar, 50 μm. (b) Representative fluorescence traces from a with detected spikes (black ticks). (c) Fluorescence image of a hippocampal neuron expressing SomArchon with ROIs selected at the soma and on four proximal dendrites (n = 1 neuron from 1 mouse). Scale bar, 20 μm. (d) Optical voltage traces from the selected ROIs shown in c. (e) Fluorescence image of a striatal neuron expressing SomArchon with ROIs selected at the soma and on three proximal dendrites (n = 1 neuron from 1 mouse). Scale bar, 20 μm. (f) Optical voltage traces from the selected ROIs shown in e. Black arrows highlight example instances when dendritic voltages visibly differed from those on the soma. (g-k) In vivo population voltage imaging in the hippocampus CA1 region (n = 14 FOVs from 3 mice). (g, i) Average intensity projection image for each video (top), and with identified ROIs (bottom). (h, j) Optical voltage traces for each neuron shown in g,i, respectively, with colors matching corresponding ROI colors. Shown are 1.2 seconds of simultaneously recorded voltage for all neurons (left), and a zoomed-in period with prominent spikes (right). Image acquisition rate for all recordings: 826 Hz.
Extended Data Fig. 7.
Extended Data Fig. 7.. Properties of striatal neurons and movement thresholds.
(a) Average firing rate, size, and interspike interval (ISI) for the 14 neurons recorded in 9 FOV in 2 mice. Cells simultaneously recorded in the same FOV are color-coded (blue, red, green). Cells in rows with a white background were recorded individually. (b) Selected trace from Cell 9 exhibiting spike bursting (top), and a zoomed view of the boxed region (bottom). A.U. arbitrary unit. Identified spikes are indicated by the black dots on top of the trace. (c) Single frame images for FOVs with multiple neurons. Each FOV is color-coded to match a. Scale bars, 20 μm. (d) Representative optical traces of two striatal cholinergic interneurons from Cre-dependent SomArchon-expressing in a ChAT-Cre mouse (left, scale bar, 20 μm), recorded in 3 sessions, while mouse was awake, head-fixed and navigating a spherical treadmill (n = 2 neurons from 1 mouse). Two bottom traces are from the same neuron, left, bottom. Image acquisition rate, 826 Hz. (e) Histogram of instantaneous movement speeds for all FOVs shown in Fig. 3 (9 FOVs in 2 mice). Instantaneous movement speed was calculated as average speed during each 0.5-second time interval. Red line, threshold for low movement speed identification; green line, threshold for high movement speed identification. (f) Histogram of instantaneous movement speed for individual FOVs analyzed.
Extended Data Fig. 8.
Extended Data Fig. 8.. In vivo SomArchon performance over time in the striatum and hippocampus of awake mice.
(a-h) Average fluorescence intensity, SNR per spike, and firing rates of neurons in the striatum and hippocampus of awake mice, over multiple trials. (a-c) In each striatal recording session, we performed 5 trials, each 12 seconds long, with inter-trial intervals of 30–60 seconds. (a) Average fluorescence intensity decreased slightly, while (b) spike SNR and (c) firing rates remained constant throughout the recording session (repeated measures ANOVA, n = 6 neurons in 5 FOVs from one mouse). (d-h) In each hippocampal recording session, we performed 10 trials, each 6 seconds long, with inter-trial intervals of 20–30 seconds. (d) Average fluorescence intensity showed a slight but significant decrease across trials. (e) SNR decreased between the 1st and 2nd trials but not afterwards, and (f) the firing rate remained constant. (g) Spike amplitude fluctuated randomly over trials, and (h) there was a significant increase in baseline noise between the 1st and 2nd trials (repeated measures ANOVA; *: p<0.05, post-hoc test: Tukey’s HSD test, n = 16 neurons in 7 FOVs from 4 mice, see Supplementary Table 2). Measurements were normalized to the first trial for each neuron. All box plots displayed are as in Fig. 4. (i-m) A representative continuous optical trace of a hippocampal neuron over 80 seconds in an awake, head-fixed mouse, with zoomed-in view (j-m) at the beginning and end of the recording highlighting comparable firing rates and SNRs (n = 16 neurons in 7 FOVs from 4 mice).
Extended Data Fig. 9.
Extended Data Fig. 9.. LFP and subthreshold membrane voltage oscillation analysis in the hippocampus.
(a) Example hippocampal LFP recordings from a session with 10 trials, aligned to the onset of an air puff (green shading) directed to one eye in awake headfixed mice. (b) LFP power spectrum shows strong theta oscillations. Plotted are mean±standard deviation, n=10 trials in 1 session. (c) Oscillation power at high frequencies (100–250 Hz, red) and at theta frequencies (blue), aligned to puff onset. Each thin line represents an individual recording session, and the thick lines denote means (n = 7 sessions in 4 mice). (d) Eye puff evoked a significant increase in LFP power at high frequency, but not at theta frequency (theta frequency: p = 0.5966, high frequency: p = 0.0004, two-tailed paired Student’s t-test, n=7 sessions in 4 mice). Box plots are as in Fig. 4. (e) Fluorescence image of a representative FOV (top) with selected ROIs (bottom). (f) Membrane voltage recorded optically (Vmo) from neurons identified in e, and simultaneously recorded LFPs. Black vertical ticks above Vmos denote spikes. Spike-spike coherence values between neurons are shown at the left and Vmo-Vmo theta coherence values are shown at the right. (g) Theta frequency-filtered LFPs and Vmos for the four traces shown in f. Vmo-LFP coherence values are shown to the right. (h) Scatter plot of Vmo-Vmo theta frequency coherence and spike-spike coherence from all neuron pairs, fitted with a linear regression (n=25 pairs, p=0.08, t-statistic, r2=0.12).
Extended Data Fig. 10.
Extended Data Fig. 10.. Pair-wise coherence and correlation measures over spatial distance.
To investigate the potential of background fluorescence signals under wide-field imaging to produce shared crosstalk signals on neuron pairs, we examined the relationship of various coherence and correlation measures between neurons and background fluorescence over spatial distance. (a-b) Pair-wise coherence at theta frequencies between neurons. Vmo-Vmo coherence did not decrease significantly with spatial distance. (a, n=25 pairs analyzed with spatial distance of 11–66 μm, center to center; b, n=23 pairs within 50 μm of each other, F=1.44, p=0.26, one-way ANOVA). (c, d) Pair-wise Vmo-Vmo coherence at gamma frequencies (30–50 Hz) was not dependent on spatial distance (c, n=25 pairs); d, n=23 pairs within 50 μm of each other, F=2.10, p=0.13, one-way ANOVA). (e, f) Pair-wise correlation between neurons did not decrease significantly with spatial distance (e, n=25 pairs; f, n=23 pairs within 50 μm, F=1.00, p=0.42, one-way ANOVA). (g-l) Same analysis as in a-f performed in background donut ROIs surrounding each neuron (for donut definition see Methods). Similar to results from neuron pairs, we found that theta frequency coherence between background donut ROIs was not dependent on spatial distance (g, n=23 pairs; h, n=21 pairs, F=0.65, p=0.59, one-way ANOVA), nor was gamma frequency coherence (I, n=23 pairs; j, n=21 pairs, F=1.93, p=0.16, one-way ANOVA), nor was the correlation coefficient (k, n=23 pairs; l, n=21 pairs, F=1.02, p=0.41, one-way ANOVA). (m-o) The coherence between neurons and their corresponding donuts were not correlated, at theta frequency (m) or at gamma frequency (n), or for the Pearson correlation coefficients (o). All box plots displayed are as in Fig. 4.
Figure 1.
Figure 1.. SomArchon enables high fidelity voltage imaging in brain slices.
(a) Diagram of the SomArchon construct. (b) Confocal images of SomArchon expressing neurons in cortex layer 2/3 (left), hippocampus (middle), and striatum (right). ƛex=488nm laser, ƛem=525/50 nm (representative images selected from 8, 10, and 6 slices from 2 mice each, respectively). Scale bars, 50 μm. (c) Single-trial SomArchon fluorescence (red), and concurrently recorded membrane voltage via whole-cell patch-clamp (black), during current injection (gray) evoked action potentials (APs); ƛex=637nm laser at 0.8, 1.5, and 1.5 W/mm2 for cortex, hippocampus, and striatum, respectively. (d) ΔF/F per AP across recordings exemplified in c (representative traces selected from n = 18, 8, and 6 neurons from 5, 2, and 2 mice, respectively). Box plots (25th and 75th percentiles with notch being the median; whiskers extend 1.5x the interquartile range from the 25th and 75th percentiles; middle horizontal line, mean; individual data points shown as open circles when n < 9). (e) Electrical and optical AP waveform full-width-at-half-maximum (FWHM; dashed lines connect same neurons) across recordings exemplified in c (p-values are from two-sided Wilcoxon rank sum test, see Supplementary Table 2). (f) SNR per AP across recordings exemplified in c. (g) Population fluorescence of SomArchon in response to voltage steps in voltage-clamp mode, normalized to the fluorescence at −70 mV (optical recordings for a representative neuron shown in inset) recorded in cortex (n=12 neurons from 2 mice). (h) Diagram of SomArchon-P2A-CoChR-KV2.1motif. (i) Fluorescence image of neurons in hippocampal slice, expressing SomArchon-P2A-CoChR-KV2.1motif (top) with two cells identified (bottom); ƛex=637 nm, exposure time 1.3 ms (selected from n=3 slices from 2 mice). Scale bar = 25 μm. (j) Representative single-trial optical voltage traces from cells shown in i with blue light stimulation (2 ms pulse at 20 Hz). Acquisition rate: 777 Hz.
Figure 2.
Figure 2.. SomArchon enables single cell voltage imaging in multiple brain regions of awake mice, using a simple wide-field imaging setup.
(a) Experimental setup: awake mice were head-fixed under a wide-field microscope (left); diagram of surgical window implant coupled with an infusion cannula and an LFP recording electrode (right). (b) Representative SomArchon-expressing neurons visualized via EGFP fluorescence in motor cortex, visual cortex, striatum, and hippocampus (ƛex=470/25 nm LED, ƛem=525/50 nm;). Scale bars, 50 μm. (c, e, g, i) Voltage imaging in (c) motor cortex, (e) visual cortex, (g) striatum, and (i) hippocampus. SomArchon fluorescence image of the cell in vivo (left) and optical voltage trace acquired from the cell (right; dashed boxes indicate time intervals shown at successively expanded time scales; vertical bars indicate peaks of action potentials identified by a custom spike-sorting algorithm); ƛex=637 nm laser, at 1.6 W/mm2 for visual cortex and motor cortex, 4 W/mm2 for striatum and hippocampus, ƛem=664LP). Scale bars, 25 μm. (d, f, h, j) Quantification of SNR per action potential for (d) motor cortex, (f) visual cortex, (h) striatum, and (j) hippocampus. Box plots are displayed as described in Fig. 1. In b-j, representative images and traces were selected from, and statistics performed on, n = 8, 6, 10, and 17 cells from 3, 2, 3, and 4 mice respectively. (k) Fluorescence image of selected FOV showing hippocampal neurons expressing SomArchon-P2A-CoChR-KV2.1motif (top) with neurons identified (bottom); ƛex=637 nm, exposure time 1.2 ms. Scale bar, 20 μm. (i) Representative single-trial optical voltage traces from cells shown in k with blue light stimulation (100 ms pulse). Image acquisition rate: 826 Hz. (m) Firing rate changes during blue light off versus blue light on conditions in individual neurons. In k-m, representative image selected from, and statistics performed on, n = 14 cells from 2 mice.
Figure 3.
Figure 3.. Voltage imaging of striatal neurons during locomotion.
(a) Schematic representation of the experimental setup, similar to that in Figure 2a, but with mice positioned on a spherical treadmill. Imaging was performed with a 40x objective lens. (b) SomArchon fluorescence image of striatal cells (left), with identified ROIs corresponding to somas (right), ƛex=637 nm, exposure time 1.2 ms (representative image selected from n = 9 FOV from 2 mice). Scale bar, 20 μm. NSD: no spikes detected. (c) Optical voltage traces acquired from cells shown in b, and corresponding mouse movement speed (black: low pass filtered at 1.5 Hz; gray: raw data; representative traces selected from n = 2 FOV from one mouse). Image acquisition rate, 826 Hz. (d) Zoomed-in views of the three periods indicated by black boxes shown in c. (e) Optical voltage trace (red) for a neuron modulated by movement speed and corresponding movement speed (black) (representative trace selected from n = 14 neurons from 2 mice). (f) Firing rates of individual striatal neurons, during periods with low (open box) versus high (gray) movement speed (n=14 neurons from 2 mice, brackets indicate neurons from the same FOV). *, p<0.05, two-sided Wilcoxon rank sum test. Box plots are displayed as described in Fig. 1.
Figure 4.
Figure 4.. Population voltage imaging of spikes and subthreshold voltage activities in CA1 neurons.
(a) A neuron with spikes phase-locked to theta oscillations of local field potentials (LFPs, blue) and optically-recorded membrane voltage (Vmo, red). (Left) Raw LFPs (top) and Vmo (bottom), and theta frequency filtered traces (middle). (Center) Zoomed-in view of the boxed period on the left. Theta oscillation peaks are indicated by blue and red vertical lines, and spikes by green dots. (Right) Probability distribution of spikes to theta oscillation phases of LFP (blue) and Vmo (red). Arrows indicate the average phase vector (with vector length indicated). Outer circle number indicates probability. (Example is selected from n=16 neurons in 7 FOVs from 4 mice) (b) As in (a), but for an example neuron phase locked to Vmo theta oscillations, but not to LFP theta oscillations. (c) Population spike-phase vectors to theta oscillations of LFP (blue and light blue) and Vmo (red and pink). Each vector represents the average vector from one neuron (blue and red: p<0.05; light blue and pink: not significant; χ2 test, spike-phase distribution of each neuron against uniform distribution; n = 198–1077 spikes per neuron; 16 neurons in 7 FOVs from 4 mice). (d) Population spike-phase relationship. (***, p = 5.0·10−5, two-tailed paired Student’s t-test, n=16 neurons in 7 FOVs from 4 mice). Box plots (25th and 75th percentiles with notch being the median; whiskers extend to all data points not considered outliers; + are outliers. (e) SomArchon fluorescence images of CA1 neurons (left), with ROIs overlaid (right) (n = 14 FOV from 3 mice). Example spiking cells are indicated by yellow arrows whose optical voltage traces are shown in (f); blue arrows indicate neurons not active during the period shown; ƛex=637 nm laser at 1.5 W/mm2. Scale bar, 20 μm.

References

    1. Hochbaum DR et al. All-optical electrophysiology in mammalian neurons using engineered microbial rhodopsins. Nat. Methods 11, 825–33 (2014). - PMC - PubMed
    1. St-Pierre F et al. High-fidelity optical reporting of neuronal electrical activity with an ultrafast fluorescent voltage sensor. Nat. Neurosci. 17, 884–9 (2014). - PMC - PubMed
    1. Gong Y, Wagner MJ, Li JZ & Schnitzer MJ Imaging neural spiking in brain tissue using FRET-opsin protein voltage sensors. Nat. Commun. 5, 1–11 (2014). - PMC - PubMed
    1. Adam Y et al. Voltage imaging and optogenetics reveal behaviour-dependent changes in hippocampal dynamics. Nature 569, 413–417 (2019). - PMC - PubMed
    1. Chavarha M et al. Fast two-photon volumetric imaging of an improved voltage indicator reveals electrical activity in deeply located neurons in the awake brain. bioRxiv (2018).

References for Methods

    1. Adam Y et al. All-optical electrophysiology reveals brain-state dependent changes in hippocampal subthreshold dynamics and excitability. bioRxiv (2018). doi: 10.1101/281618 - DOI
    1. Hansen KR, Dewalt GJ, Mohammed AI, Tseng H & Moona E Mild Blast Injury Produces Acute Changes in Basal Intracellular Calcium Levels and Activity Patterns in Mouse Hippocampal. 1–42 (2017). doi: 10.1089/neu.2017.5029 - DOI - PMC - PubMed
    1. Dombeck DA, Khabbaz AN, Collman F, Adelman TL & Tank DW Imaging Large-Scale Neural Activity with Cellular Resolution in Awake, Mobile Mice. Neuron 56, 43–57 (2007). - PMC - PubMed
    1. Fields IE et al. Noninvasive Deep Brain Stimulation via Temporally Article Noninvasive Deep Brain Stimulation via Temporally Interfering Electric Fields. Cell 169, 1029–1041.e16 - PMC - PubMed
    1. Kalmbach AS & Waters J Brain surface temperature under a craniotomy. J. Neurophysiol. (2012). doi: 10.1152/jn.00557.2012 - DOI - PMC - PubMed

Publication types

Substances