. 2019 Oct;574(7778):432-436.
doi: 10.1038/s41586-019-1646-9. Epub 2019 Oct 9.

Spliceosomal disruption of the non-canonical BAF complex in cancer

Affiliations

Spliceosomal disruption of the non-canonical BAF complex in cancer

Daichi Inoue et al. Nature. 2019 Oct.

Abstract

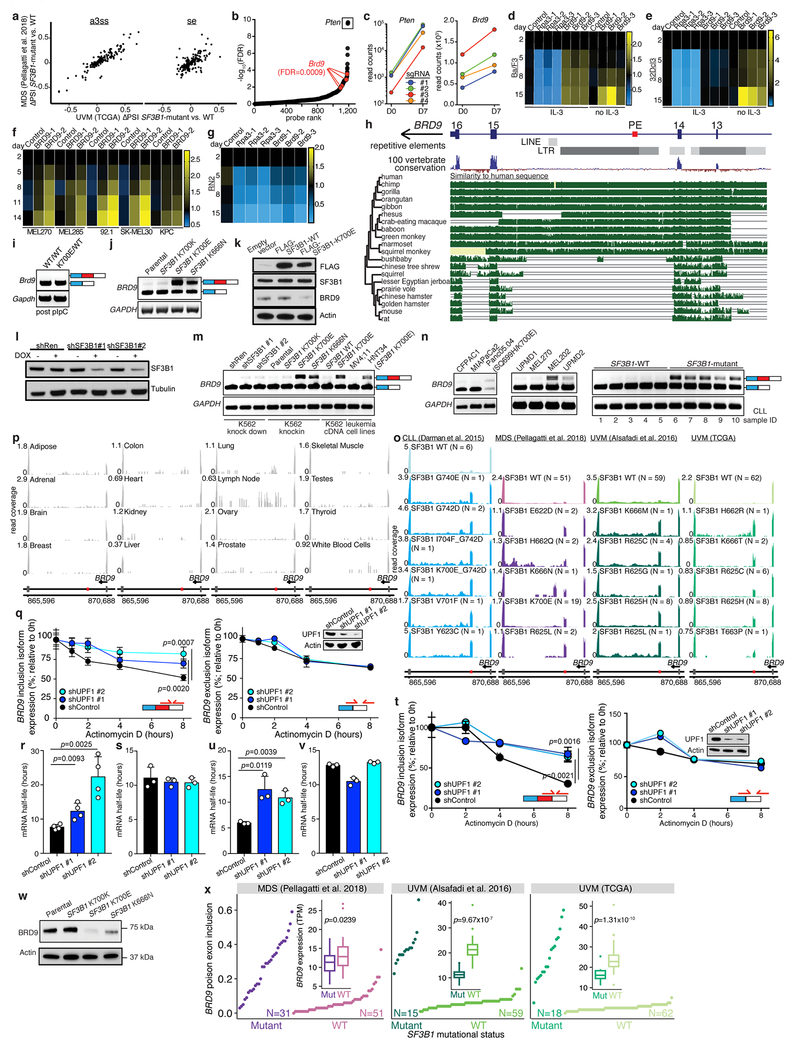
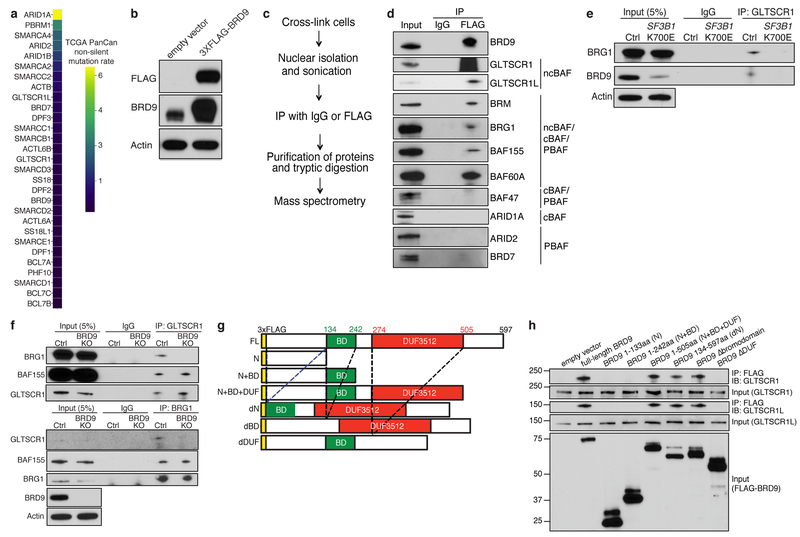
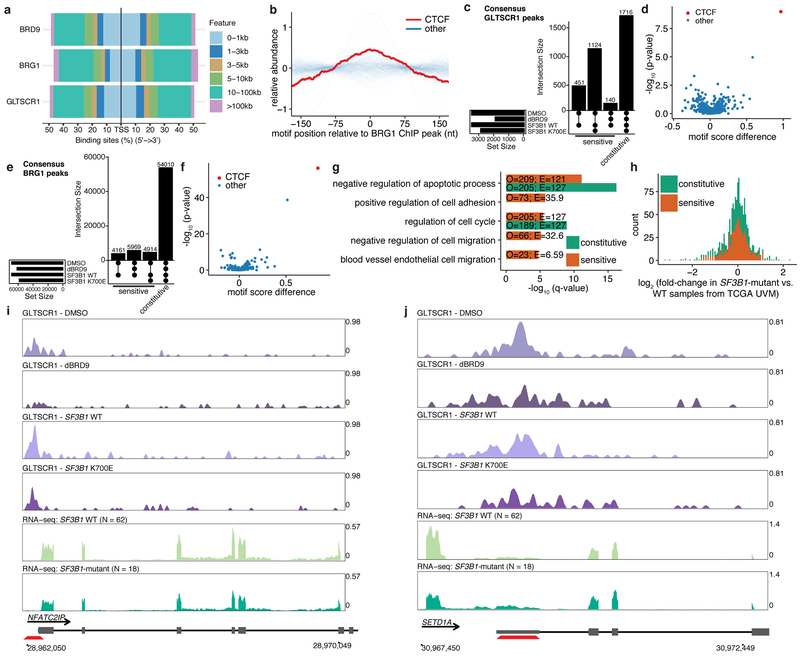
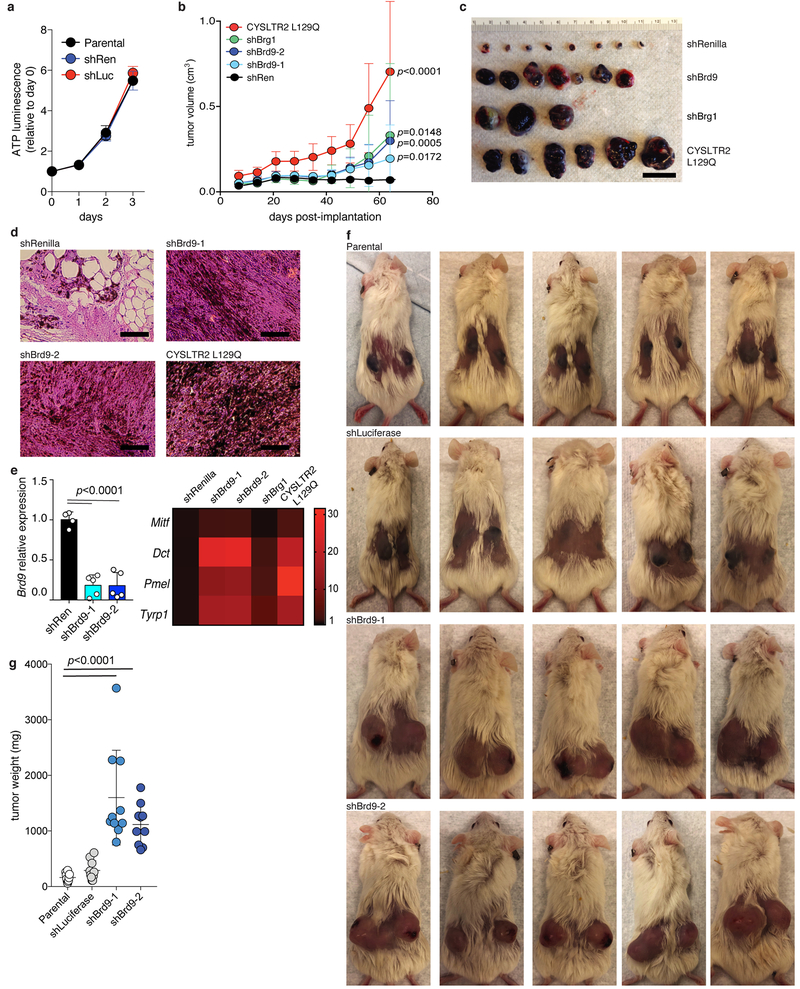
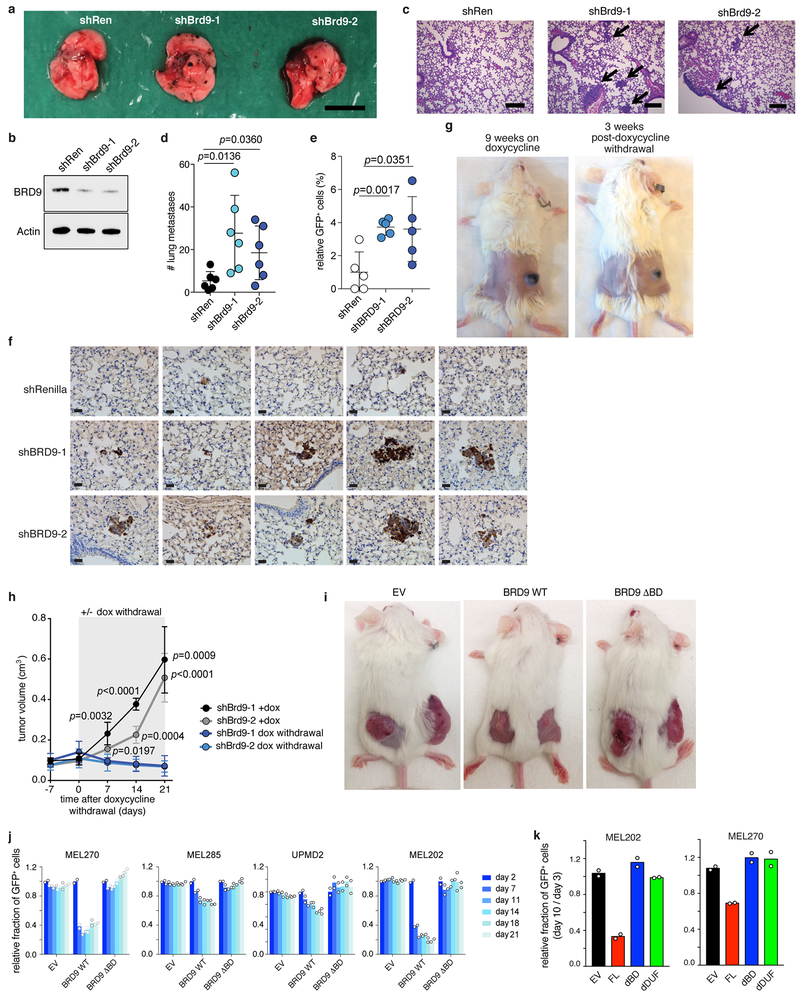
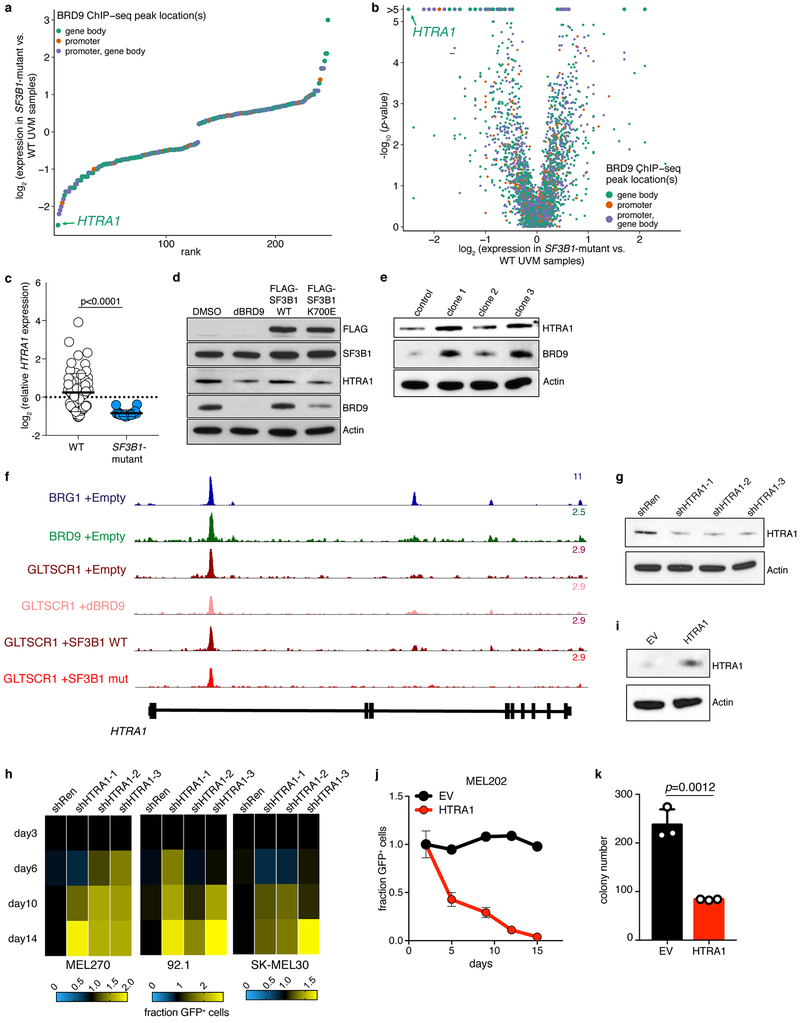
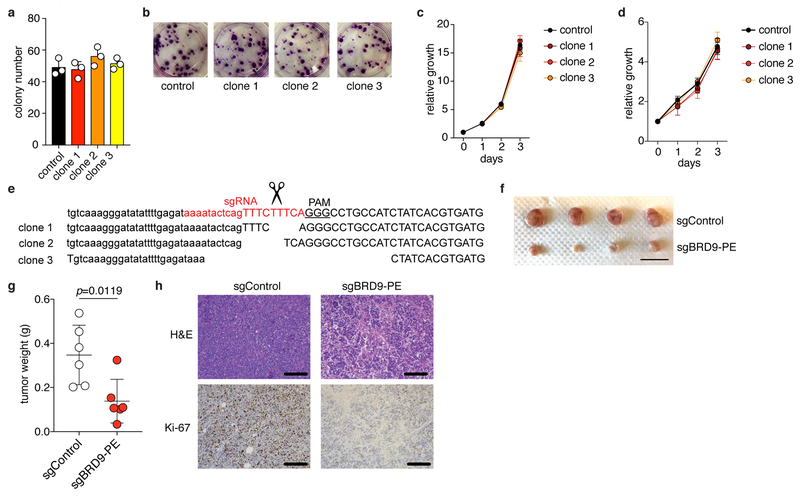
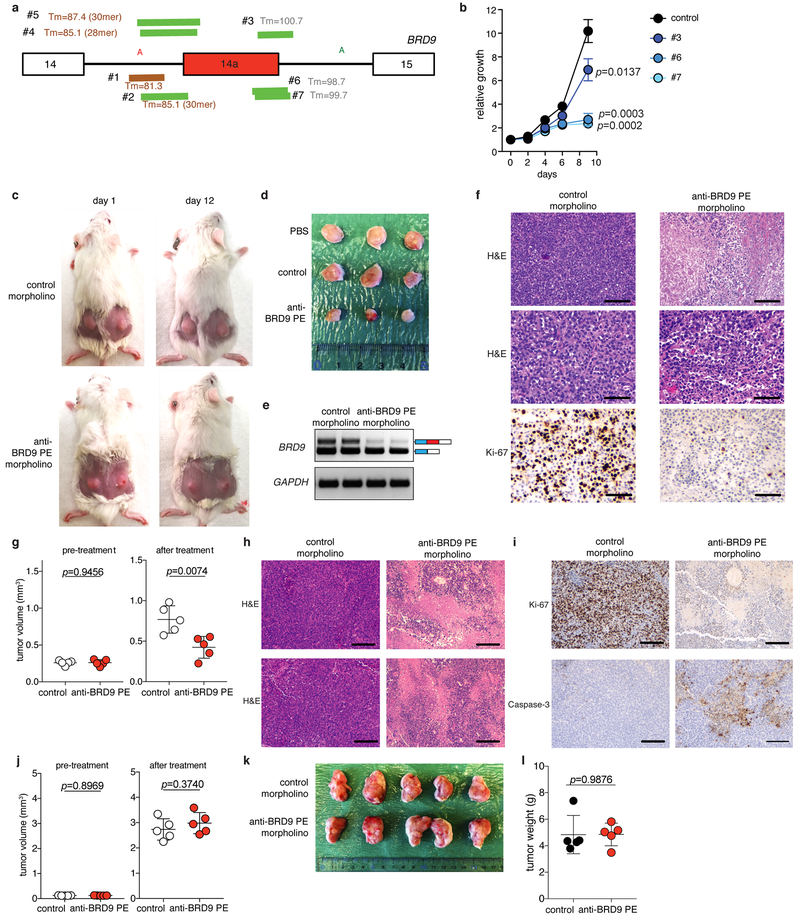
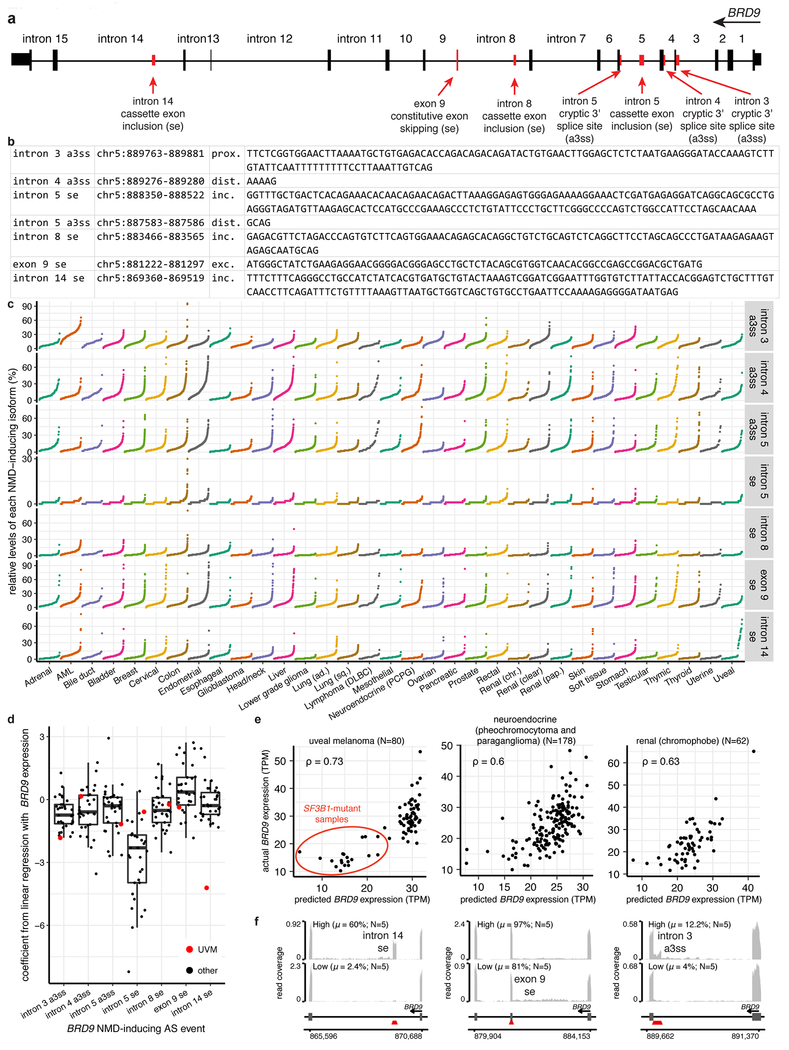
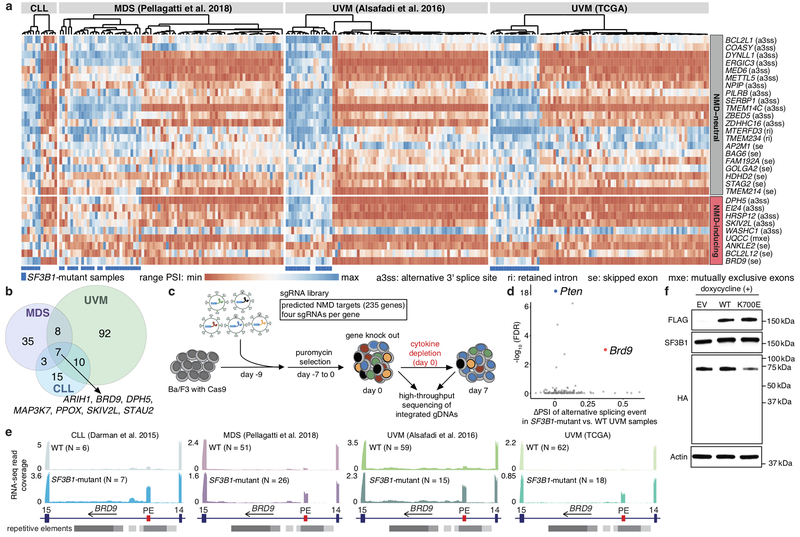
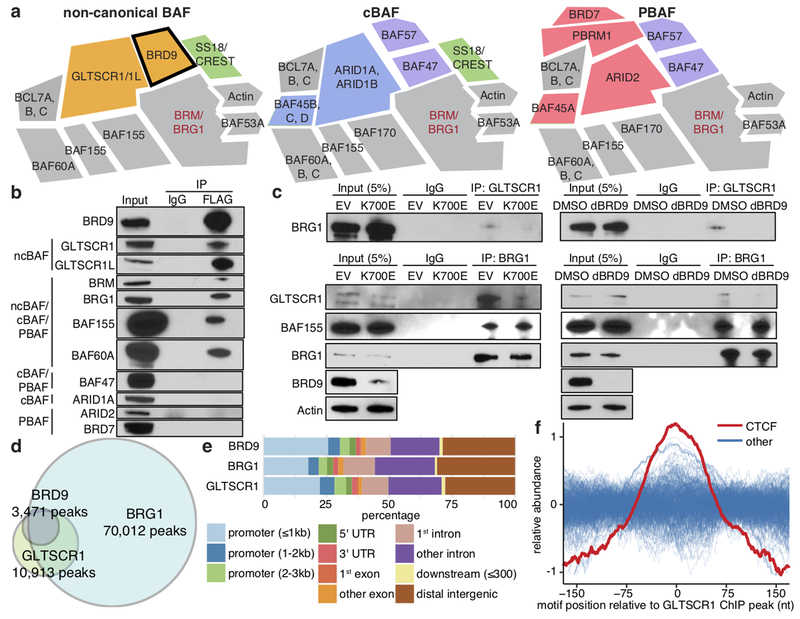
SF3B1 is the most commonly mutated RNA splicing factor in cancer1-4, but the mechanisms by which SF3B1 mutations promote malignancy are poorly understood. Here we integrated pan-cancer splicing analyses with a positive-enrichment CRISPR screen to prioritize splicing alterations that promote tumorigenesis. We report that diverse SF3B1 mutations converge on repression of BRD9, which is a core component of the recently described non-canonical BAF chromatin-remodelling complex that also contains GLTSCR1 and GLTSCR1L5-7. Mutant SF3B1 recognizes an aberrant, deep intronic branchpoint within BRD9 and thereby induces the inclusion of a poison exon that is derived from an endogenous retroviral element and subsequent degradation of BRD9 mRNA. Depletion of BRD9 causes the loss of non-canonical BAF at CTCF-associated loci and promotes melanomagenesis. BRD9 is a potent tumour suppressor in uveal melanoma, such that correcting mis-splicing of BRD9 in SF3B1-mutant cells using antisense oligonucleotides or CRISPR-directed mutagenesis suppresses tumour growth. Our results implicate the disruption of non-canonical BAF in the diverse cancer types that carry SF3B1 mutations and suggest a mechanism-based therapeutic approach for treating these malignancies.


Conflict of interest statement

The authors declare competing financial interests: details are available in the online version of the paper. Readers are welcome to comment on the online version of the paper.

Figures

Extended Data Figure 1.
Extended Data Figure 1.. BRD9 is mis-spliced in SF3B1-mutant human cells and BRD9 loss confers a proliferative advantage.
(a) Scatter plots comparing differential splicing (ΔPSI) between SF3B1-mutant and WT patients in the TCGA uveal melanoma (UVM) cohort (x axis) and an MDS cohort (y axis). Events were classified as alternative 3’ splice sites (a3ss) or skipped exons (se). (b) Rank plot for the −log10(FDR; false-discovery rate) associated with each sgRNA in our CRISPR/Cas9 positive selection screen. sgRNAs targeting the positive control (Pten) and Brd9 are highlighted. For the probe-level (per-sgRNA) analysis, we fitted a negative binomial generalized log-linear model and performed a likelihood ratio test. FDRs were computed with the Benjamini-Hochberg method. (c) Read counts for sgRNAs targeting the positive control (Pten) or Brd9. D0 and D7 indicate days following withdrawal of IL-3. (d) Heat map summarizing the results of a competition assay to measure the effect of each indicated sgRNA on the growth of Cas9-expressing Ba/F3 cells. Cell growth was computed with respect to cells treated with a non-targeting (Control) sgRNA and the percentages of GFP+ cells at day 14 were normalized to that at day 2. The illustrated values correspond to the mean computed over n=3 biological replicates. Rpa3 sgRNAs were used as a negative control. (e) As (d), but for 32Dcl3 cells. (f) As (d), but for the indicated melanoma and pancreatic ductal adenocarcinoma cells. (g) As (d), but for RN2 cells. (h) Sequence conservation of the BRD9 poison exon locus as estimated by phyloP. Conservation and repetitive element annotation from the UCSC Genome Browser. PE, poison exon. (i) RT-PCR analysis of Brd9 poison exon inclusion using whole bone marrow cells from Mx1-Cre Sf3b1WT/WT (“WT/WT”) and Mx1-Cre Sf3b1K700E/WT (“K700E/WT”) mice. Three weeks after pIpC treatment, RT-PCR was performed with murine primers corresponding those used to assay BRD9 poison exon inclusion in human cells. Representative images from n=2 technically independent replicates. (j) RT-PCR analysis to confirm mutant SF3B1-dependent inclusion of the BRD9 poison exon in isogenic NALM-6 cell lines engineered to contain the indicated mutations. SF3B1K700K is a WT control for genome engineering. Representative images from n=2 technically independent replicates. (k) Western blot for FLAG, SF3B1, and BRD9 in K562 cells overexpressing N-terminal FLAG-tagged SF3B1 WT or K700E cDNAs or an empty vector (corresponding to cells evaluated in (m)). Representative images from n=2 biologically independent replicates. (l) Western blot for SF3B1 in K562 cells treated with doxycycline-inducible SF3B1-targeting shRNAs or a non-targeting control shRNA (“shRen”) (corresponding to cells evaluated in (m)). Representative images from n=2 technically independent replicates. (m) RT-PCR illustrating the specificity of BRD9 poison exon inclusion for SF3B1-mutant cells in the indicated cell lines. These include K562 cells treated with control shRNA (“shRen”) or SF3B1-targeting shRNAs (columns labeled “K562 knock-down”); knockin of the SF3B1K700K, K700E, or K666N mutation into the endogenous locus of SF3B1 (columns labeled “K562 knockin”); or overexpression of SF3B1 wild-type or SF3B1K700E cDNA (columns labeled “K562 cDNA”). The two right hand-most lanes show acute myeloid leukemia cell lines with wild-type SF3B1 (MV4:11) or a naturally occurring endogenous SF3B1K700E mutation (HNT34 cells; columns labeled “leukemia cell lines”). Representative images from n=3 biologically independent experiments. (n) As (m), but for the indicated pancreatic ductal adenocarcinoma cell lines (left), UVM cell lines (center), and a cohort of CLL patients (right). CFPAC1 and MIA PaCa2 cells lack SF3B1 mutations; Panc05;04 cells carry SF3B1Q699H/K700E; UPMD1 and MEL270 cells lack SF3B1 mutations; MEL202 and UPMD2 cells carry SF3B1R625G and SF3B1Y623H, respectively. CLL patient sample ID corresponds to genotypes shown in Supplementary Table 7. Representative images from n=2 technically independent experiments (left and center) and n=3 biologically independent experiments (right). (o) RNA-seq read coverage plots of the BRD9 poison exon locus from patient samples with the indicated SF3B1 genotypes. All SF3B1-mutant samples exhibit BRD9 poison exon inclusion. (p) As (o), but for the indicated tissues from healthy donors (BodyMap 2.0). (q) Quantitative RT-PCR measurement of the half-lives of the poison exon inclusion (left) and exclusion (right) isoforms in isogenic K562 SF3B1K700E cells treated with the indicated shRNAs and actinomycin D to inhibit transcription. NMD inhibition via UPF1 knockdown stabilizes the inclusion, but not exclusion, isoform. Red arrows indicate primers used to specifically detect the two isoforms. n=2 biologically independent experiments and n=2 technically independent experiments for the inclusion isoform; n=3 technically independent experiments for the exclusion isoform. p-value was calculated by two-sided t-test at 8h. (r) Bar graph illustrating the estimated poison exon inclusion isoform half-life in the indicated conditions from the data in (q). Error bars, mean and SD. n=2 biologically independent experiments and n=2 technically independent experiments. p-value was calculated by two-sided t-test. (s) As (r), but for the exclusion isoform. Error bars, mean and SD. n=3 technically independent experiments. p-value was calculated by two-sided t-test. (t) As (q), but for NALM-6 SF3B1K700E cells. n=3 technically independent experiments for the inclusion isoform and the exclusion isoform. p-value was calculated by two-sided t-test at 8h. (u) As (r), but for NALM-6 SF3B1K700E cells. n=3 technically independent experiments. Error bars, mean and SD. p-value was calculated by two-sided t-test. (v) As (s), but for NALM-6 SF3B1K700E cells. Error bars, mean and SD. n=3 technically independent experiments. p-value was calculated by two-sided t-test. (w) Western blot for BRD9 in NALM-6 cells with or without knockin of an SF3B1 mutation. Actin, loading control. Representative images from n=3 biologically independent experiments. (x) Rank plot of BRD9 poison exon inclusion (scale of 0 to 1; top) and box plot of gene expression (inset) for patients stratified by SF3B1 mutational status (data are from myelodysplastic syndrome (MDS) and uveal melanoma (UVM) patient cohorts as in Fig. 1a). SF3B1 mutations were strongly associated with high poison exon inclusion and low BRD9 expression. Boxes illustrate 1st and 3rd quartiles, with whiskers extending to 1.5X interquartile range. p-value computed with one-sided Mann-Whitney U test.
Extended Data Figure 2.
Extended Data Figure 2.. Mutant SF3B1 recognizes an aberrant branchpoint within BRD9 to promote poison exon inclusion, causing loss of full-length BRD9 protein.
(a) Schematic illustrating the strategy for knockin of an HA tag into the endogenous BRD9 locus. The single-stranded donor DNA contained a 197 nt fragment, including 83 nt homologous to the BRD9 5’ UTR (upstream of the HA tag) and 87 nt homologous to BRD9 exon 1 (downstream of the start codon). (b) Sanger sequencing of genomic DNA validating successful HA tag knockin in K562 SF3B1K700E cells. Representative images from n=2 biologically independent experiments. (c) Western blot with anti-BRD9 (left), anti-HA (right, top), or anti-Actin (right, bottom) used to probe K562 SF3B1K700E cells carrying an endogenously N-terminal HA-tagged BRD9. White arrows, non-specific bands. Red arrow, expected size of BRD9 protein. Representative images from n=3 biologically independent experiments. (d) Western blot for FLAG, SF3B1, and endogenous BRD9 protein in MEL270 cells with doxycycline-inducible FLAG-SF3B1-WT/K700E. Representative images from n=3 biologically independent experiments. (e) Sanger sequencing of cDNA arising from reverse transcription of lariats arising from inclusion (top; exon 14 - exon 14a splicing) or exclusion (bottom; exon 14 - exon 15 splicing) of the BRD9 poison exon in MEL270 cells with doxycycline-inducible FLAG-SF3B1-WT (bottom)/K700E (top). The branchpoints are illustrated in Fig. 2a. Representative images from n=3 biologically independent experiments. (f) As (e), but for T47D cells. Representative images from n=3 biologically independent experiments. (g) As Fig. 2b, but for the indicated minigene mutagenesis in T47D cells with doxycycline-inducible FLAG-SF3B1K700E. Representative images from n=3 biologically independent experiments. (h) Western blot of U2AF2, U2AF1, and histone H3 in K562 cells transfected with siRNA against U2AF1 and/or U2AF2 (top) and bar plot illustrating mean BRD9 poison exon inclusion as measured by qPCR following siRNA knockdown of U2AF1 and/or U2AF2 (bottom). Experiment performed with n=1 biologically independent replicate for siRNA transfection, n=1 technically independent replicate for Western blot, and n=3 technically independent replicates for RT-PCR. Poison exon inclusion was computed over all n=3x3=9 combinations of technical replicates for RT-PCR for the inclusion and exclusion isoforms. Bars illustrate mean inclusion. (i) EPB49 cassette exon inclusion as measured by qPCR following siRNA knockdown of U2AF1 and/or U2AF2. As the EPB49 cassette exon is U2AF-dependent, this experiment serves as a positive control for functional efficacy of U2AF1 and U2AF2 KD. n=3 technically independent experiments. Cassette exon inclusion was computed over all n=3x3=9 combinations of technical replicates for RT-PCR for the inclusion and exclusion isoforms. Bars illustrate mean inclusion. (j) As Fig. 2b, but for the indicated minigene mutagenesis in T47D cells with doxycycline-inducible FLAG-SF3B1K700E. Representative images from n=3 biologically independent experiments. (k) As Fig. 2c, but for the indicated minigene mutagenesis in T47D cells with doxycycline-inducible FLAG-SF3B1K700E. Representative images from n=3 biologically independent experiments. (l) Western blot for FLAG, SF3B1, BRD9, and actin in MEL270 cells expressing an empty vector or N-terminal FLAG-tagged SF3B1 wild-type (WT), SF3B1 R625H, or SF3B1 K700E cDNA. Representative images from n=3 biologically independent experiments. (m) RT-PCR analysis of BRD9 splicing in MEL270 cells expressing doxycycline-inducible empty vector (EV), SF3B1 WT, SF3B1 R625H, or SF3B1 K700E. The left column illustrates minigene splicing while the right column illustrates endogenous BRD9 splicing. Representative images from n=3 biologically independent experiments. (n) As (m), but for the illustrated minigene mutations at the 5’ end of the poison exon. Representative images from n=3 biologically independent experiments. (o) Mutations generated at the 5’ end of the BRD9 poison exon by CRISPR/Cas9-mediated insertions and deletions in MEL202 cells (SF3B1R625G). The PAM sequence is illustrated with upper-case underlined nucleotides. Red nucleotides hybridize to the sgRNA. Substitutions are illustrated with lower-case underlined nucleotides. (p) As (o), but for MEL270 cells. Representative images from n=3 biologically independent experiments. (q) As Fig. 2d (top), but for MEL270 cells. Representative images from n=3 biologically independent experiments. (r) As Fig. 2d (bottom), but for MEL270 cells. Representative images from n=3 biologically independent experiments.
Extended Data Figure 3.
Extended Data Figure 3.. BRD9 loss impairs non-canonical BAF complex formation.
(a) Mutation rate observed across TCGA cohorts for cBAF, PBAF, and ncBAF components. (b) Western blot confirming FLAG-tagged BRD9 protein expression in 3XFLAG-BRD9-expressing K562 cells. Representative images from n=3 biologically independent experiments. (c) Experimental workflow for using RIME (Rapid Immunoprecipitation Mass spectrometry of Endogenous proteins) for purification and identification of chromatin-associated interactions partners of BRD9. (d) Cross-linking and immunoprecipitation with IgG or FLAG followed by probing with the indicated antibodies. Data from 3xFLAG-BRD9-expressing MEL270 cells. Representative images from n=3 biologically independent experiments. (e) Immunoprecipitation of GLTSCR1 followed by Western blotting with the indicated antibodies in SF3B1K700E knockin NALM-6 cells. Representative images from n=3 biologically independent experiments. (f) Immunoprecipitation of GLTSCR1 (top) or BRG1 (bottom) followed by blotting with the indicated antibodies in K562 cells with CRISPR-mediated knockout of BRD9. Representative images from n=3 biologically independent experiments. (g) Schematic of the BRD9 full-length (FL) protein and deletion mutants constructed. BD, bromodomain; DUF, domain of unknown function. “EV”: empty vector; “FL”: full-length BRD9; “N”: 1-133 amino acids (aa) of BRD9; “N+BD”: 1-242aa of BRD9; “N+BD+DUF”: 1-505aa BRD9; “dN”: 134-597aa of BRD9; “dBD”: Bromodomain deletion mutant of BRD9; “dDUF”: DUF domain deletion mutant of BRD9. (h) Immunoprecipitation (IP) with FLAG following by probing (IB) for GLTSCR1 or GLTSCR1L in 293T cells expressing 3xFLAG-tagged versions of the indicated deletion mutants. Deletion mutants illustrated in (g). Representative images from n=3 biologically independent experiments.
Extended Data Figure 4.
Extended Data Figure 4.. BRD9 loss drives relocalization of GLTSCR1 away from CTCF-associated loci.
(a) As Fig. 3e, but illustrating relative positions with respect to transcription start sites (TSSs). (b) As Fig. 3f, but for motifs at BRG1-bound loci. n=401 transcription factors analyzed. (c) UpSet plots depicting the overlap of consensus GLTSCR1-bound loci in MEL270 cells with the indicated treatments. (d) Volcano plot illustrating the difference in the mean motif scores at BRD9-sensitive versus constitutive GLTSCR1-bound loci for the transcription factors in Fig. 3f as well as associated statistical significance. n=401 transcription factors analyzed. p-values computed with a two-sided Mann-Whitney U test. (e) As (c), but for BRG1-bound loci. (f) As (d), but for BRG1-bound loci. n=401 transcription factors analyzed. (g) Selected enriched annotation terms from a GREAT analysis of genes near BRD9-sensitive and constitutive GLTSCR1-bound loci. Plot illustrates −log10 (FDR), computed with a one-sided binomial test and corrected for multiple testing using the Benjamini-Hochberg procedure. O and E, numbers of genes that were observed and expected. (h) Differences in gene expression in SF3B1-mutant versus WT samples in the TCGA UVM cohort for genes with GLTSCR1-bound promoters identified in MEL270 cells. Colors indicate the responsiveness of peaks to BRD9 loss. (i) Read coverage from GLTSCR1 ChIP-seq (MEL270 cells) and RNA-seq (TCGA UVM cohort) around NFATC2IP. Red trapezoid indicates GLTSCR1 binding in the promoter, with reduced binding upon treatment with dBRD9 or expression of SF3B1K700E. NFATC2IP was significantly differentially expressed in UVM samples with SF3B1 mutations relative to WT samples. Vertical axis scales were rendered comparable by normalizing ChIP-seq read coverage to mapped library size and RNA-seq read coverage to mapped library size, restricted to coding genes. ChIP-seq experiment performed for n=1 biologically independent replicate. (j) As (i), but for SETD1A. SETD1A was significantly differentially expressed in UVM samples with SF3B1 mutations relative to WT samples.
Extended Data Figure 5.
Extended Data Figure 5.. BRD9 is a potent tumor suppressor in UVM.
(a) In vitro growth curves of Melan-a cells treated with two distinct non-targeting shRNAs (shRenilla (“shRen”), shLuciferase (“shLuc”)) versus parental, unmanipulated Melan-a cells. n=3 per group. Data are presented as mean ± SD. (b) Tumor volume in SCID mice subcutaneously injected with Melan-a cells expressing a control shRNA (shRen), shRNA against Brd9 (shBrd9-1 and shBrd9-2), shRNA against Brg1 (shBrg1), or cDNA encoding CYSLTR2 L129Q (n = 8 mice per group). Data are presented as mean ± SD. p-value at day 64 was calculated compared to shRen group with a two-sided t-test. (c) Representative images of the dissected melanomas from (b). (d) Hematoxylin and eosin (H&E) images of melanomas from (b). Scale bar indicates 100 μm. Representative images from n=3 biologically independent experiments. (e) Quantitative RT-PCR measuring expression of Brd9 (left) and melanoma-associated genes (Mitf, Dct, Pmel, and Tyrp1) of melanomas from (a). n=4 (shRen) and n=5 (shBrd9-1 and shBrd9-2) biologically independent experiments. Data are presented as mean ± SD. p-value was calculated by two-sided t-test. (f) Images of mice transplanted with parental, unmanipulated Melan-a cells or Melan-a cells transduced with a non-targeting shRNA or Brd9-targeting shRNA. Cells were subcutaneously engrafted into SCID mice and tumor volume was estimated 36 days after transplant. (g) Volumes of tumors from (f) at day 36. Data are presented as mean ± SD. n=10 per group. p-value was calculated relative to the parental group by a two-sided t-test.
Extended Data Figure 6.
Extended Data Figure 6.. BRD9 is a potent tumor suppressor in UVM.
(a) Representative images of pulmonary metastatic foci produced 14 days after intravenous injection of B16 cells with or without shBrd9 (MLS-E vector). Scale bar indicates 5 mm. (b) Western blot of endogenous BRD9 in B16 cells immediately prior to injection. Actin, loading control. The experiment was repeated three times with similar results. (c) H&E sections of lung metastases. Arrows indicate metastatic foci. Scale bar indicates 100 μm. The experiment was repeated three times with similar results. (d) Numbers of pulmonary B16 metastases identified in the experiments from (a). n=6 per group. p-value was calculated relative to the shRen group by a two-sided t-test. (e) Relative percentages of GFP+ 92.1 cells with or without shBRD9 (MLS-E vector), assessed by flow cytometric analysis of lung tissue in recipient NSG (NOD-scid IL2R-γ null) mice 14 days following intravenous injection by tail vein. The signal was normalized by dividing by the average percentage of GFP+ cells in the shRen (control) group. n=5 biologically independent experiments per group. p-value was calculated relative to the shRen group by a two-sided t-test. (f) Anti-GFP immunohistochemistry for sections of lung metastases from the experiment in (e). Scale bar indicates 200 μm. The experiment was repeated three times with similar results. (g) Representative images of tumors derived from transplantation of Melan-a cells transduced with dox-inducible shBrd9. Doxycycline was administered for 9 weeks (left) and followed by doxycycline withdrawal for 3 weeks (right). (h) Tumor volume for the experiment in (g). n=4 mice per group. The experiment was repeated twice with similar results. p-value was calculated relative to the parental group by a two-sided t-test at day 7, 14, and 21. (i) Representative images of recipient mice engrafted with MEL270 cells transduced with empty vector (EV), full-length BRD9 (WT), or a bromodomain deletion mutant of BRD9 (BRD9 ΔBD) at day 12. n=5 per group. (j) Results of a competition assay to measure the effects of expression of the indicated cDNAs on growth of the indicated melanoma cells. Transduced cells were identified by co-expression of GFP (pMIGII vector). The percentage of GFP+ cells was tracked over 21 days and normalized to the GFP percentage on day 2. Data are presented as mean ± SD. n=2 per group. (k) Results of a competition assay to measure the effects of expression of the indicated cDNAs on growth of the indicated melanoma cells. Transduced cells were identified by the co-expression of GFP (pMIGII vector). The percentage of GFP+ cells was tracked over 10 days and normalized to the GFP percentage on day 3. n=2 per group.
Extended Data Figure 7.
Extended Data Figure 7.. BRD9 regulates HTRA1 expression to promote UVM tumorigenesis.
(a) Rank plot illustrating log fold-change of each significantly differentially expressed gene identified by comparing SF3B1-mutant to WT patient samples from the TCGA UVM cohort. Plot restricted to genes with BRD9 ChIP-seq peaks within their promoter or gene body in the absence of perturbations to BRD9 (MEL270 cells treated with DMSO or following ectopic expression of WT SF3B1). n=3,122 genes analyzed, of which n=248 met the significance (p < 0.001) and expression (median expression in both WT and mutant samples >2 transcripts per million) thresholds and so were illustrated here. p-value computed with a two-sided Mann-Whitney U test. (b) As (a), but a volcano plot additionally illustrating the p-value associated with the comparison between SF3B1-mutant and WT samples. n=3,122 genes analyzed and illustrated. p-value computed with two-sided Mann-Whitney U test. (c) HTRA1 expression in TCGA UVM samples with (n=18) or without (n=62) SF3B1 mutations. Expression is z-score normalized across all samples. Data are presented as mean ± SD. p-value computed with two-sided t-test. (d) Western blot for FLAG, SF3B1, HTRA1, BRD9, and actin in SF3B1-WT MEL270 cells treated with DMSO, dBRD9, FLAG-SF3B1 WT cDNA, or FLAG-SF3B1 K700E cDNA. Representative images from n=3 biologically independent experiments. (e) Western blot for HTRA1, BRD9, and Actin in MEL202 cells (SF3B1R625G) following CRISPR/Cas9-mediated mutagenesis of the BRD9 poison exon (as shown in Extended Data Fig. 2o). Representative images from n=3 technically independent experiments. (f) Read coverage for BRG1, BRD9, and GLTSCR1 ChIP-seq at the HTRA1 locus in MEL270 cells (d) treated with an empty vector, dBRD9, or SF3B1 WT or K700E cDNAs (n=1 ChIP-seq experiment performed for each condition). (g) Western blot for HTRA1 and Actin in MEL270 cells treated with anti-HTRA1 shRNAs or a non-targeting control shRNA (shRen). Representative images from n=3 biologically independent experiments. (h) Heat map summarizing the results of a competition assay to measure the effect of each indicated shRNA on the growth of Cas9-expressing SF3B1-WT UVM cell lines. Cell growth was computed with respect to cells treated with a non-targeting control shRNA (shRen) and the percentages of GFP+ cells at day 14 was normalized to that at day 2. The illustrated values correspond to the mean computed over n=3 biologically independent experiments. (i) Western blot for HTRA1 and actin in MEL202 cells (SF3B1R625G) following stable overexpression of an empty vector (EV) or HTRA1 (both in an MSCV-IRES-GFP vector). Representative images from n=3 biologically independent experiments. (j) Ratio of GFP+ to GFP- MEL202 cells (SF3B1R625G) from a competition experiment in which GFP+ cells from (i) were seeded at an initial 1:1 ratio with GFP- control cells. Data are presented as mean of n=2 biologically independent experiments. (k) Colony number of MEL202 cells expressing EV or HTRA1 cDNA from (i) following 10 days of growth in soft agar. Data are presented as mean of n=3 biologically independent experiments.
Extended Data Figure 8.
Extended Data Figure 8.. CRISPR/Cas9-mediated mutagenesis of the BRD9 poison exon corrects BRD9 aberrant splicing and abrogates growth of SF3B1-mutant melanoma.
(a) Colony number for MEL270 cells (SF3B1 WT) without (control) or with (clone 1, 2, 3) CRISPR/Cas9-induced indels that disrupted BRD9 poison exon recognition. Data presented as mean ± SD. n=3 per group. (b) Representative images from (a). (c) Proliferation of the clones described in (a). n=3 per group. (d) Proliferation of MEL285 cells (SF3B1 WT) without (control) or with (clone 1, 2, 3) CRISPR/Cas9-induced indels that disrupted BRD9 poison exon recognition. n=3 per group. (e) Mutations generated at the 5’ end of the BRD9 poison exon by CRISPR/Cas9-mediated insertions and deletions in clones 1-3 of MEL285 cells from (d). The PAM sequence is illustrated with upper-case underlined nucleotides. Red nucleotides hybridize to the sgRNA. (f) Representative images of dissected tumors from recipient mice transplanted with CRISPR/Cas9-modified MEL202 clones. (g) Tumor weight for the tumors illustrated in (f). Data presented as mean ± SD. n=6 biologically independent experiments per group. p-value was calculated relative to the shControl group by a two-sided t-test. (h) Hematoxylin & eosin (H&E) as well as Ki-67 immunohistochemistry images for the tumors illustrated in (f). Representative images from n=3 independent histological analyses.
Extended Data Figure 9.
Extended Data Figure 9.. Correcting BRD9 mis-splicing in SF3B1-mutant xenografts with antisense oligonucleotides suppresses tumor growth.
(a) Cartoon representation of the BRD9 loci targeted by each designed morpholino. Melting temperature (Tm) is shown. Length of target sequences are indicated in parentheses; if not indicated, then length is 25 nt. (b) Growth of MEL202 cells (SF3B1R625G) treated with 10 uM of control non-targeting (control) or BRD9 poison exon-targeting morpholinos (#3, #6, #7). n=3 biologically independent experiments per group. p-value at day 9 was calculated relative to the control group by a two-sided t-test. (c) Representative images of recipient mice xenografted with MEL202 cells and treated with PBS or morpholinos in vivo. Each tumor was analyzed after in vivo treatment with PBS, control morpholino, or anti-BRD9 PE morpholino (#6; 12.5 mg/kg, every other day, 8 intratumoral injections). n=10 per group. (d) Representative images of dissected tumors from the experiment described in (c). (e) RT-PCR results of tumors from (c) to evaluate BRD9 splicing. The experiment was repeated three times with similar results. (f) Representative hematoxylin and eosin (H&E) and Ki-67 staining images of tumors from (c). Scale bar indicates 100 μm (top) and 50 μm (middle and bottom). The experiment was repeated three times with similar results. (g) Estimated tumor volume for recipient mice transplanted with a PDX model of SF3B1R625C rectal melanoma and treated with in vivo morpholinos (control or anti-BRD9 PE morpholino #6; 12.5 mg/kg, every other day, 8 intratumoral injections). n=5 per group. Estimated tumor volumes before and after treatment are shown. Data are presented as mean ± SD. p-value was calculated relative to the control group by a two-sided t-test. (h) Representative H&E staining images of tumors from (g). The experiment was repeated three times with similar results. (i) Representative Ki-67 staining images of tumors from (g). The experiment was repeated three times with similar results. (j) Estimated tumor volume for recipient mice transplanted with a PDX model of SF3B1-WT UVM and treated with in vivo morpholinos (control or anti-BRD9 PE morpholino #6; 12.5 mg/kg, every other day, 8 intratumor injections). n=5 per group. Estimated tumor volumes before and after treatment are shown. Data are presented as mean ± SD. p-value was calculated relative to the control group by a two-sided t-test. (k) Representative images of dissected tumors from (j). (l) Tumor weight for tumors from (k). n=5 per group. p-value was calculated relative to the control group by a two-sided t-test.
Extended Data Fig. 10.
Extended Data Fig. 10.. Use of multiple, distinct nonsense-mediated RNA decay (NMD) isoforms of BRD9.
(a) BRD9 gene structure illustrating constitutive BRD9 exons and alternative splicing events that are predicted to induce NMD. SF3B1 mutations promote inclusion of the BRD9 poison exon in intron 14. (b) Genomic coordinates (hg19/GRCh37 assembly) of each NMD-inducing event illustrated in panel (a) as well as genomic sequence of each alternatively spliced region highlighted in red in (a). Third column indicates the specific isoform that is a predicted NMD substrate (prox, intron-proximal competing 3’ splice site; dist, intron-distal competing 3’ splice site; inc, exon inclusion; exc, exon exclusion). (c) Rank plot illustrating levels of each NMD-inducing isoform relative to total BRD9 mRNA levels for each sample in each indicated TCGA cohort. Boxes illustrate 1st and 3rd quartiles, with whiskers extending to 1.5X interquartile range. (d) Box plot illustrating the distribution of coefficients estimated by fitting a linear model to predict BRD9 gene expression based on relative levels of each NMD-inducing isoform. The relative levels of NMD-inducing isoforms illustrated in (c), as well as BRD9 gene expression estimates for each sample, were used to construct an independent linear model with robust regression for each TCGA cohort. The coefficients resulting from this model fitting procedure are illustrated in the box plot, where each dot corresponds to the coefficient associated with the corresponding NMD-inducing event for a single TCGA cohort. Coefficients for the TCGA UVM cohort is highlighted in red. The coefficients are typically negative, as expected for NMD-inducing isoforms, with the exception of constitutive exon 9 skipping, for which the coefficients are generally positive, as expected for an event where NMD is induced when a constitutive exon is excluded. The SF3B1 mutation-responsive poison exon in intron 14 dominates the fit for UVM, as expected. n=33 TCGA cohorts analyzed and illustrated. (e) Scatter plots comparing actual (y axis) and predicted (x axis) BRD9 expression levels for three TCGA cohorts. Each dot corresponds to a single sample. ρ, Spearman’s correlation between actual and predicted values. (f) RNA-seq read coverage plots for patient samples from the TCGA cohorts illustrated in (e) for representative alternative splicing events illustrated in (a). Each coverage plot illustrates data averaged over the n=5 patient samples from the vertically matched cohort in (e) that exhibit the lowest or highest relative expression of NMD-inducing isoform. μ, mean relative expression of the illustrated NMD-inducing isoform, computed over each group of samples.
Figure 1.
Figure 1.. BRD9 mis-splicing causes BRD9 loss and proliferative advantage in SF3B1-mutant cancers.
(a) Unsupervised clustering of patient samples based on events differentially spliced in UVM (MEL270) and myeloid leukemia (K562) cells expressing SF3B1K700E versus WT. PSI, percent spliced in (fraction of mRNA corresponding to mutant SF3B1-promoted isoform), with per-event, per-cohort range normalization. TCGA, The Cancer Genome Atlas. (b) Genes for which mutant SF3B1 promotes an NMD isoform (a3ss and se events only) in one or more cohorts. (c) CRISPR/Cas9-based positive selection screen targeting genes for which mutant SF3B1 promotes an NMD isoform. (d) Per-gene scatter plot comparing CRISPR screen enrichment (y axis) to differential splicing in TCGA UVM cohort (x axis). Pten, positive control. n=6 biologically independent experiments. Per-gene significance computed with two-sided CAMERA test. FDR computed with Benjamini-Hochberg method. (e) BRD9 RNA-seq read coverage in patient samples. N, number of patients. PE, BRD9 poison exon; 14 and 15, flanking constitutive exons. Repetitive elements from RepeatMasker. (f) Western blot for N-terminal HA-tagged endogenous BRD9 in MEL270 cells transduced with empty vector (EV) or doxycycline-inducible FLAG-SF3B1-WT/K700E. Representative images from n=3 biologically independent experiments.
Figure 2.
Figure 2.. Mutant SF3B1 recognizes an aberrant deep intronic branchpoint within BRD9.
(a) BRD9 gene structure and protein domains. Inset illustrates branchpoints used when poison exon is included (top) or excluded (bottom). (b) RT-PCR analysis of BRD9 poison exon inclusion in a minigene (top) or endogenous (bottom) context following transfection of minigenes with the illustrated mutations into MEL270 cells with doxycycline (dox)-inducible FLAG-SF3B1-WT/K700E. Representative images from n=3 biologically independent experiments. Native, no mutations. (c) As (b), but for minigene mutations at the 5’ end of the poison exon. (d) RT-PCR (top) illustrating loss of BRD9 poison exon inclusion and corresponding Western blot (bottom) in MEL202 (SF3B1R625G) clones following CRISPR/Cas9-targeting of the poison exon. Indels illustrated in Extended Data Fig. 2o. control, unedited cells. Representative images from n=2 (RT-PCR) and n=3 (Western blot) biologically independent experiments.
Figure 3.
Figure 3.. BRD9 loss perturbs non-canonical BAF (ncBAF) complex formation and localization.
(a) Schematic of ncBAF, canonical BAF (cBAF), and polybromo-associated BAF (PBAF) complexes,. (b) Cross-linking and immunoprecipitation (IP) with IgG or FLAG followed by immunoblotting in 3xFLAG-BRD9-expressing K562 cells. Representative images from n=3 biologically independent experiments. (c) IP with GLTSCR1 or BRG1 antibody followed by immunoblotting in MEL270 cells expressing exogenous SF3B1 K700E (left) or treated with dBRD9 (BRD9 degrader; right). Representative images from n=3 biologically independent experiments. (d) Overlap of consensus BRD9, BRG1, and GLTSCR1 ChIP-seq peaks called in both MEL270 control samples (DMSO and ectopic SF3B1 WT expression). (e) Genomic localization of BRD9-, BRG1-, and GLTSCR1-bound loci in (d). (f) Distributions of transcription factor binding motifs at GLTSCR1-bound loci (20 nt rolling mean). n=401 transcription factors analyzed.
Figure 4.
Figure 4.. BRD9 is a therapeutically targetable tumor suppressor in melanoma.
(a) BRD9 expression (z-score normalized) in TCGA UVM samples with (n=18) or without (n=62) SF3B1 mutations. p-value calculated by two-sided t-test. (b) Tumor volume 49 days after subcutaneous engraftment of Melan-a cells transduced with the indicated shRNAs into SCID mice. n=16, 16, 16, 14, and 14 per group (left to right). Error bars, mean and SD. p-value calculated by two-sided t-test. (c) Representative mice from (b) at day 63. (d) Survival of SCID mice engrafted with MEL270 cells expressing empty vector (EV), full-length BRD9 (WT), or a BRD9 bromodomain deletion mutant (ΔBD) (n=5 per group). p-value calculated by log-rank test. (e) Tumor volume from (d) 21 days after engraftment. n=10 per group. Error bars, mean and SD. p-value calculated by two-sided t-test. (f) Colony number (left) and representative images (right) of MEL202 cells (SF3B1R625G) without (control) or with (clone 1/2/3) CRISPR/Cas9-induced disruption of the BRD9 poison exon. Indels illustrated in Extended Data Fig. 2o. n=3 biologically independent experiments. Error bars, mean and SD. p-value calculated by two-sided t-test at day 3 (right). (g) Tumor volume (left) and representative images (right) of mice engrafted with control or clone 1 cells from (f). n=6 per group. Error bars, mean and SD. p-value calculated by two-sided t-test at week 7. (h) ASO design (top), RT-PCR (middle), and Western blot (bottom) for BRD9. MEL202 cells (SF3B1R625G) were treated with a non-targeting (control) or targeting morpholino at 10 μM for 24 hours. Representative images from n=3 biologically independent experiments. (i) Tumor weight following 16 days of in vivo treatment of MEL202-derived xenografts (SF3B1R625G) with PBS or a non-targeting (control) or poison exon-targeting (#6) morpholino (12.5 mg/kg, every other day, total of 8 intratumoral injections). n=10 per group. Error bars, mean and SD. p-value calculated by two-sided t-test. (j) Hematoxylin and eosin (H&E) images of tumors from (i). Scale bar, 200 μm. Representative images from n=3 biologically independent histologic analyses. (k) Tumor weight (left) and representative images (right) following in vivo morpholino treatment of a patient-derived rectal melanoma xenograft (SF3B1R625C). Scale bar, 1 cm. n=5 per group. p-value calculated by two-sided t-test. Error bars, mean and SD.

References

    1. Yoshida K, et al. Frequent pathway mutations of splicing machinery in myelodysplasia. Nature 478, 64–69 (2011). - PubMed
    1. Papaemmanuil E, et al. Somatic SF3B1 mutation in myelodysplasia with ring sideroblasts. N Engl J Med 365, 1384–1395 (2011). - PMC - PubMed
    1. Wang L, et al. SF3B1 and other novel cancer genes in chronic lymphocytic leukemia. The New England journal of medicine 365, 2497–2506 (2011). - PMC - PubMed
    1. Seiler M, et al. Somatic Mutational Landscape of Splicing Factor Genes and Their Functional Consequences across 33 Cancer Types. Cell reports 23, 282–296 e284 (2018). - PMC - PubMed
    1. Alpsoy A & Dykhuizen EC Glioma tumor suppressor candidate region gene 1 (GLTSCR1) and its paralog GLTSCR1-like form SWI/SNF chromatin remodeling subcomplexes. The Journal of biological chemistry 293, 3892–3903 (2018). - PMC - PubMed

Publication types