Review
. 2019 Sep 22:2019:8946729.
doi: 10.1155/2019/8946729. eCollection 2019.

Preclinical Molecular Imaging for Precision Medicine in Breast Cancer Mouse Models

Affiliations
Review

Preclinical Molecular Imaging for Precision Medicine in Breast Cancer Mouse Models

M F Fiordelisi et al. Contrast Media Mol Imaging. .

Abstract

Precision and personalized medicine is gaining importance in modern clinical medicine, as it aims to improve diagnostic precision and to reduce consequent therapeutic failures. In this regard, prior to use in human trials, animal models can help evaluate novel imaging approaches and therapeutic strategies and can help discover new biomarkers. Breast cancer is the most common malignancy in women worldwide, accounting for 25% of cases of all cancers and is responsible for approximately 500,000 deaths per year. Thus, it is important to identify accurate biomarkers for precise stratification of affected patients and for early detection of responsiveness to the selected therapeutic protocol. This review aims to summarize the latest advancements in preclinical molecular imaging in breast cancer mouse models. Positron emission tomography (PET) imaging remains one of the most common preclinical techniques used to evaluate biomarker expression in vivo, whereas magnetic resonance imaging (MRI), particularly diffusion-weighted (DW) sequences, has been demonstrated as capable of distinguishing responders from nonresponders for both conventional and innovative chemo- and immune-therapies with high sensitivity and in a noninvasive manner. The ability to customize therapies is desirable, as this will enable early detection of diseases and tailoring of treatments to individual patient profiles. Animal models remain irreplaceable in the effort to understand the molecular mechanisms and patterns of oncologic diseases.


Conflict of interest statement

The authors declare that they have no conflicts of interest.

Figures

Figure 1
Figure 1
Female STAT1–/– mice imaged with small-animal PET/CT using 18F-FES (a) and 18F-FFNP (b). Coronal 3-dimensional fused small-animal PET/CT images show a primary tumor in the left upper thoracic fat pad (red arrow) and a smaller tumor in the left lower thoracic fat pad (white arrow) (adapted from original research published in JNM. [25] © SNMMI).
Figure 2
Figure 2
Diffusion-weighted (DW) magnetic resonance imaging (MRI). Apparent diffusion coefficient (ADC) parametric maps of a representative mouse from each cohort. The columns indicate baseline, day 1, and day 4 posttreatment, whereas each row indicates each of the four experimental groups. Regions with noticeably increased ADC values are observed within the center of the treated and control HR6 cohorts (reprinted from [20], copyright with permission from © 2014 Neoplasia Press, Inc., published by Elsevier Inc.).
Figure 3
Figure 3
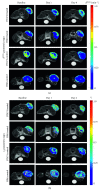
Dynamic contrast-enhanced (DCE) magnetic resonance imaging (MRI) parametric maps. In (a) Ktrans and in (b) ve of a representative mouse from each group. The Ktrans parametric maps reveal enhancement along the periphery with increasing trends in the BT474-treated group. The Ktrans parametric maps remain fairly consistent in HR6-treated groups, while the BT474 and HR6 control groups slightly decrease over time. The ve parametric maps reveal variations within all the observed tumors, with increased levels in the treated groups compared to the control groups (reprinted from [20], copyright with permission from © 2014 Neoplasia Press, Inc., published by Elsevier Inc.).
Figure 4
Figure 4
In vivo contrast-enhanced high-frequency ultrasonography with antivascular endothelial growth factor receptor 2 (VEGFR2) labeled microbubbles in a xenograft mouse model of breast cancer. The green bar on the left is a colorimetric scale for the specific ultrasonographic contrast agent signal intensity (courtesy of Mancini M., Greco A., unpublished).
Figure 5
Figure 5
In vivo fluorescence molecular imaging of breast cancer (MDA-MB-231) xenografts. Tracking of bone marrow mesenchymal stem cells labeled with a NIR fluorophore, pretreated with a nuclease-resistant aptamer (Gint4.T) or scrambled aptamer (Scr) (reprinted from [32], copyright with permission from CC by NC 4.0).

Similar articles

Cited by

References

    1. Ferlay J., Soerjomataram I., Dikshit R., et al. Cancer incidence and mortality worldwide: sources, methods and major patterns in GLOBOCAN 2012. International Journal of Cancer. 2015;136(5):E359–E386. doi: 10.1002/ijc.29210. - DOI - PubMed
    1. European Society of Radiology. Medical imaging in personalised medicine: a white paper of the research committee of the European Society of Radiology (ESR) Insights Into Imaging. 2011;2(6):621–630. doi: 10.1007/s13244-011-0125-0. - DOI - PMC - PubMed
    1. Jameson J. L., Longo D. L. Precision medicine—personalized, problematic, and promising. New England Journal of Medicine. 2015;372(23):2229–2234. doi: 10.1056/nejmsb1503104. - DOI - PubMed
    1. Valdes R., Jr., Yin D. Fundamentals of pharmacogenetics in personalized, precision medicine. Clinics in Laboratory Medicine. 2016;36(3):447–459. doi: 10.1016/j.cll.2016.05.006. - DOI - PubMed
    1. Wang Z.-G., Zhang L., Zhao W.-J. Definition and application of precision medicine. Chinese Journal of Traumatology. 2016;19(5):249–250. doi: 10.1016/j.cjtee.2016.04.005. - DOI - PMC - PubMed

MeSH terms