. 2019 Aug 28;6(8):190733.
doi: 10.1098/rsos.190733. eCollection 2019 Aug.

Sex-linked genetic diversity originates from persistent sociocultural processes at microgeographic scales

Affiliations

Sex-linked genetic diversity originates from persistent sociocultural processes at microgeographic scales

Ning Ning Chung et al. R Soc Open Sci. .

Abstract

Population genetics has been successful at identifying the relationships between human groups and their interconnected histories. However, the link between genetic demography inferred at large scales and the individual human behaviours that ultimately generate that demography is not always clear. While anthropological and historical context are routinely presented as adjuncts in population genetic studies to help describe the past, determining how underlying patterns of human sociocultural behaviour impact genetics still remains challenging. Here, we analyse patterns of genetic variation in village-scale samples from two islands in eastern Indonesia, patrilocal Sumba and a matrilocal region of Timor. Adopting a 'process modelling' approach, we iteratively explore combinations of structurally different models as a thinking tool. We find interconnected socio-genetic interactions involving sex-biased migration, lineage-focused founder effects, and on Sumba, heritable social dominance. Strikingly, founder ideology, a cultural model derived from anthropological and archaeological studies at larger regional scales, has both its origins and impact at the scale of villages. Process modelling lets us explore these complex interactions, first by circumventing the complexity of formal inference when studying large datasets with many interacting parts, and then by explicitly testing complex anthropological hypotheses about sociocultural behaviour from a more familiar population genetic standpoint.

Keywords: Pacific prehistory; dominance; migration; process models.


Conflict of interest statement

We declare we have no competing interests.

Figures
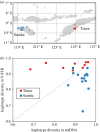
Figure 1.
Figure 1.
(a) Map of sampling locations on Sumba and Timor in eastern Indonesia. (b) Levels of sample haplotype diversity on mtDNA and the Y chromosome are inversely related in the patrilocal communities of Sumba (blue squares) and the matrilocal communities of Timor (red circles). Note that the two datasets are nearly symmetrical. When two datasets are reflection-symmetric with respect to a common axis, then the summation of the mean of their projections onto the normal line of the axis is zero. Here, 〈DS〉 + 〈DT〉 = −0.02.
Figure 2.
Figure 2.
Effects of post-marital residence movements on sample haplotype diversity. (a) The migration rate is 0.5% per generation for men in matrilocal villages and women in patrilocal villages, with a low rate of 0.5% for the opposite sex to accommodate low levels of non-compliance with the marriage rules. (b,c) Show the effects of increasing the migration rate to 2% and 10%, with the non-compliant migration rate held steady. The contour lines are estimated based on 104 data points simulated under the island model. Data points are located on a 100 × 100 uniform grid. The value of the contour line at a given location (xc, yc), after being divided by the number of simulations (104), thus gives the probability that a data point is found within the grid location (xc − 0.0025 ≤ xxc + 0.0025, yc − 0.0025 ≤ yyc + 0.0025). The rest of the parameters used are N = 300, V = 50, μmt = 0.0186, μY = 0.0249, T = 1000 and ns = 40.
Figure 3.
Figure 3.
Effects of adding dominance to the migration model. The migration rate of the dispersing sex is set to 2%, 5% and 10% for the first, second and third columns, with a constant low level of movements not conforming with the marriage rules (0.5%). The rows simulate populations with weak (1 − p = 0.8, σ = 0.5), intermediate (1 − p = 0.9, σ = 0.8) and strong (1 − p = 1.0, σ = 1.0) dominance. The rest of the parameters are N = 300, μmt = 0.0186, μY = 0.0249, ns = 40 and δ = 0.06. The contour lines are estimated based on 104 data points simulated using the island dominance model.
Figure 4.
Figure 4.
(a,b) Haplotype diversity for the island model and (c,d) the founder model. Plots on the left are without dominance, while those on the right include the effects of dominance. Parameters used are shown in table 1.
Figure 5.
Figure 5.
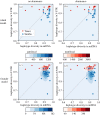
Results of Slatkin's test (PE values) based on mitochondrial (x-axis) and Y-STR (y-axis) variation, for individual villages (plotted points, red circles—matrilocal Timor, blue squares—patrilocal Sumba) and calculated on simulated data (red or blue shading, with more intense shading corresponding to a greater density of simulated villages). Dominance and founder effects are expected to generate haplotype frequency spectra with high PE values, and thus generate more pronounced skews in the PE value distribution.
Figure 6.
Figure 6.
Kolmogorov–Smirnov (KS) distances between the data and the four models studied, with parameters as indicated in table 1 and specifications given in the text. The model with the lowest summed KS distance of the two summary statistics studied is boxed.
Figure 7.
Figure 7.
Schematic of processes included in the sociocultural models. (a) Sex-biased migration. In patrilocal societies (shown), men migrate between villages more often than women, while the converse is true for matrilocal societies. (b) Dominance. Villages contain a proportion of dominant individuals (red). As dominant individuals reproduce faster than non-dominant individuals, the proportion grows; however, the rules of inheritance mean that dominance is not fully heritable and some dominant individuals in one generation move to the non-dominant class in the next generation (green). (c) Founder model. Villages bud and shrink when they reach a certain size. Six generations are shown here, with budding (in this example) in the third generation after the first village was founded.

References

    1. Matisoo-Smith E. 2015. Ancient DNA and the human settlement of the Pacific: a review. J. Hum. Evol. 79, 93–104. (10.1016/j.jhevol.2014.10.017) - DOI - PubMed
    1. Hudjashov G, Karafet TM, Lawson DJ, Downey S, Savina O, Sudoyo H, Lansing JS, Hammer MF, Cox MP. 2017. Complex patterns of admixture across the Indonesian archipelago. Mol. Biol. Evol. 34, 2439–2452. (10.1093/molbev/msx196) - DOI - PMC - PubMed
    1. Downey SS, Hallmark B, Cox MP, Norquest P, Lansing JS. 2008. Computational feature-sensitive reconstruction of language relationships: developing the ALINE distance for comparative historical linguistic reconstruction. J. Quant. Ling. 15, 340–369. (10.1080/09296170802326681) - DOI
    1. Guillot EG, Cox MP. 2014. Smartpop: inferring the impact of social dynamics on genetic diversity through high speed simulations. BMC Bioinf. 15, 175 (10.1186/1471-2105-15-175) - DOI - PMC - PubMed
    1. Sanderson J, Sudoyo H, Karafet TM, Hammer MF, Cox MP. 2015. Reconstructing past admixture processes from local genomic ancestry using wavelet transformation. Genetics 200, 469–481. (10.1534/genetics.115.176842) - DOI - PMC - PubMed

LinkOut - more resources