. 2019 Sep 25;6(9):190741.
doi: 10.1098/rsos.190741. eCollection 2019 Sep.

A machine learning approach to quantify the specificity of colour-emotion associations and their cultural differences

Affiliations

A machine learning approach to quantify the specificity of colour-emotion associations and their cultural differences

Domicele Jonauskaite et al. R Soc Open Sci. .

Abstract

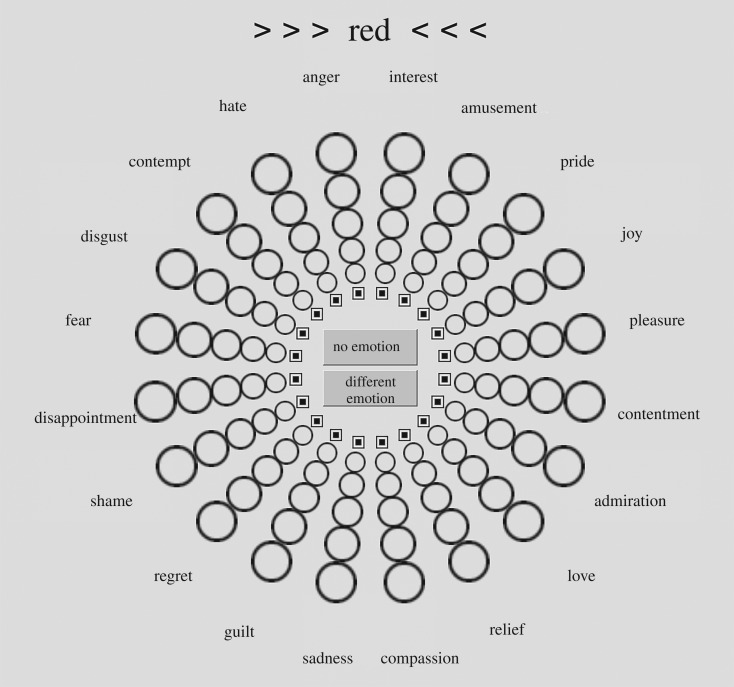
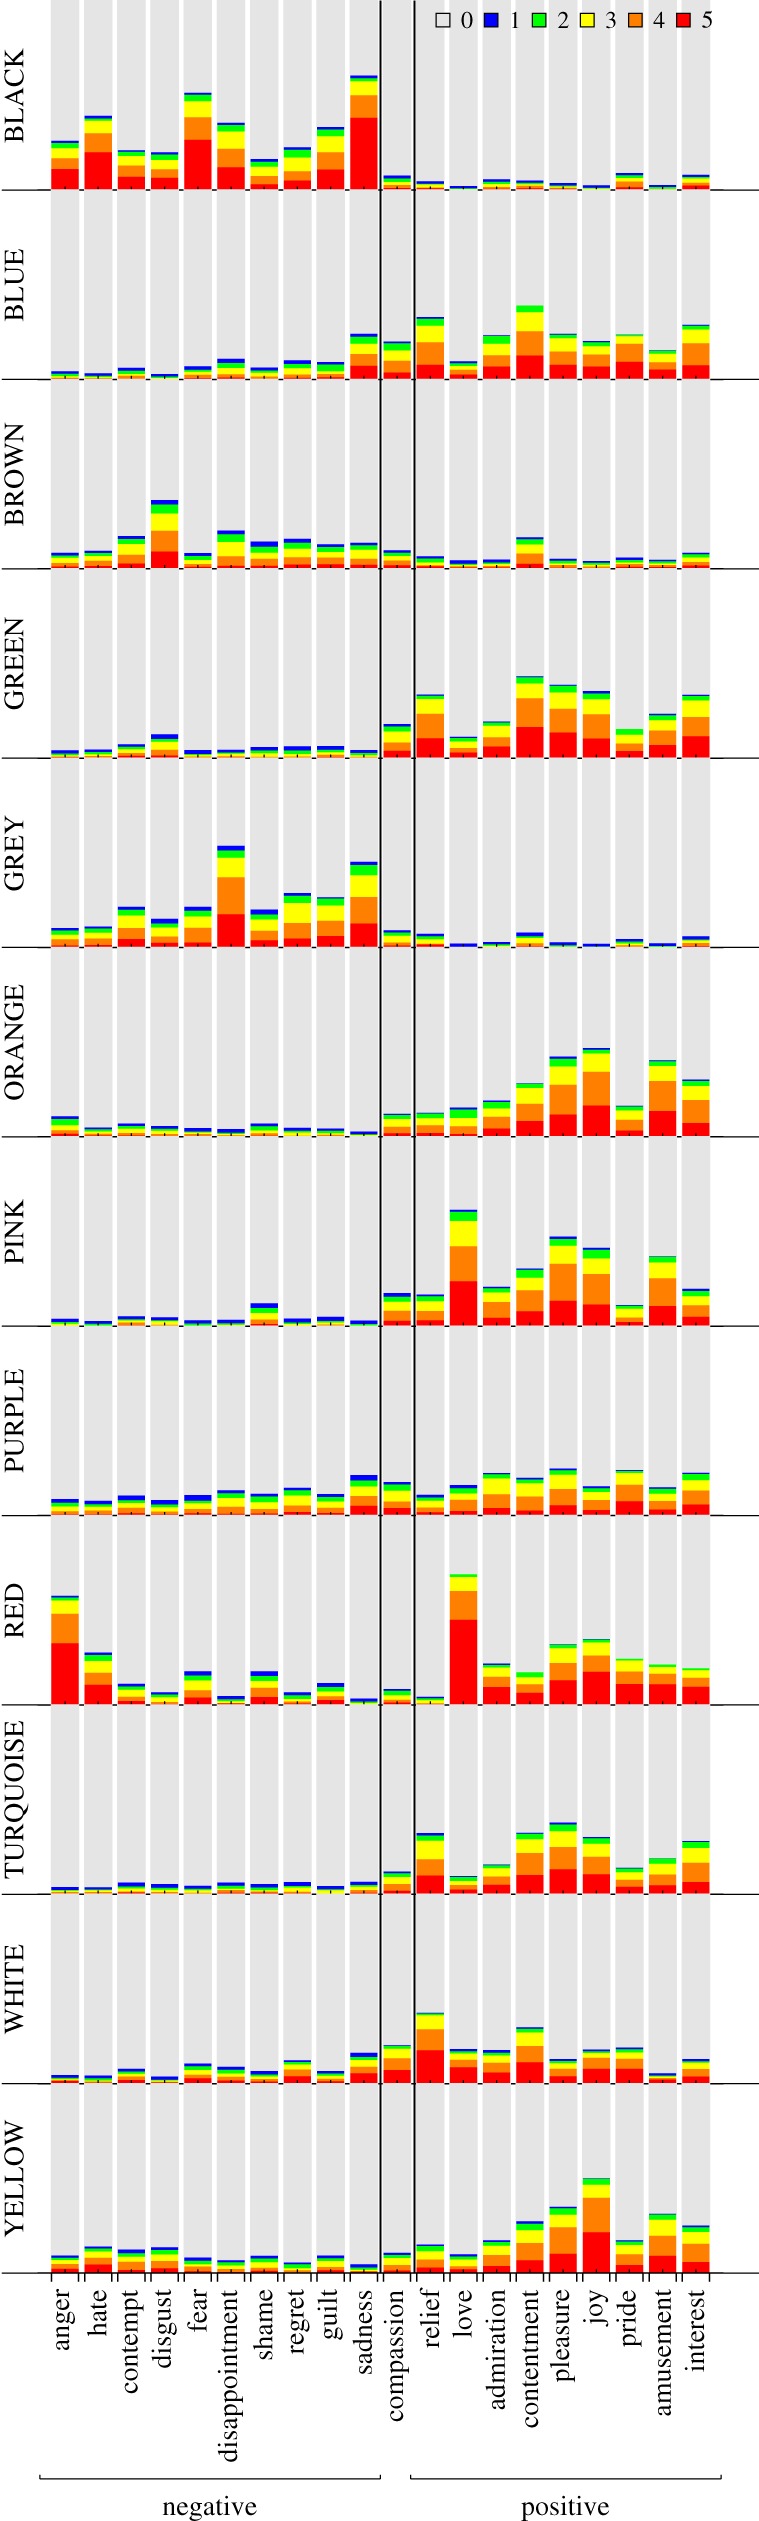
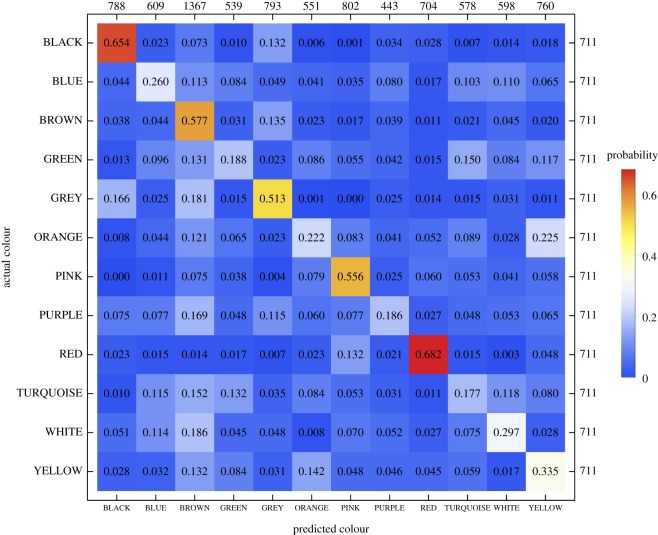
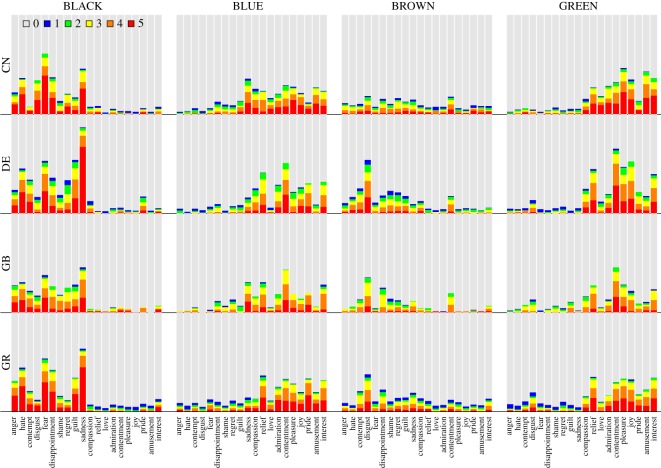
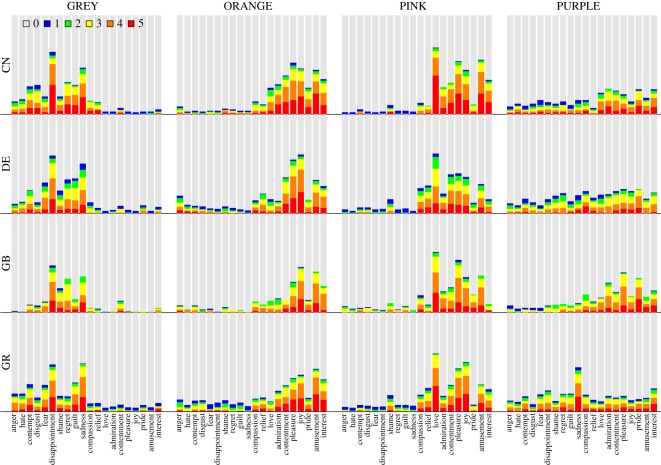
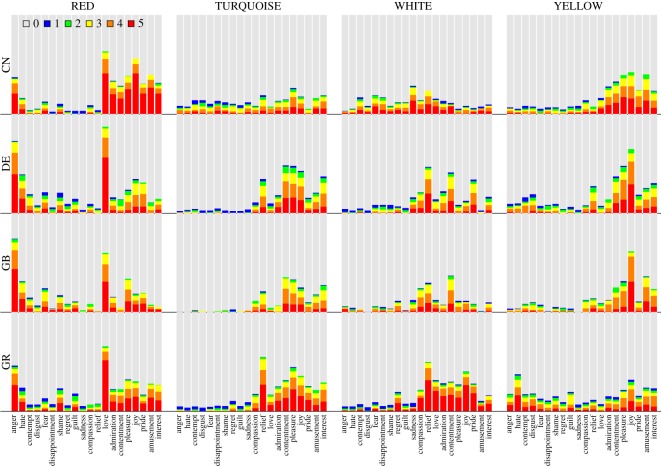
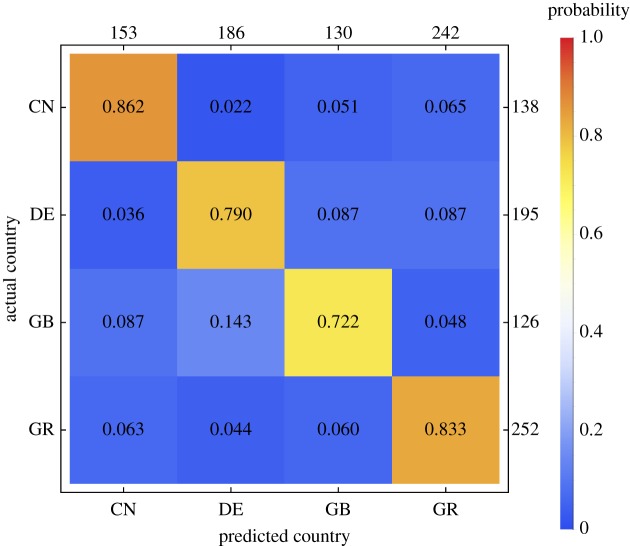
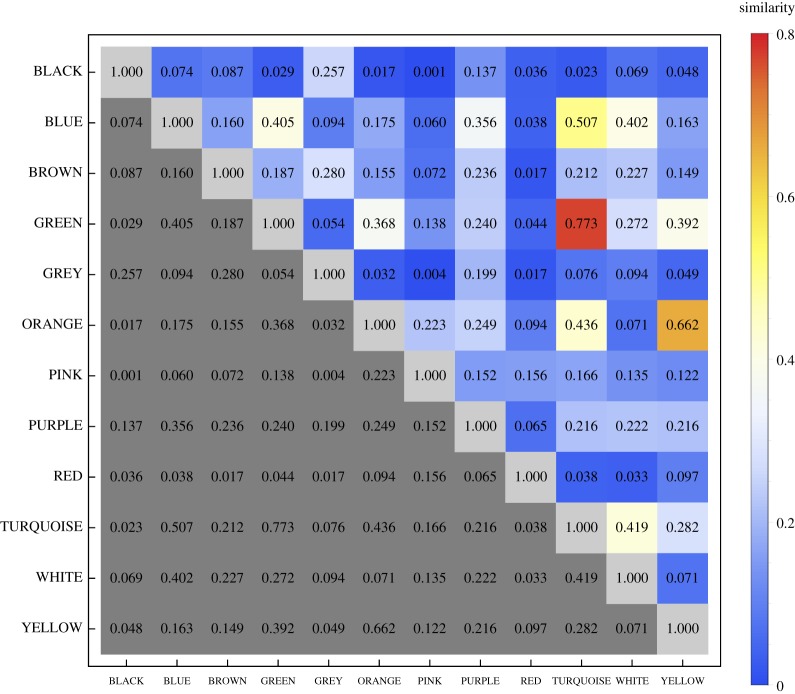
The link between colour and emotion and its possible similarity across cultures are questions that have not been fully resolved. Online, 711 participants from China, Germany, Greece and the UK associated 12 colour terms with 20 discrete emotion terms in their native languages. We propose a machine learning approach to quantify (a) the consistency and specificity of colour-emotion associations and (b) the degree to which they are country-specific, on the basis of the accuracy of a statistical classifier in (a) decoding the colour term evaluated on a given trial from the 20 ratings of colour-emotion associations and (b) predicting the country of origin from the 240 individual colour-emotion associations, respectively. The classifier accuracies were significantly above chance level, demonstrating that emotion associations are to some extent colour-specific and that colour-emotion associations are to some extent country-specific. A second measure of country-specificity, the in-group advantage of the colour-decoding accuracy, was detectable but relatively small (6.1%), indicating that colour-emotion associations are both universal and culture-specific. Our results show that machine learning is a promising tool when analysing complex datasets from emotion research.

Keywords: Geneva Emotion Wheel (GEW); colour; cultural specificity; emotion; machine learning; multivariate pattern classification.


Conflict of interest statement

The authors declare that they have no competing interests.

Figures

Figure 1.
Figure 1.
Participants used the Geneva Emotion Wheel [37] to rate the associations between 20 discrete emotions and a colour term. They selected the square to indicate that they perceived no association between the colour term shown at the top (RED in this example) and the given emotion. The largest circle represents the highest possible intensity of an emotion associated with the colour term. See table 2 for colour and emotion terms in German, Greek and simplified Mandarin Chinese.
Figure 2.
Figure 2.
Stacked bar charts showing how often participants chose the six GEW intensity ratings (unweighted average proportions across countries). Each panel represents a colour term. On the horizontal axis, emotions on the left-hand side of ‘compassion’ have negative valence, emotions on the right-hand side of ‘compassion’ have positive valence and ‘compassion’ is neutral in valence [37]. The grey areas represent the average proportion of participants that selected rating category 0 (i.e. no colour–emotion association; squares on the GEW) for a given combination of colour term and emotion. The red areas represent the proportion of participants that selected rating category 5 (i.e. the strongest emotion intensity; largest circles on the GEW). The blue, green, yellow and orange areas represent the proportions of increasing intermediate ratings of emotion intensity (smallest to second largest circle on the GEW).
Figure 3.
Figure 3.
Confusion matrix for the prediction of the colour term evaluated on a given trial based on the set of 20 colour–emotion association ratings provided by each of the 711 participants (classification algorithm: optimized support vector machines). Rows represent the actual and columns the predicted colour terms, respectively. The number in each cell represents the proportion of trials presenting the colour term specified on the vertical axis (row) that were classified as corresponding to the colour term specified on the horizontal axis (column). Thus, proportions on the main diagonal represent true positive rate or recall. The numbers on the right-hand side of the frame represent the absolute frequency of the actually presented colours. The numbers on the upper side of the frame represent the absolute frequency of predicted colours.
Figure 4.
Figure 4.
Colour terms BLACK, BLUE, BROWN and GREEN: stacked bar charts showing proportions of the six GEW rating categories representing the intensity of the associated emotions, separately for the four countries. Same colour code as in figure 2. Rows represent countries (CN: China, DE: Germany, GB: United Kingdom, GR: Greece) and columns represent colour terms.
Figure 5.
Figure 5.
Colour terms GREY, ORANGE, PINK and PURPLE: stacked bar charts showing proportions of the six GEW rating categories, separately for the four countries. Same format as figure 4.
Figure 6.
Figure 6.
Colour terms RED, TURQUOISE, WHITE and YELLOW: stacked bar charts showing proportions of the six GEW rating categories, separately for the four countries. Same format as figure 4.
Figure 7.
Figure 7.
Confusion matrix for the prediction of the country of origin based on the 12 × 20 colour–emotion association ratings provided by each participant. Rows represent the actual and columns the predicted country of origin, respectively (CN: China, DE: Germany, GB: United Kingdom, GR: Greece). The number in each cell represents the probability that a participant originating from the country specified on the vertical axis (row) was classified as originating from the country specified on the horizontal axis (column). Thus, proportions on the main diagonal represent the true positive rate, or recall. The numbers on the right-hand side of the frame represent the absolute frequency of participants actually originating from a given country. The numbers on the upper side of the frame represent the absolute frequency of participants predicted to originate from a given country.
Figure 8.
Figure 8.
Matrix of similarity values for all pairs of colours, estimated with Luce's biased choice model [52] from the confusion matrix shown in figure 3. By definition, the similarity between one colour and itself is 1.0 and the minimum possible similarity is 0.0. Because the matrix is symmetric, only the upper triangle of the matrix needs to be considered and the remaining cells are shown in grey.

References

    1. Conway BR. 2009. Color vision, cones, and color-coding in the cortex. Neuroscientist 15, 274–290. (10.1177/1073858408331369) - DOI - PubMed
    1. Jonauskaite D, Mohr C, Antonietti JP, Spiers PM, Althaus B, Anil S, Dael N. 2016. Most and least preferred colours differ according to object context: new insights from an unrestricted colour range. PLoS ONE 11, e0152194 (10.1371/journal.pone.0152194) - DOI - PMC - PubMed
    1. Dael N, Perseguers MN, Marchand C, Antonietti JP, Mohr C. 2016. Put on that colour, it fits your emotion: colour appropriateness as a function of expressed emotion. Q. J. Exp. Psychol. 69, 1619–1630. (10.1080/17470218.2015.1090462) - DOI - PubMed
    1. Schloss KB, Strauss ED, Palmer SE. 2013. Object color preferences. Color Res. Appl. 38, 393–411. (10.1002/col.21756) - DOI
    1. Acking CA, Küller H. 1972. The perception of an interior as a function of its colour. Ergonomics 15, 645–654. (10.1080/00140137208924465) - DOI - PubMed