. 2019 Sep 1;9(9):1905-1921.
eCollection 2019.

PDE3A inhibitor anagrelide activates death signaling pathway genes and synergizes with cell death-inducing cytokines to selectively inhibit cancer cell growth

Affiliations

PDE3A inhibitor anagrelide activates death signaling pathway genes and synergizes with cell death-inducing cytokines to selectively inhibit cancer cell growth

Ran An et al. Am J Cancer Res. .

Abstract

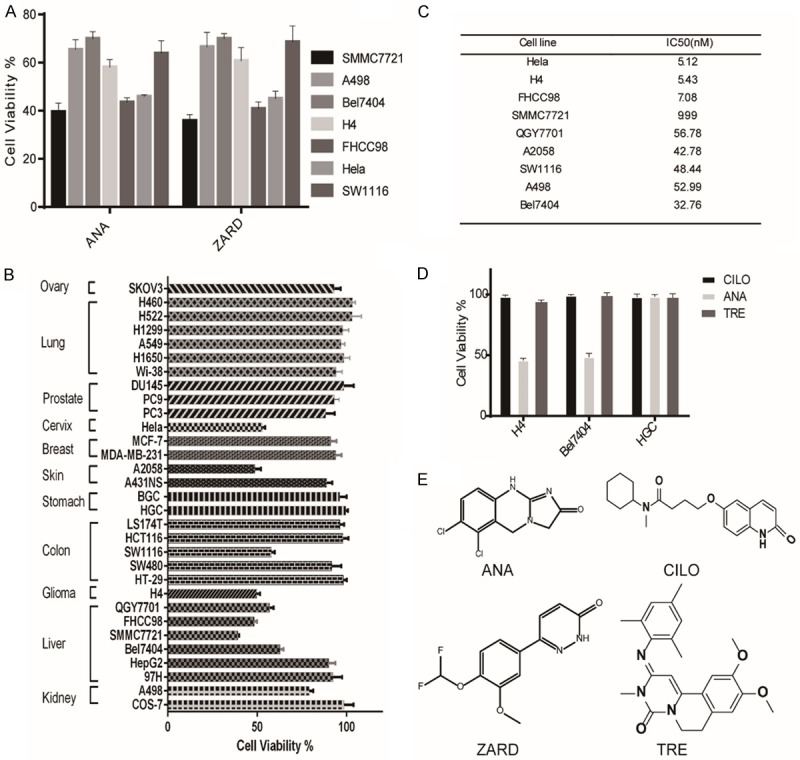
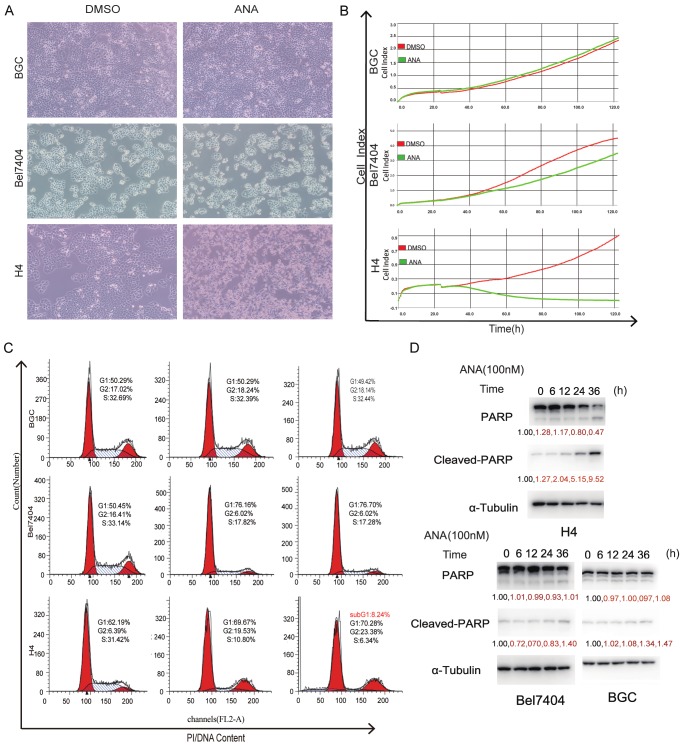
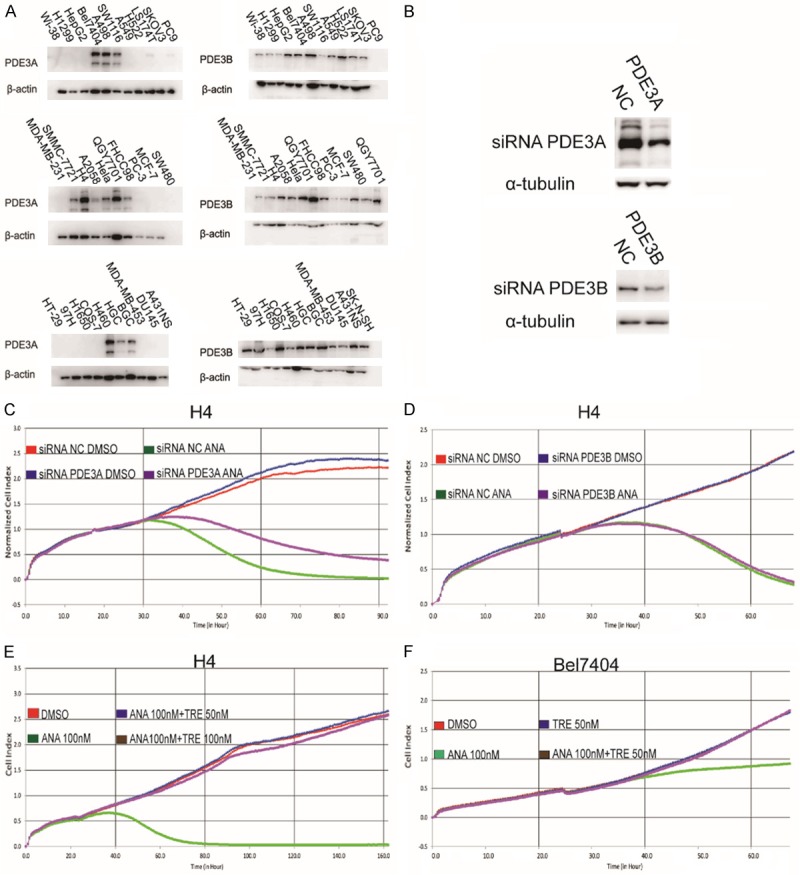
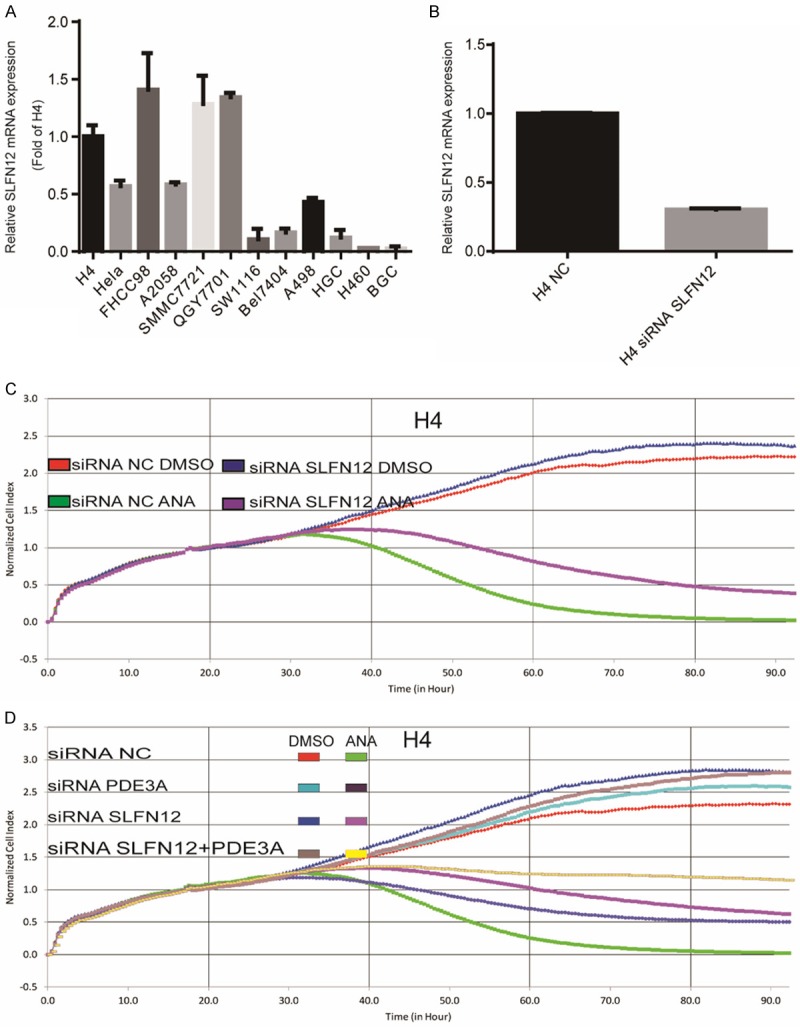
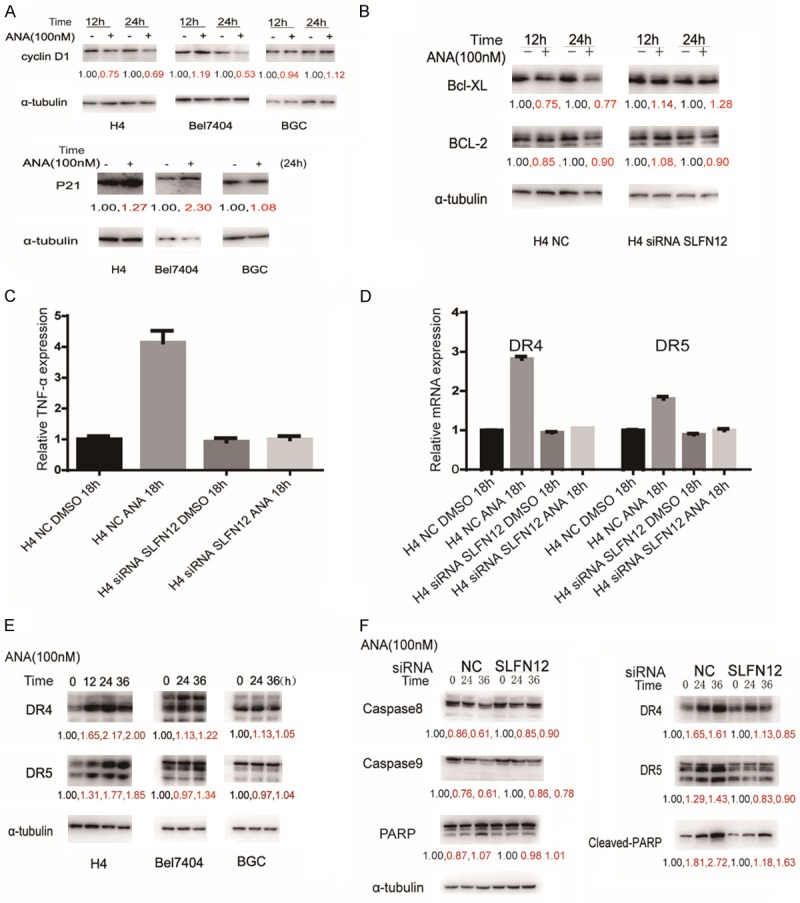
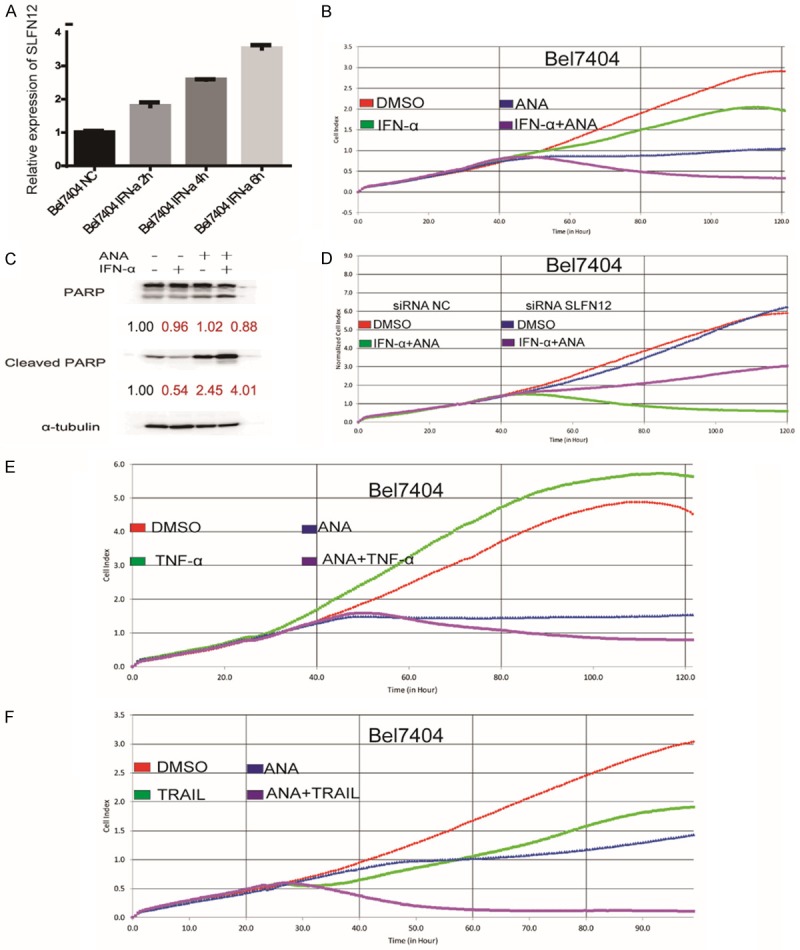
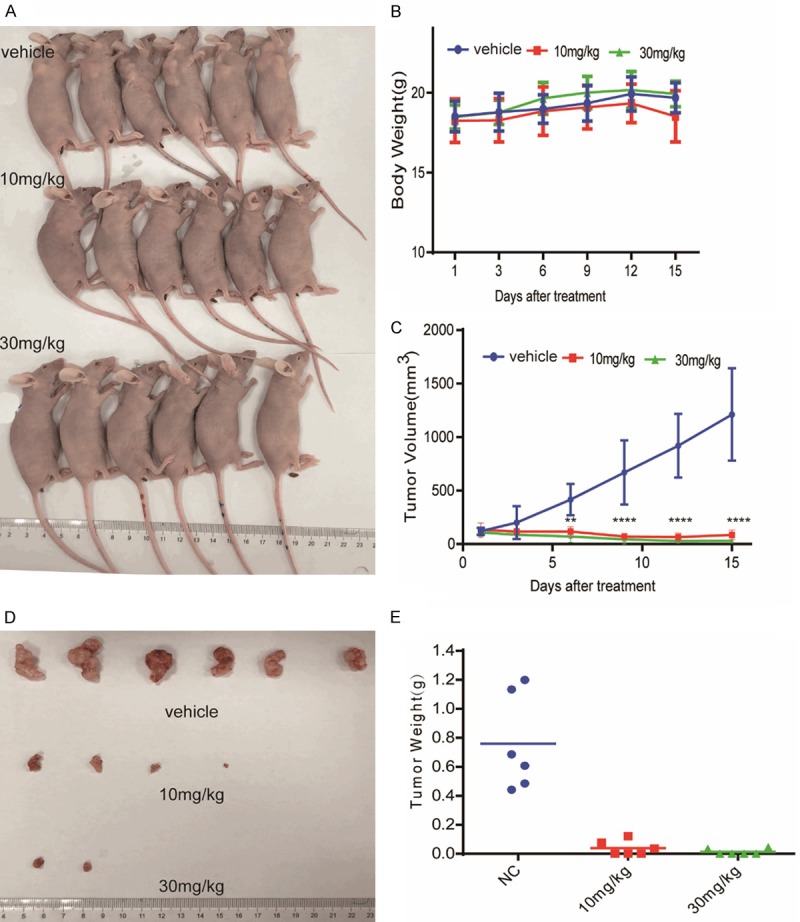
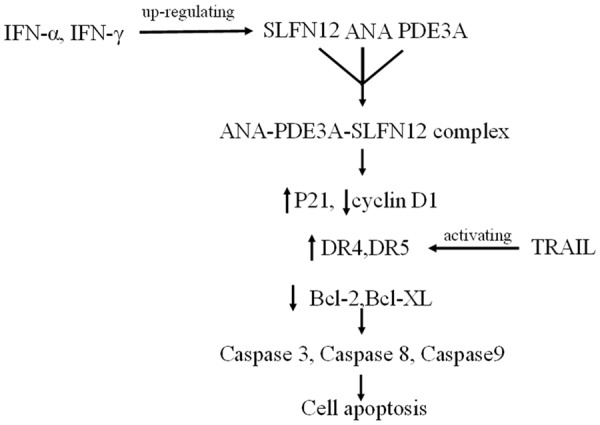
We performed a drug repurposing screening of a US Food and Drug Administration (FDA)-approved drug compound library and identified Anagrelide (ANA), a known phosphodiesterase 3A (PDE3A) inhibitor, that selectively and potently inhibited the growth of cancer cells. However, inactivation of PDE3A or knocking-down its gene expression did not inhibit cancer cell growth. It was the interaction of ANA with PDE3A that created a new function of PDE3A to alter the activities of another unknown function protein SLFN12 to cause the inhibition of cancer cell growth. The expressions of both PDE3A and SLFN12 were required for ANA to inhibit cancer cell growth. Depletion of PDE3A or SLFN12 led to ANA resistance. Furthermore, the effects of ANA on different cancer cells were different depending on the expression levels of PDE3A and SLFN12, causing G0/G1 cell cycle arrest in the cells expressing lower levels of SLFN12, but apoptosis in the cells expressing higher levels of the two proteins. Further investigation into the molecular mechanisms of the ANA-induced cell cycle arrest and apoptosis identified a set of cell cycle and apoptosis-related genes whose expressions were altered by ANA treatment. ANA also synergized with the cell death-inducing cytokines IFN-α, IFN-γ, TNF-α, or TRAIL, which regulated the same set of genes as ANA did, to induce apoptosis of the cancer cells. Our study uncovered new activities, functions, and mechanisms of ANA and SLFN12 and provided a diagnosis method to precisely use ANA as an anti-cancer drug. It also revealed PDE3A and SLFN12 as new anti-cancer drug targets for developing novel anti-cancer therapies.

Keywords: Anagrelide; PDE3A; SLFN12; cancer; cytokine.


Conflict of interest statement

None.

Figures

Figure 1
Figure 1
Anagrelide (ANA) selectively inhibited growth of cancer cells from different tissues. A. Effects of ANA and ZARD on the growth of different types of cancer cells. The indicated cancer cell lines were cultured with 10 µM ANA or ZARD for 72 h and cell growths were measured by the MTT assay. B. Effects of ANA (100 nM) on the growth of different types of cancer cell lines. 31 indicated cancer cell lines were cultured with 100 nM ANA for 72 h and the cell growths were measured by the MTT assay. C. IC50 values of ANA in the ANA-sensitive cell lines. All data were presented as mean ± s.d. (n = 3). D. Comparison of the effects of PDE3 inhibitors Anagrelide (ANA), Trequinsin (TRE), Cilostamide (CILO) on the growths of the cancer cells. The cells were cultured with the indicated PDE3 inhibitors (1 μM) for 72 h and cell growths were measured by the MTT assay. E. The chemical structures of PDE3 inhibitors.
Figure 2
Figure 2
ANA induced G1 cell cycle arrest in some cancer cells but apoptosis in others. (A) Effects of ANA on cell morphologies of different types of human cancer cells (× 200 magnifications). (B) RTCA analyses of the effects of ANA on the growths of different types of cancer cells. The indicated cancer cells were cultured with 100 nM ANA (green) or DMSO (red) and the cell growths were recorded continuously by RTCA. (C) Flow cytometry analyses of the effects of ANA on cell cycle progressions of the cancer cells. The indicated cells were treated with ANA (100 nM) for indicated time periods followed by Flow cytometry analyses. The percentage of cells in different phases of cell cycle were indicated. (D) Immunoblotting analyses of the effects of ANA on apoptosis of the cancer cells. The indicated cells were treated with ANA (100 nM) for indicated time periods and the whole cell lysates were processed for immunoblotting analyses using an anti-PARP antibody. The anti-tubulin antibody was used as a control for equal protein loading.
Figure 3
Figure 3
PDE3A was necessary but not sufficient for ANA to induce growth inhibition of cancer cells. (A) Immunoblotting analyses of PDE3A and PDE3B expressions in different cancer cell lines. The whole cell lysates of the indicated cells were analyzed by immunoblotting using the anti-PDE3A or anti-PDE3B antibody. The anti-tubulin or β-actin antibody was used as a control for equal protein loading. (B) Effects of siRNA knockdown on the protein expressions of PDE3A and PDE3B. H4 cells were transiently transfected with a PDE3A-specific siRNA, a PDE3B-specific siRNA, or a non-specific scrambled control siRNA. Cells were harvested 24 h later and the cell lysates were processed for immunoblotting using an anti-PDE3A, PDE3B, or α-tubulin antibody. (C and D) RTCA analyses of the effects of knocking-down PDE3A (C) or PDE3B (D) on the ANA-induced cell growth inhibition. H4 cells were transfected with PDE3A or PDE3B siRNA for 24 h, and the cells were then re-plated into 96-well plates and cultured with ANA (100 nM) or DMSO. Cell growths were recorded by RTCA. (E and F) RTCA analyses of the effects of combinational treatments of the PDE3 inhibitors on the growths of the cancer cells. The ANA death-sensitive cell line H4 and the ANA cell cycle arrest-sensitive cell line Bel7404 were treated with vehicle, ANA, TRE, or combination of ANA with TRE at the indicated doses, followed by RTCA analyses.
Figure 4
Figure 4
SLFN12 was required for the ANA-induced growth inhibition of cancer cells. A. Quantitative Real-Time PCR analyses of SLFN12 mRNA expression in 13 cancer cell lines. The mRNA levels were normalized to the GAPDH mRNA expression. B. Effects of SLFN12 siRNA on the mRNA expression of SLFN12. The H4 cells were transiently transfected with the SLFN12-specific siRNAs targeting three different sequences or non-specific scrambled siRNA. SLFN12 mRNA expression was measured by real-time PCR 48 h after siRNA transfection. C. RTCA analyses of the effects of knocking down SLFN12 expression on the ANA-induced growth inhibition. The siRNA-transfected H4 cells were cultured with ANA (100 nM) or DMSO and the growth of the cells were recorded by RTCA. D. The H4 cells were transiently transfected with the SLFN12-specific siRNA, PDE3A-specific siRNA, or a combination of the two with or without ANA treatments and the cell growths were recorded by RTCA.
Figure 5
Figure 5
Effects of ANA on the expressions of cell cycle and cell death regulating genes. (A) Immunoblotting analyses of effects of ANA on cyclinD1 and P21 protein expression in the three types of cells. The cells were treated with ANA for the indicated time periods and the cell lysates were processed for immunoblotting with indicated antibodies. α-tubulin antibody was used as a control for equal protein loading. (B) Effects of ANA on the expressions of Bcl-XL and Bcl-2 proteins (left) and the effects of SLFN12 siRNA on the ANA-induced protein level changes of Bcl-XL and Bcl-2 (right). H4 cells were treated with or without ANA (100 nM), or with or without SLFN12 siRNA as indicate for 12 or 24 hours, and the cell lysates were processed for immunoblotting analyses using antibodies as indicated. (C and D) Effects of ANA on the expressions of TNF-α, DR4, and DR5 mRNAs and the effects of SLFN12 siRNA on the ANA-induced mRNA level changes of TNF-α, DR4, and DR5 in H4 cells. The H4 cells were treated with or without ANA (100nM), or with or without the SLFN12 siRNA as indicated for 18 h, and the cell lysates were processed and the mRNA levels of TNF-α (C), DR4, DR5 (D) were measured by quantitative RT-PCR analyses. (E) Effects of ANA on DR4 and DR5 protein expressions in the three types of cells. The cells were treated with ANA (100 nM) for indicated time periods and the cell lysates were processed for immunoblotting analyses using the indicated antibodies. Anti-tubulin antibody was used as a control for equal protein loading. (F) Effects of ANA or ANA plus SLFN12 siRNA on the activation of caspase 8 and caspase 9, protein expressions of DR4 and DR5, and cleavage of PARP. The H4 cells were treated with ANA, a combination of ANA and SLFN12 siRNA, for the indicated time periods, and the cells were processed for immunoblotting analyses using antibodies as indicated. Anti-tubulin antibody was used as a control for equal protein loading.
Figure 6
Figure 6
TRAIL or interferons synergized with ANA to inhibit cancer cell growth. A. Effects of IFN-α on SLFN12 mRNA expression. Bel7404 cells were stimulated with IFN-α (3000 IU/mL) for indicated time periods and the SLFN12 mRNA expression was measured by Quantitative Real-Time PCR. B. Effects of ANA or ANA+ IFN-α on the growth of Bel7404 cells. Bel7404 cells were stimulated with IFN-α (3000 IU/mL), ANA (100 nM), or a combination of the two and the cell growths were analyzed by RTCA. C. Effects of IFN-α, ANA or ANA+ IFN-α on cell death. Bel7404 cells were treated with IFN-α (3000 IU/mL), ANA (100 nM), or a combination of the two, and the cell death were analyzed by immunoblotting for PARP cleavage. The anti-tubulin antibody was used as a control for equal protein loading. D. Effects of SLFN12 siRNA-knockdown on the IFN-α and ANA combination treatment. The Bel7404 cells were transfected with either a control siRNA or the SLFN12 siRNA for 24 hours, then the siRNA-transfected H4 cells were cultured with ANA (100 nM) plus IFN-α or DMSO and the growth of the cells were measured by RTCA. E. Effects of TNF-α or TRAIL on the ANA-induced cell growth inhibition. The Bel7404 cells were treated with TNF-α (10 ng/mL), ANA, or a combination of TNF-α and ANA. The cell growths were monitored by the RTCA analyzer. F. Effects of TRAIL on the ANA-induced cell growth inhibition. The Bel7404 cells were treated with TRAIL (100 ng/mL), ANA, or a combination of TRAIL and ANA. The cell growths were monitored by the RTCA analyzer.
Figure 7
Figure 7
ANA inhibited the growth of tumor xenograft in vivo. Human tumor xenografts of H4 cells were established by subcutaneously inoculating the cells into female BALB/c-nude mice. The mice were orally administered with ANA (10 mg/kg or 30 mg/kg) or vehicle daily for 15 days when the tumor volumes reached 100 mm3. A. Photograph of the tumor-burdened mice after 15 days of ANA treatment. B. Body weight curves of the tumor-burdened mice. C. The tumor growth curves of the tumor-burdened mice. The tumors were measured and analyzed by two-way ANOVA. Data were presented as means ± s.d. (n = 6), ** P < 0.01, **** P < 0.0001. D. Photograph of the tumors from the control and ANA-treated mice. Mice were sacrificed after 15 days ANA treatment and the tumors were dissected and photographed. E. The weights of the individual tumors and their means.
Figure 8
Figure 8
A schematic model of the mechanisms of the ANA-induced apoptosis and its synergies with the cell death inducing cytokines.

References

    1. Hanahan D, Weinberg RA. Hallmarks of cancer: the next generation. Cell. 2011;144:646–674. - PubMed
    1. Hanahan D, Weinberg RA. The hallmarks of cancer. Cell. 2000;100:57–70. - PubMed
    1. Aggarwal S. Targeted cancer therapies. Nat Rev Drug Discov. 2010;9:427–428. - PubMed
    1. Schilsky RL. Personalized medicine in oncology the future is now. Nat Rev Drug Discov. 2010;9:363–6. - PubMed
    1. Gerber DE. Targeted therapies: a new generation of cancer treatments. Am Fam Physician. 2008;77:311–319. - PubMed

LinkOut - more resources