. 2019 Jul;7(7):692-703.
doi: 10.1029/2019EF001189. Epub 2019 Jul 3.

Concurrent 2018 Hot Extremes Across Northern Hemisphere Due to Human-Induced Climate Change

Affiliations

Concurrent 2018 Hot Extremes Across Northern Hemisphere Due to Human-Induced Climate Change

M M Vogel et al. Earths Future. 2019 Jul.

Abstract

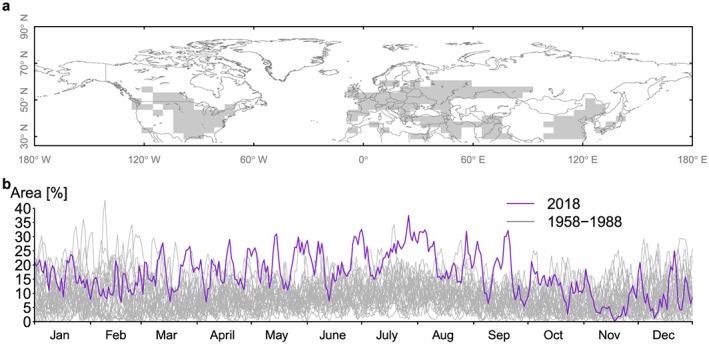
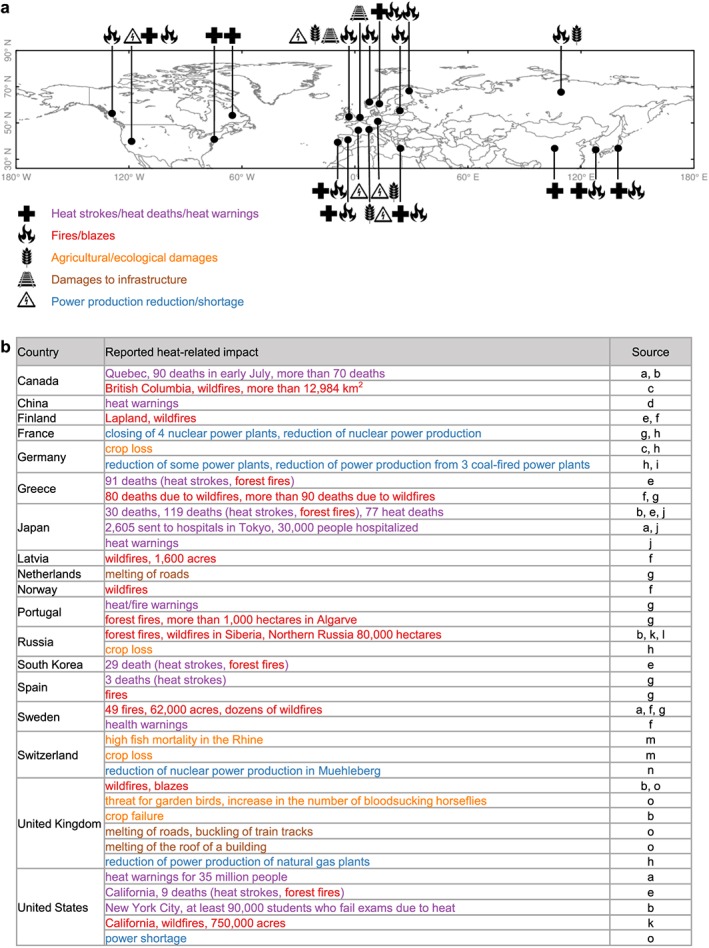
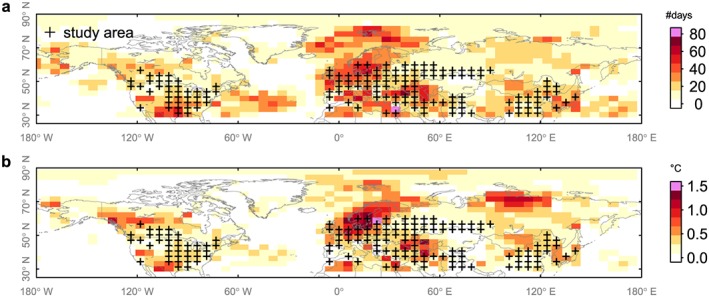
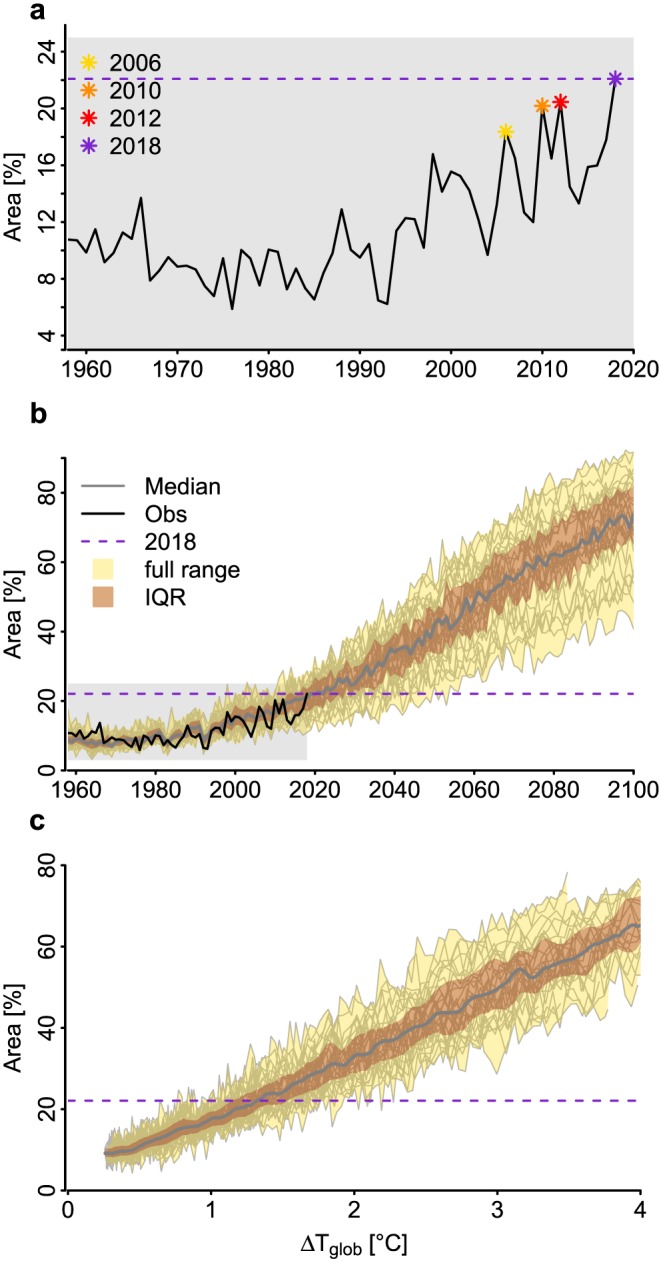
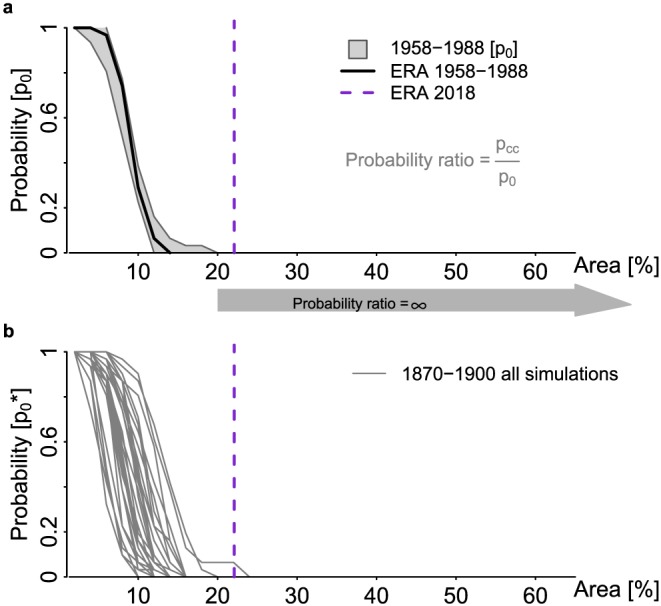
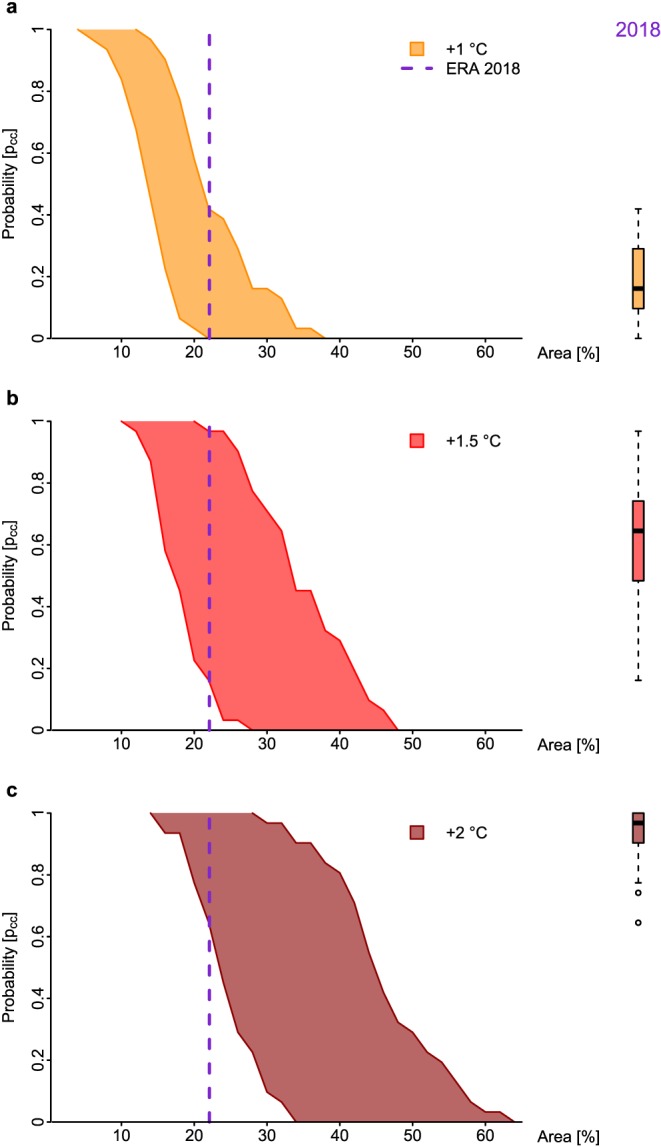
Extremely high temperatures pose an immediate threat to humans and ecosystems. In recent years, many regions on land and in the ocean experienced heat waves with devastating impacts that would have been highly unlikely without human-induced climate change. Impacts are particularly severe when heat waves occur in regions with high exposure of people or crops. The recent 2018 spring-to-summer season was characterized by several major heat and dry extremes. On daily average between May and July 2018 about 22% of the populated and agricultural areas north of 30° latitude experienced concurrent hot temperature extremes. Events of this type were unprecedented prior to 2010, while similar conditions were experienced in the 2010 and 2012 boreal summers. Earth System Model simulations of present-day climate, that is, at around +1 °C global warming, also display an increase of concurrent heat extremes. Based on Earth System Model simulations, we show that it is virtually certain (using Intergovernmental Panel on Climate Change calibrated uncertainty language) that the 2018 north hemispheric concurrent heat events would not have occurred without human-induced climate change. Our results further reveal that the average high-exposure area projected to experience concurrent warm and hot spells in the Northern Hemisphere increases by about 16% per additional +1 °C of global warming. A strong reduction in fossil fuel emissions is paramount to reduce the risks of unprecedented global-scale heat wave impacts.

Keywords: attribution; heat wave; model projections; temperature extremes.


Figures

Figure 1
Figure 1
Considered hot day area and time frame. (a) Regions north of 30° latitude that either have a high population density (at least 30 people per square kilometer) or are agricultural regions (NH AgPop area) are highlighted in gray. (b) Annual time series of daily concurrent hot day area fraction of the NH AgPop area for 1959–1988 (gray) and 2018 (purple).
Figure 2
Figure 2
Heat‐related impacts in 2018 as reported by news agencies. (a) Approximate locations of heat‐related impacts in the northern midlatitudes (above 30° north). The impacts are categorized according to heat impact (cross, purple text), fires (fire, red text), agricultural and ecological damages (wheat, orange text), damages to infrastructure (railway track, brown text), and impacts on power production reduction/shortage (warning signal, blue text). (b) Detailed heat‐related impacts per country. The color refers to the categories in (a). The sources where this information is taken from are listed in Table 1.
Figure 3
Figure 3
North hemispheric extent of the 2018 heat wave.(a) Number of hot days between May and July 2018. (b) Mean temperature anomalies of hot days between May and July compared to the 90th percentile climatology of daily temperatures in the reference period 1958–1988.
Figure 4
Figure 4
Temporal evolution of average concurrent hot day areas between May and July in observations and Earth system models. (a) Observed average concurrent hot day area between May and July in percent of the NH AgPop area for the time period 1958 to 2018. (b) Modeled average concurrent hot day area from 1958 to 2100 based on Coupled Model Intercomparison Project phase 5 models. The observed time series is shown in black; the range of (a) is highlighted in gray. (c) Modeled concurrent hot day area as a function of global mean temperature (T glob) increase (see section 2.8). The 2018 event is highlighted by a horizontal purple line in each subpanel. For the models, we used a high‐emission scenario (RCP8.5). We show the model median (gray), interquartile range (red), and the full model range (yellow).
Figure 5
Figure 5
The 2018 north hemispheric concurrent heat extremes in an attribution framework. Shown are average north hemispheric concurrent hot day area thresholds (May to July) relative to the full NH AgPop area (0% to 65%) versus probabilities of exceeding that concurrent hot day area. The GCWH18 area is highlighted by a purple vertical dashed line in each subpanel. (a) Probabilities for exceeding concurrent hot day areas in the reference period 1958–1988 (p 0) for the multimodel ensemble (gray range) and observations (black line). The gray arrow indicates concurrent hot day area thresholds where p 0=0, and thus, the probability ratio pccp0 is infinity independent of p CC. (b) Probabilities for exceeding concurrent hot day areas in the preindustrial period 1870–1900 ( p0*). Each gray line represents one model simulation (n=29). (c) Multimodel range of probabilities for exceeding concurrent hot day areas for global warming of +1 °C (orange), +1.5 °C (red), and +2 °C (dark red) with respect to 1870–1900. The boxplots indicate the distributions of the exceedance probabilities of the multimodel ensemble for the 2018‐like concurrent hot day area (22%) for the different warming levels.
Figure 6
Figure 6
North hemispheric concurrent hot day area thresholds (May to July) relative to the full NH AgPop area (0% to 65%) versus multimodel range of probabilities of exceeding that concurrent hot day area for global warming of +1 °C (a), +1.5 °C (b), and +2 °C (c) with respect to 1870–1900. The GCWH18 area is highlighted by a purple vertical dashed line in each subpanel. The boxplots indicate the distributions of the exceedance probabilities of the multimodel ensemble for the 2018‐like concurrent hot day area (22%) for the different warming levels.

References

    1. Baldwin, J. W. , Dessy, J. B. , Vecchi, G. A. , & Oppenheimer, M. (2019). Temporally compound heat wave events and global warming: An emerging hazard. Earth's Future, 7, 411–427. 10.1029/2018EF000989 - DOI
    1. Barriopedro, D. , Fischer, E. M. , Luterbacher, J. , Trigo, R. M. , & García‐Herrera, R. (2011). The hot summer of 2010: Redrawing the temperature record map of Europe. Science, 332(6026), 220–224. - PubMed
    1. Berghuijs, W. R. , Allen, S. T. , Harrigan, S. , & Kirchner, J. W. (2019). Growing spatial scales of synchronous river flooding in europe. Geophysical Research Letters, 46, 1423–1428. 10.1029/2018GL081883 - DOI
    1. Christidis, N. , Jones, G. , & Stott, P. A. (2014). Dramatically increasing chance of extremely hot summers since the 2003 European heatwave. Nature Climate Change, 5, 46–50.
    1. Copernicus (2019). European state of the climate 2018. Summary. Copernicus Climate Change Service, European Centre for Medium‐Range Weather Forecasts, https://climate.copernicus.eu/sites/default/files/2019-04/Brochure_Final...

LinkOut - more resources