. 2019 Sep 27;5(9):eaax7163.
doi: 10.1126/sciadv.aax7163. eCollection 2019 Sep.

How do phonons relax molecular spins?

Affiliations

How do phonons relax molecular spins?

Alessandro Lunghi et al. Sci Adv. .

Abstract

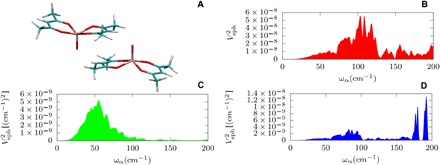
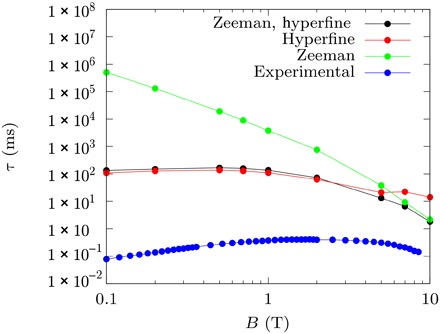
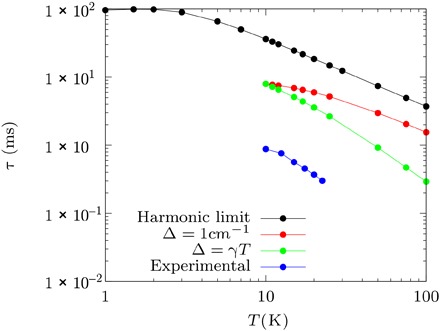
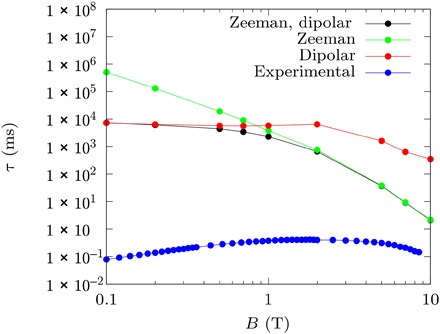
The coupling between electronic spins and lattice vibrations is fundamental for driving relaxation in magnetic materials. The debate over the nature of spin-phonon coupling dates back to the 1940s, but the role of spin-spin, spin-orbit, and hyperfine interactions has never been fully established. Here, we present a comprehensive study of the spin dynamics of a crystal of Vanadyl-based molecular qubits by means of first-order perturbation theory and first-principles calculations. We quantitatively determine the role of the Zeeman, hyperfine, and electronic spin dipolar interactions in the direct mechanism of spin relaxation. We show that, in a high magnetic field regime, the modulation of the Zeeman Hamiltonian by the intramolecular components of the acoustic phonons dominates the relaxation mechanism. In low fields, hyperfine coupling takes over, with the role of spin-spin dipolar interaction remaining the less important for the spin relaxation.


Figures

Fig. 1
Fig. 1. VO(acac)2 structure and spin phonon coupling distributions.
(A) The geometrical structure of the two VO(acac)2 molecular units inside the crystal’s unit cell. Vanadium atoms are represented in pink, oxygen in red, carbon in green, and hydrogen in white. (B) The spin-phonon coupling distribution relative to the Zeeman energy as function of the phonons’ frequency. (C) The spin-phonon coupling distribution relative to the dipolar spin-spin energy as function of the phonons’ frequency. (D) The spin-phonon coupling distribution relative to the hyperfine energy as function of the phonons’ frequency.
Fig. 2
Fig. 2. Spin relaxation time as function of the B field for one electronic spin coupled to one nuclear spin.
The relaxation time, τ, in milliseconds and T = 20 K as a function of the external field in Tesla is reported for the simulations of one electronic spin coupled to one nuclear spin and relaxing due to the phonon modulation of the Zeeman and hyperfine energies (black line and dots). The contribution coming from the sole hyperfine energy modulation is represented by a red line and dots, while the sole Zeeman contribution is reported by the green line and dots. The experimental relaxation time as extracted from AC magnetometry (19) is also reported (blue dots and line).
Fig. 3
Fig. 3. Spin relaxation time as function of the temperature T.
The relaxation time, τ, in milliseconds at B = 5 T as a function of the temperature is reported for the simulations of one electronic spin coupled to one nuclear spin and relaxing due to the modulation of the Zeeman and hyperfine energies by harmonic phonons (black line and dots), phonons with 1 cm−1 of line width (red line and dots), and phonons with a linearly T-dependent phonon lifetime (green line and dots). A coefficient γ = 0.1 cm−1/K is chosen. The experimental relaxation time as extracted from AC magnetometry (19) is also reported (blue dots and line).
Fig. 4
Fig. 4. Spin relaxation time as function of external field for two coupled electronic spins.
The relaxation time, τ, in milliseconds as a function of the external field in Tesla is reported for the simulations of two electronic spins relaxing due to the phonon modulation of the Zeeman and dipolar energies (black line and dots). Green line and dots represent the relaxation time of two isolated spins, where only the Zeeman energy is modulated by phonons. The contribution coming from the sole dipolar energy modulation is represented by a red line and dots. The experimental relaxation time as extracted from AC magnetometry (19) is also reported (blue dots and line).
Fig. 5
Fig. 5. Phonon density of states.
The total phonon density of states (DOSs) as a function of the frequency is reported in black. The total phonon density of states was also decomposed in a pure translational contribution (red line), a rotational contribution (blue line), and an intramolecular contribution (green line), all relative to a single molecule inside the unit cell. The inset shows the details of the density of states in the low-energy part of the spectrum. The Brillouin zone was integrated with a uniform mesh of 643 points. The reported density was smeared with a Gaussian function with breadth of 1.0 cm−1. a.u., arbitrary units.

References

    1. Caravan P., Strategies for increasing the sensitivity of gadolinium based MRI contrast agents. Chem. Soc. Rev. 35, 512–523 (2006). - PubMed
    1. Sessoli R., Gatteschi D., Caneschi A., Novak M. A., Magnetic bistability in a metal-ion cluster. Nature 365, 141–143 (1993).
    1. Balasubramanian G., Neumann P., Twitchen D., Markham M., Kolesov R., Mizuochi N., Isoya J., Achard J., Beck J., Tissler J., Jacques V., Hemmer P. R., Jelezko F., Wrachtrup J., Ultralong spin coherence time in isotopically engineered diamond. Nat. Mater. 8, 383–387 (2009). - PubMed
    1. Zadrozny J. M., Niklas J., Poluektov O. G., Freedman D. E., Millisecond coherence time in a tunable molecular electronic spin qubit. ACS Cent. Sci. 1, 488–492 (2015). - PMC - PubMed
    1. Bader K., Winkler M., van Slageren J., Tuning of molecular qubits: Very long coherence and spin–lattice relaxation times. Chem. Commun. 52, 3623–3626 (2016). - PubMed

Publication types