

Eplet mismatch analysis and allograft outcome across racially diverse groups in a pediatric transplant cohort: a single-center analysis
- PMID: 31599339
- PMCID: PMC6901410
- DOI: 10.1007/s00467-019-04344-1
Eplet mismatch analysis and allograft outcome across racially diverse groups in a pediatric transplant cohort: a single-center analysis
Erratum in
-
Correction to: Eplet mismatch analysis and allograft outcome across racially diverse groups in a pediatric transplant cohort: a single-center analysis.Pediatr Nephrol. 2020 Apr;35(4):719. doi: 10.1007/s00467-019-04444-y. Pediatr Nephrol. 2020. PMID: 31828470 Free PMC article.
Abstract
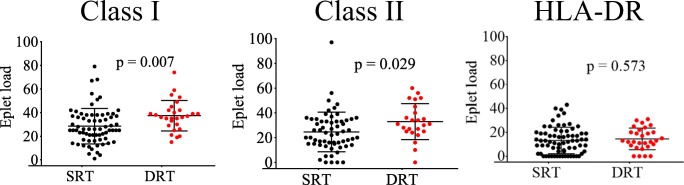
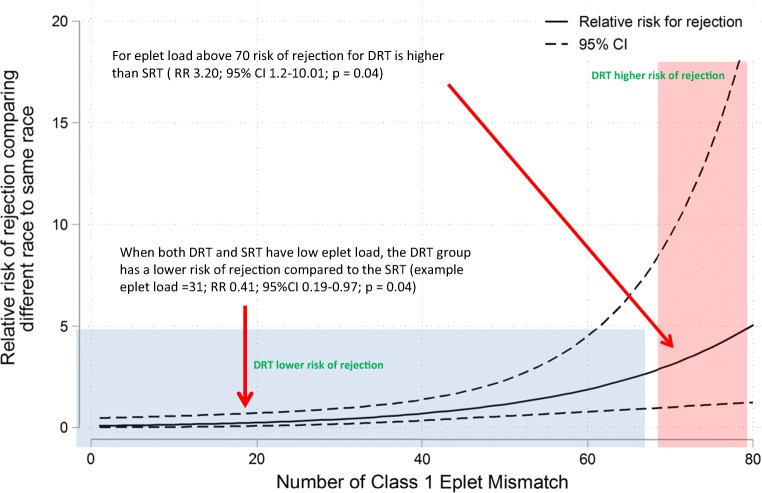
HLA eplet mismatch load has been suggested as an improvement to HLA antigen mismatch determination for organ selection. Given that eplet mismatches are determined based on amino acid sequence difference among HLA alleles, and that the frequency of HLA alleles varies between racial groups, we investigated the correlation between eplet mismatch load and allograft outcomes in 110 pediatric kidney transplant recipients who received their first organ from a donor of the same race (SRT) versus a donor of a different race (DRT). Adjusted modified Poisson regression was used to assess the interaction between eplet mismatch load and race mismatch and its effect on outcome. Caucasians and living donor recipients had lower eplet mismatched loads against their donors compared with non-Caucasian and deceased donor recipients. Overall, for the entire population, the risk of de novo HLA-DSA development was significantly increased with higher eplet loads (p < 0.001). Compared with the SRT group, the DRT group had higher eplet loads when compared with their donor, for HLA class I but not HLA class II molecules; however, there was no significant difference in the incidence of de novo HLA-DSA between the 2 groups. The risk of rejection increased significantly for DRT compared with SRT, only when class I eplet load was ≥ 70 (p = 0.04). Together this data show that eplet mismatch load analysis is an effective tool for alloimmune risk assessment. If considered for donor selection, acceptable eplet mismatch loads determined from studies in homogenous populations may restrict transplantation across racially diverse donor and patient groups with no evidence of poor outcome. Therefore, an acceptable eplet mismatch load threshold must consider the heterogeneity of the transplant population.
Keywords: Donor; Eplet; Recipient.
Conflict of interest statement
The authors declare that they have no conflict of interest.
Figures

References
-
- Groothoff JW, Offringa M, Grootenhuis M, Jager KJ. Long-term consequences of renal insufficiency in children: lessons learned from the Dutch LERIC study. Nephrol Dial Transplant. 2018;33(4):552–560. - PubMed
-
- Kilicoglu AG, Bahali K, Canpolat N, Bilgic A, Mutlu C, Yalcin O, Pehlivan G, Sever L. Impact of end-stage renal disease on psychological status and quality of life. Pediatr Int. 2016;58(12):1316–1321. - PubMed
-
- Tjaden LA, Maurice-Stam H, Grootenhuis MA, Jager KJ, Groothoff JW. Impact of renal replacement therapy in childhood on long-term socioprofessional outcomes: a 30-year follow-up study. J Pediatr. 2016;171:189–95.e1–2. - PubMed
-
- Baluarte JH. Neurological complications of renal disease. Semin Pediatr Neurol. 2017;24(1):25–32. - PubMed
-
- Amaral S, Patzer RE, Kutner N, McClellan W. Racial disparities in access to pediatric kidney transplantation since share 35. J Am Soc Nephrol. 2012;23(6):1069–1077. - PubMed
Publication types
MeSH terms
Substances
LinkOut - more resources
Full Text Sources
Medical
Research Materials
Miscellaneous
