. 2019 Nov 15;30(24):2985-2995.
doi: 10.1091/mbc.E19-03-0171. Epub 2019 Oct 10.

Constitutive expression of a fluorescent protein reports the size of live human cells

Affiliations

Constitutive expression of a fluorescent protein reports the size of live human cells

Daniel F Berenson et al. Mol Biol Cell. .

Abstract

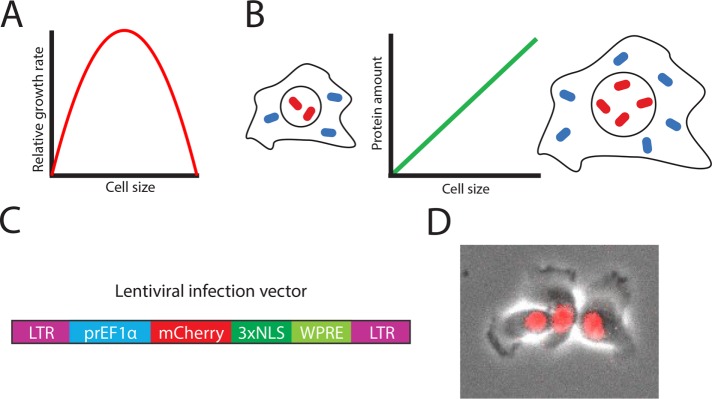
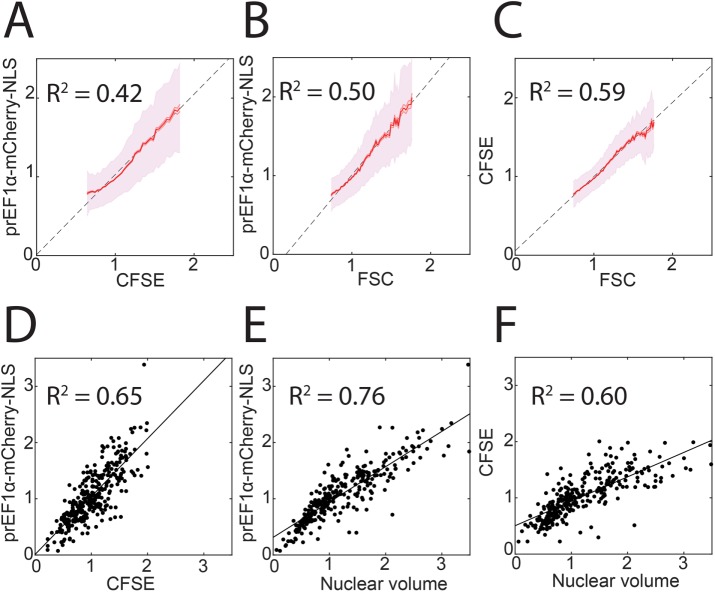
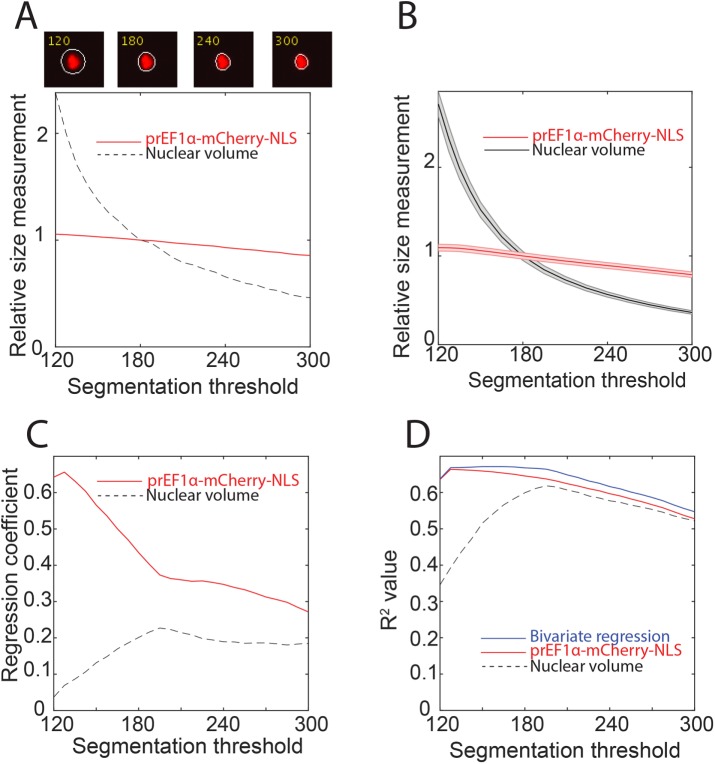
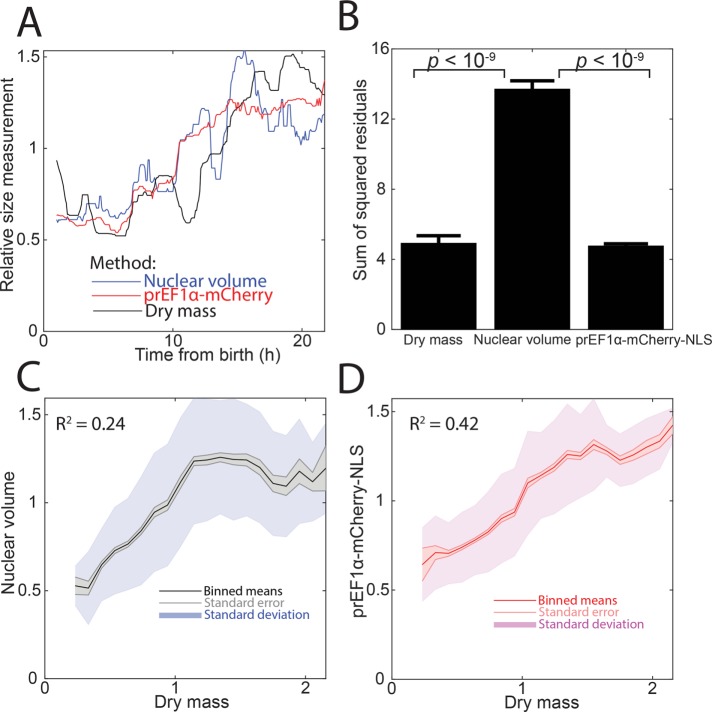
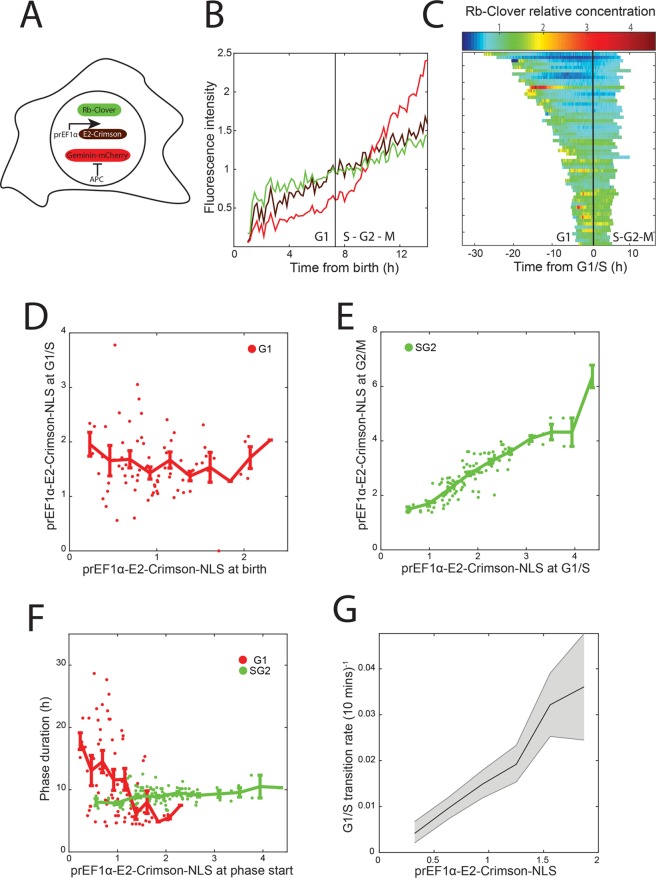
Cell size is important for cell physiology because it sets the geometric scale of organelles and biosynthesis. A number of methods exist to measure different aspects of cell size, but each has significant drawbacks. Here, we present an alternative method to measure the size of single human cells using a nuclear localized fluorescent protein expressed from a constitutive promoter. We validate this method by comparing it to several established cell size measurement strategies, including flow cytometry optical scatter, total protein dyes, and quantitative phase microscopy. We directly compare our fluorescent protein measurement with the commonly used measurement of nuclear volume and show that our measurements are more robust and less dependent on image segmentation. We apply our method to examine how cell size impacts the cell division cycle and reaffirm that there is a negative correlation between size at cell birth and G1 duration. Importantly, combining our size reporter with fluorescent labeling of a different protein in a different color channel allows measurement of concentration dynamics using simple wide-field fluorescence imaging. Thus, we expect our method will be of use to researchers interested in how dynamically changing protein concentrations control cell fates.


Figures

FIGURE 1:
FIGURE 1:
Measuring cell size using a constitutively expressed fluorescent protein. (A) Single-cell growth rate has an optimum as a function of cell size (Miettinen and Björklund, 2016). (B) Principle of size reporter: the amount of constitutively expressed proteins increases in proportion to cell size. (C) Schematic of the lentiviral infection vector. LTR denotes long terminal repeats, prEF1α denotes 1kb of the EF1α promoter, NLS denotes nuclear localization sequence, and WPRE denotes a woodchuck posttranscriptional regulatory element that boosts expression (Zufferey et al., 1999). (D) Representative composite phase and fluorescence image of HMEC cells expressing mCherry-NLS from an EF1α promoter.
FIGURE 2:
FIGURE 2:
Comparison of constitutively expressed fluorescent protein with other cell size metrics. (A–C) Binned means and standard deviations for prEF1α-mCherry-NLS, CFSE, and FSC as measured by flow cytometry. CFSE is a total protein dye and FSC is the optical forward scatter (see Materials and Methods). Each metric was normalized to its own median, and bins are shown for the middle 95% of the data. Least-squares regression lines and coefficients of determination are also shown. N > 30,000 cells. (D–F) Single-cell measurements made using wide-field fluorescence microscopy, least-squares linear regression, and coefficients of determination for the indicated metrics. N = 303 cells.
FIGURE 3:
FIGURE 3:
Sensitivity of nuclear volume and EF1α-mCherry-NLS to the segmentation threshold. (A) Top panels, a single nucleus segmented at four different intensity thresholds. Bottom panel, nuclear volume and total mCherry-NLS measurements for that cell at each threshold. Measurements were normalized to their value when the segmentation threshold is 180 (see Materials and Methods). (B) Mean and associated SE of nuclear volume and mCherry-NLS measurements for a cell population at different intensity thresholds. Measurements were normalized to the mean value when the segmentation threshold is 180. N = 379 cells. (C, D) Analysis of the correlation of nuclear volume and mCherry-NLS with CFSE total protein dye. Each measurement was normalized to its mean, and bivariate regression was performed using nuclear volume and mCherry-NLS as predictor variables, and using CFSE as the response variable. N = 303 cells. (C) Plot of the regression coefficient (i.e., slope) for each predictor variable as a function of segmentation threshold in a bivariate regression indicating that mCherry-NLS contributes more to predicting CFSE. (D) Plot of the coefficient of determination as a function of segmentation threshold for the bivariate regression alongside the coefficient of determination for each single variable regression.
FIGURE 4:
FIGURE 4:
Nuclear volume and mCherry-NLS size measurements for live single cells tracked through time. (A, B) Single-cell traces over time. Measurements were normalized to the mean of all the data. (C, D) Representative single-cell traces along with a piecewise fit to quantify timepoint-to-timepoint variability (see Materials and Methods). Each trace was normalized to its mean. (E) Plot of an error metric: the mean and SE of the sum of squared residuals from the piecewise linear fits to each cell as in C and D. (F) All individual single-cell, single-timepoint measurements of nuclear volume and mCherry-NLS were plotted and categorized as G1 or S/G2 according to the cell’s position in the cell cycle as determined by Geminin-mAG (see Materials and Methods).
FIGURE 5:
FIGURE 5:
Comparison of nuclear volume, mCherry-NLS, and dry mass measurements. Dry mass was measured by quantitative phase microscopy (see Materials and Methods). (A) Representative trace of a single cell tracked through time. Each measurement type was normalized to its median. (B) Plot of an error metric: the mean and SE of the sum of squared residuals from a piecewise linear fit, as in Figure 4, C and D. N = 8 cells. (C, D) Correlation of nuclear volume or mCherry-NLS with cell dry mass. Binned means, SE of the mean, and SD of the data are shown. N > 2000 measurements.
FIGURE 6:
FIGURE 6:
Analysis of the relationship between cell size and cell cycle progression. (A) Schematic of the three fluorescent reporters expressed in single cells. Rb-Clover fluorescent fusion protein was expressed from one of the two endogenous RB alleles. A Geminin-mCherry reporter was used to identify the G1/S transition (see Materials and Methods). (B) Representative trace of the three fluorescent reporters from cell birth to mitosis. Each measurement type was normalized to its mean. (C) Plot of Rb-Clover relative protein concentration (calculated as Rb-Clover amount divided by E2-Crimson-NLS amount). Cells were aligned at the time of their G1/S transitions. (D) Plot of the amount of E2-Crimson-NLS at birth vs. the amount at G1/S. Data were normalized to the mean amount of E2-Crimson-NLS at birth and are shown with binned means ± SE of the mean. (E) Plot of the amount of E2-Crimson-NLS at G1/S vs. the amount at G2/M. Data were normalized to the mean amount of E2-Crimson-NLS at birth and are shown with binned means ± SE of the mean. (F) Plot of the duration of G1 or S/G2 phases vs. E2-Crimson-NLS amount at birth or at G1/S, respectively. N = 77 and 122 cells for G1 and S/G2 durations, respectively. (G) Calculation of the rate at which cells stochastically pass the G1/S transition as a function of E2-Crimson-NLS amount (see Materials and Methods). The fraction of measurements in each E2-Crimson-NLS bin that correspond to a G1/S transition at that frame is shown, along with 5th and 95th percentile confidence intervals from bootstrap resampling of each bin 1000 times. Bins are shown for the middle 90% of size measurements and were normalized to the overall mean. N = 290 transition events from >18,000 measurements.

References

    1. Aknoun S, Savatier J, Bon P, Galland F, Abdeladim L, Wattellier B, Monneret S. (2015). Living cell dry mass measurement using quantitative phase imaging with quadriwave lateral shearing interferometry: an accuracy and sensitivity discussion. J Biomed Opt , 126009. - PubMed
    1. Atay O, Doncic A, Skotheim JM. (2016). Switch-like transitions insulate network motifs to modularize biological networks. Cell Syst , 121–132. - PMC - PubMed
    1. Bajcsy P, Simon MH, Florczyk SJ, Simon JG, Juba D, Brady MC. (2015). A method for the evaluation of thousands of automated 3D stem cell segmentations. J Microsc-Oxford , 363–376. - PMC - PubMed
    1. Barer R. (1952). Interference microscopy and mass determination. Nature , 169366b0. - PubMed
    1. Barr AR, Cooper S, Heldt FS, Butera F, Stoy H, Mansfeld J, Novák B, Bakal C. (2017). DNA damage during S-phase mediates the proliferation-quiescence decision in the subsequent G1 via p21 expression. Nat Commun , 14728. - PMC - PubMed

Publication types

Substances

LinkOut - more resources