. 2019 Nov 14;4(22):e131597.
doi: 10.1172/jci.insight.131597.

Transcriptional regulatory model of fibrosis progression in the human lung

Affiliations

Transcriptional regulatory model of fibrosis progression in the human lung

John E McDonough et al. JCI Insight. .

Abstract

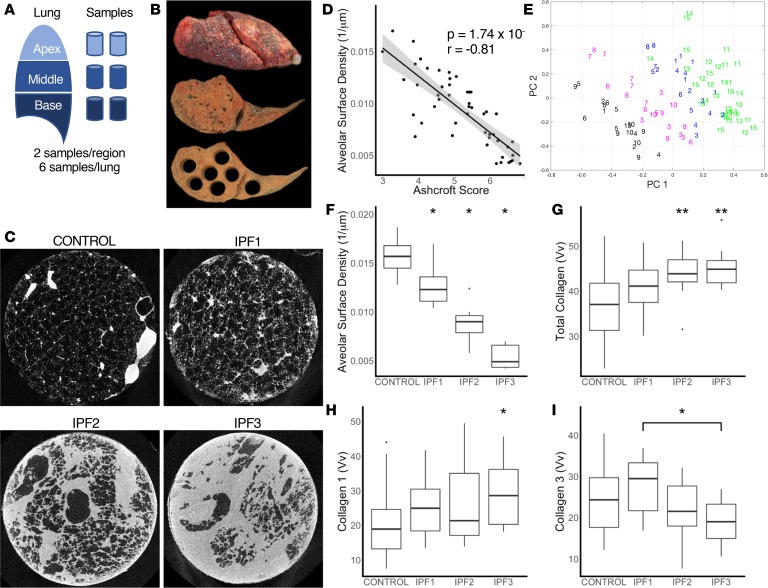
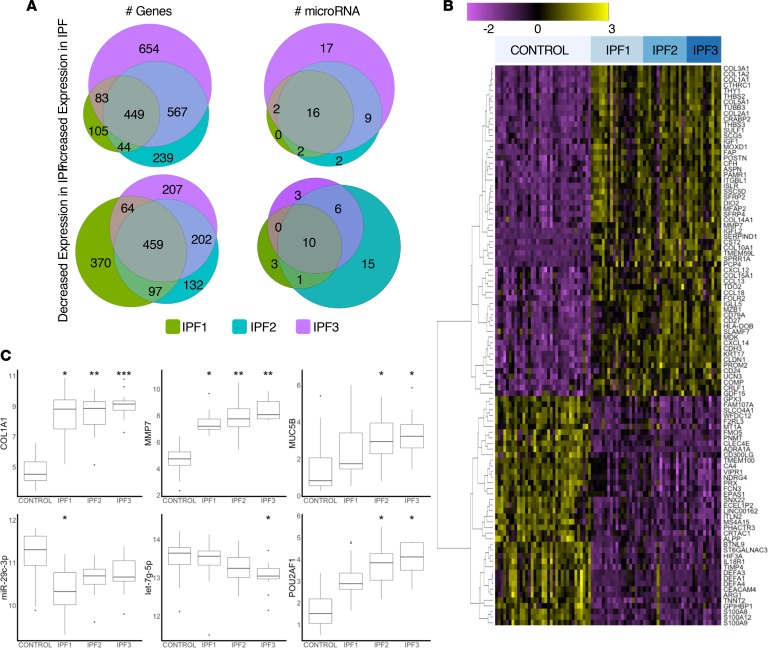
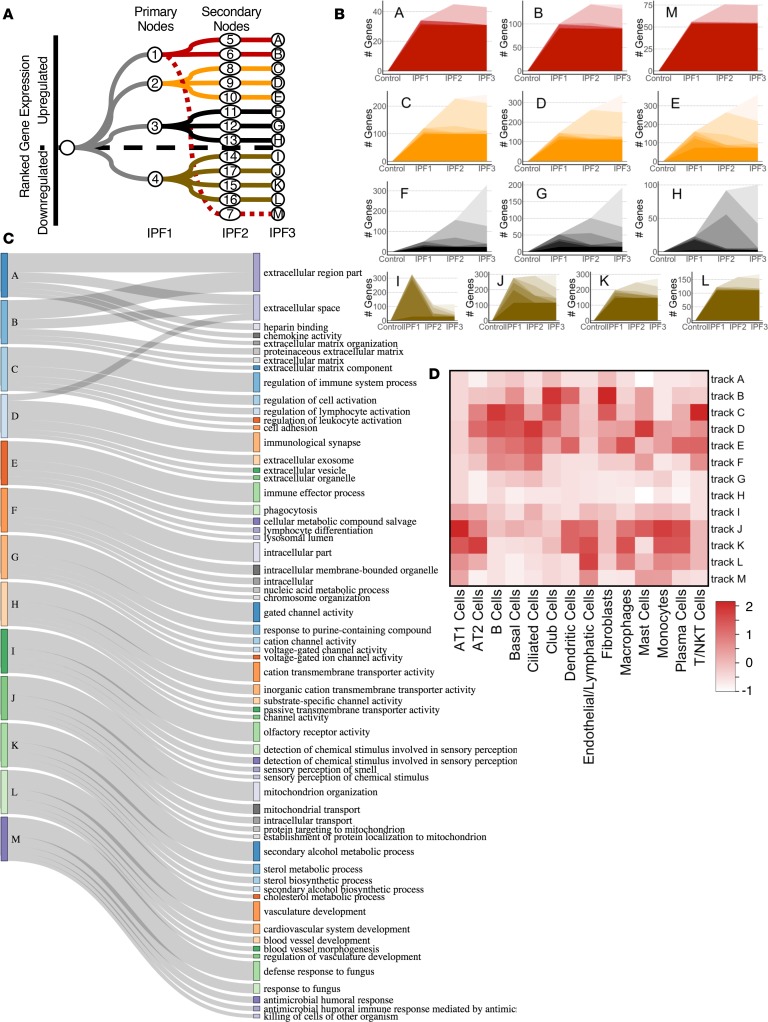
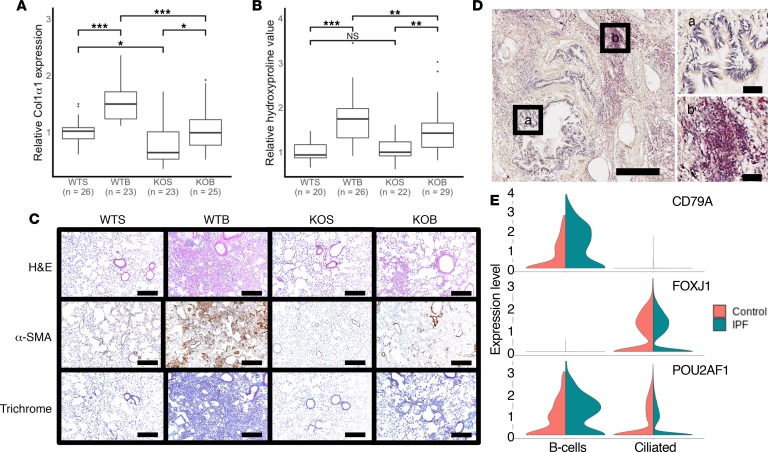
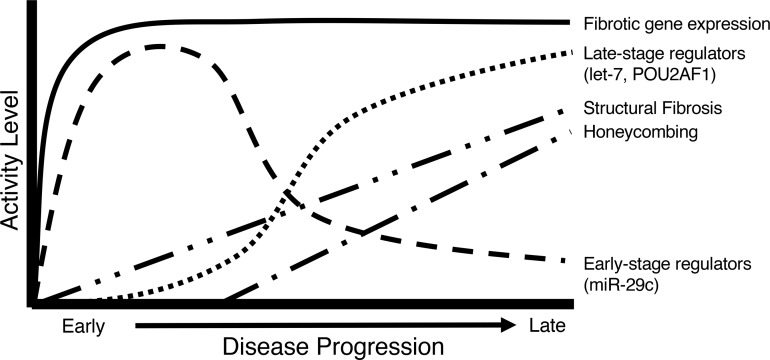
To develop a systems biology model of fibrosis progression within the human lung we performed RNA sequencing and microRNA analysis on 95 samples obtained from 10 idiopathic pulmonary fibrosis (IPF) and 6 control lungs. Extent of fibrosis in each sample was assessed by microCT-measured alveolar surface density (ASD) and confirmed by histology. Regulatory gene expression networks were identified using linear mixed-effect models and dynamic regulatory events miner (DREM). Differential gene expression analysis identified a core set of genes increased or decreased before fibrosis was histologically evident that continued to change with advanced fibrosis. DREM generated a systems biology model (www.sb.cs.cmu.edu/IPFReg) that identified progressively divergent gene expression tracks with microRNAs and transcription factors that specifically regulate mild or advanced fibrosis. We confirmed model predictions by demonstrating that expression of POU2AF1, previously unassociated with lung fibrosis but proposed by the model as regulator, is increased in B lymphocytes in IPF lungs and that POU2AF1-knockout mice were protected from bleomycin-induced lung fibrosis. Our results reveal distinct regulation of gene expression changes in IPF tissue that remained structurally normal compared with moderate or advanced fibrosis and suggest distinct regulatory mechanisms for each stage.

Keywords: Fibrosis; Pulmonology.


Conflict of interest statement

Conflict of interest: NK reports personal fees from Biogen Idec, Boehringer Ingelheim, Third Rock, Miragen, Pliant, Samumed, NuMedii, Indaloo, Theravance, LifeMax, Optikira, and Three Lake Partners; in addition, NK has patents (9913819, 20180101642, 10036069) on New Therapies in Pulmonary Fibrosis Peripheral Blood Gene Expression in IPF.

Figures

Figure 1
Figure 1. Sampling of the lung.
(A) Schematic for sampling of the lung. (B) Image of the inflated whole IPF lung with a slice taken before and after sampling. (C) Representative microCT images of a control sample and for each stage of IPF. (D) A significant negative correlation (r = –0.81, P = 1.74 × 10⁻¹²) was found between alveolar surface density (ASD) compared with Ashcroft scores. Gray area represents the 95% confidence interval. (E) Principal component and expectation-maximization clustering separated samples into control (green) and early-stage (IPF1; blue), progressive (IPF2; magenta), and end-stage (IPF3; black) IPF. Each subject is identified by number (IPF: 1–10; control: 11–16). (F) ASD was significantly reduced in IPF stages compared with control but a large overlap remained between IPF1 and control. (G) Volume fraction (Vv) of total collagen was significantly increased in IPF2 and IPF3 stages compared with control. (H) Collagen 1 Vv was significantly increased in IPF3 compared with controls. (I) Collagen 3 Vv showed no difference compared to control but a significant decrease in IPF1 compared with IPF3. For panels F–I, data are presented as box plots showing median and interquartile ranges for each group compared using linear mixed-effects models. *P < 0.05; **P < 0.001.
Figure 2
Figure 2. Expression of genes and regulators.
(A) Euler diagrams showing the number of upregulated or downregulated genes or microRNAs at each stage of IPF. (B) Heatmap of the 100 genes with the greatest increased or decreased expression in all stages of IPF. (C) Box plots for expression of key genes and regulators showing median and interquartile ranges for each group compared using linear mixed-effects models. *P < 0.05, **P < 0.001, ***P < 0.0001 versus control.
Figure 3
Figure 3. DREM tracks at each stage of IPF.
(A) Flow diagram showing the 4 primary tracks established in IPF1 which split into 13 secondary tracks in the IPF2 stage. Numbers denote regulatory node for that junction where regulators and gene expression diverge. Letters denote track name. (B) Number of differentially expressed genes for each track at each stage of IPF. (C) Sankey diagram of biological function terms identified for each DREM track. (D) Heatmap of enriched genes between DREM tracks and a published IPF single-cell gene marker list scaled to the number of genes per cell type (40).
Figure 4
Figure 4. Pou2af1–/– mice show less fibrotic severity in bleomycin-induced lung fibrosis.
(A) qRT-PCR analysis of relative change in collagen type I, α1 (Col1α1) mRNA levels in wild-type (Pou2af1+/+) and Pou2af1–/– mice on day 14 after treatment with saline or bleomycin. Data are presented as box plots showing median and interquartile ranges for each group, with groups compared using linear mixed-effects models. Wild-type saline (WTS) n = 26; wild-type bleomycin (WTB) n = 23; Pou2af1-knockout saline (KOS) n = 23; and Pou2af1-knockout bleomycin (KOB) n = 25. (B) Relative collagen deposition assessed by hydroxyproline content per right lung in wild-type (Pou2af1+/+) and Pou2af1–/– mice as indicated by treatment groups. Data are shown as box plots with median and interquartile ranges and compared using linear mixed-effect models. WTS n = 20; WTB n = 26; KOS n = 22; and KOB n = 29. (C) H&E staining (upper panels), α-SMA (middle panels), and Masson’s trichrome (lower panels) staining of representative lung sections (n = 2 per group). Scale bars: 200 μm. (D) POU2AF1 immunostaining (red) in human IPF lung tissue showed no staining in bronchial epithelium (a) but lymphocytic aggregates (b) were positive. Scale bars: 400 μm (left) or 50 μm (right 2 images). (E) Violin plots from single-cell RNA-sequencing data of control (orange) and IPF (green) lung tissues showing specific cell types expressing POU2AF1. Upper panel shows CD79 expression identifying the B cell population, middle panel shows FOXJ1 expression identifying the ciliated epithelial cell population. POU2AF1 (bottom panel) was highly expressed in CD79 expressing B cells with some expression in ciliated epithelium (FOXJ1). In IPF, POU2AF1 showed increased expression in B cells and a slight reduction of expression in the ciliated cells. *P < 0.05, **P < 0.001, ***P < 0.0001, ns = no significance.
Figure 5
Figure 5. A model of fibrotic activity in IPF.

References

    1. Kim DS, Collard HR, King TE. Classification and natural history of the idiopathic interstitial pneumonias. Proc Am Thorac Soc. 2006;3(4):285–292. doi: 10.1513/pats.200601-005TK. - DOI - PMC - PubMed
    1. Lederer DJ, Martinez FJ. Idiopathic pulmonary fibrosis. N Engl J Med. 2018;378(19):1811–1823. doi: 10.1056/NEJMra1705751. - DOI - PubMed
    1. Lynch DA, et al. Diagnostic criteria for idiopathic pulmonary fibrosis: a Fleischner Society White Paper. Lancet Respir Med. 2018;6(2):138–153. doi: 10.1016/S2213-2600(17)30433-2. - DOI - PubMed
    1. Scadding JG, Hinson KF. Diffuse fibrosing alveolitis (diffuse interstitial fibrosis of the lungs). Correlation of histology at biopsy with prognosis. Thorax. 1967;22(4):291–304. doi: 10.1136/thx.22.4.291. - DOI - PMC - PubMed
    1. Crystal RG, Bitterman PB, Rennard SI, Hance AJ, Keogh BA. Interstitial lung diseases of unknown cause. Disorders characterized by chronic inflammation of the lower respiratory tract (first of two parts) N Engl J Med. 1984;310(3):154–166. doi: 10.1056/NEJM198401193100304. - DOI - PubMed

Publication types

MeSH terms