

Pathogen surveillance in the informal settlement, Kibera, Kenya, using a metagenomics approach
- PMID: 31600207
- PMCID: PMC6786639
- DOI: 10.1371/journal.pone.0222531
Pathogen surveillance in the informal settlement, Kibera, Kenya, using a metagenomics approach
Abstract
Background: Worldwide, the number of emerging and re-emerging infectious diseases is increasing, highlighting the importance of global disease pathogen surveillance. Traditional population-based methods may fail to capture important events, particularly in settings with limited access to health care, such as urban informal settlements. In such environments, a mixture of surface water runoff and human feces containing pathogenic microorganisms could be used as a surveillance surrogate.
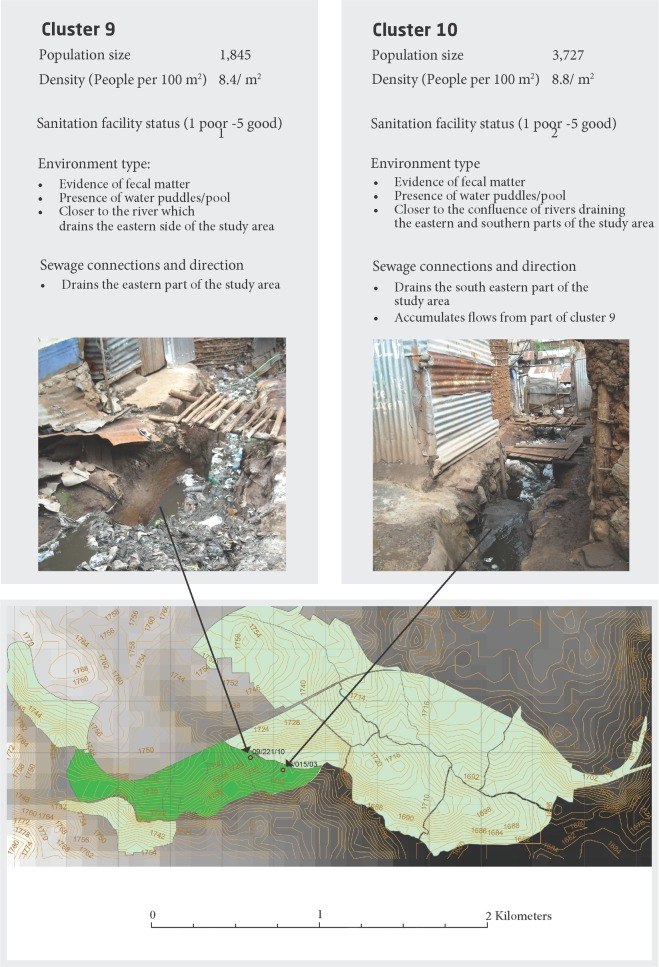
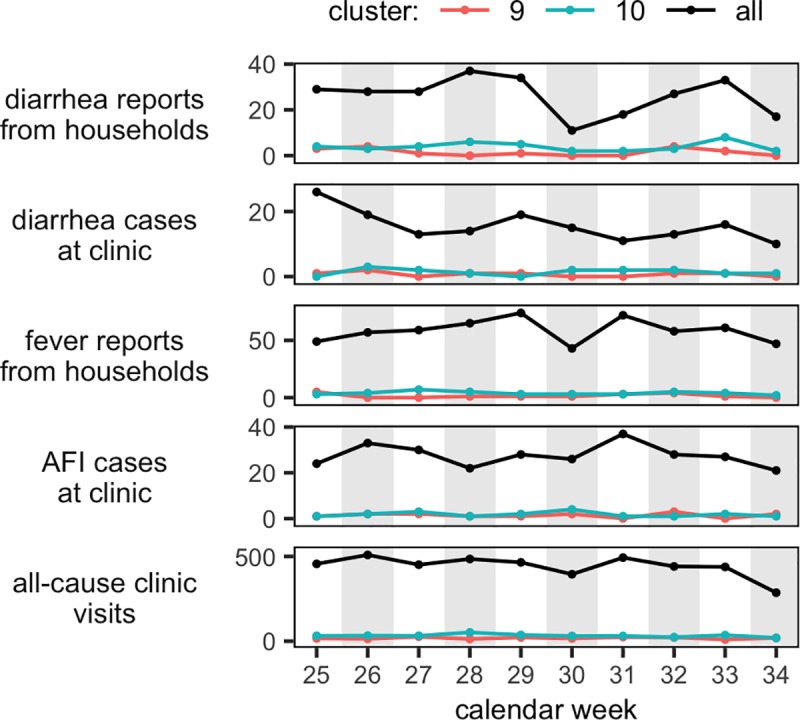
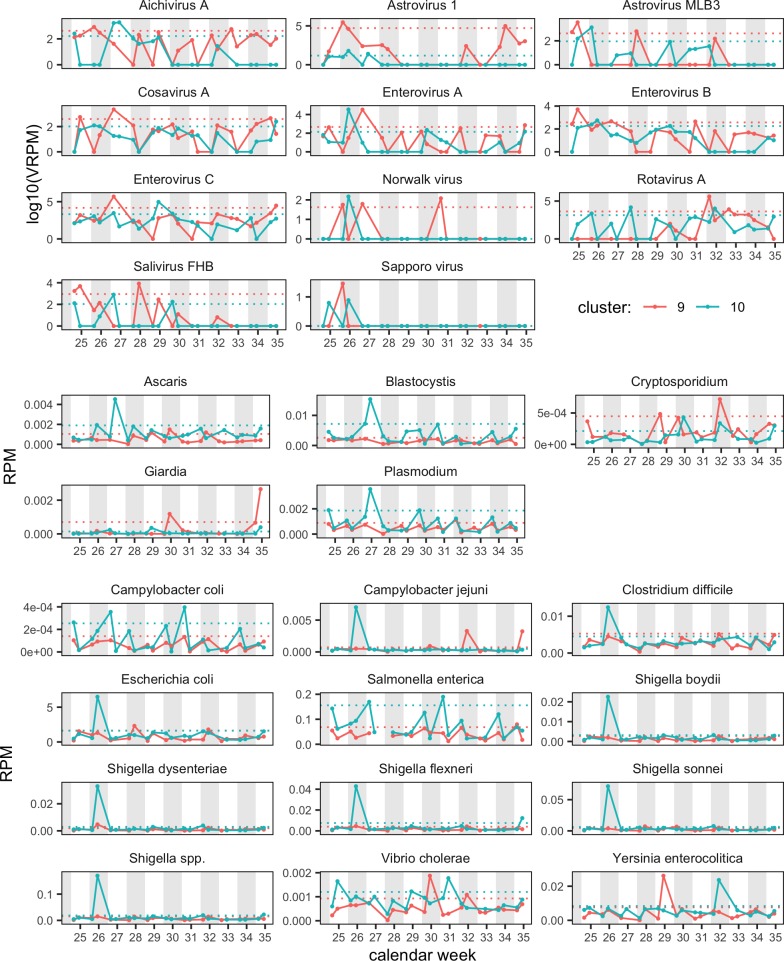
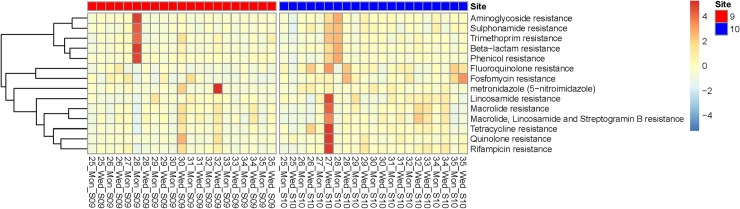
Method: We conducted a temporal metagenomic analysis of urban sewage from Kibera, an urban informal settlement in Nairobi, Kenya, to detect and quantify bacterial and associated antimicrobial resistance (AMR) determinants, viral and parasitic pathogens. Data were examined in conjunction with data from ongoing clinical infectious disease surveillance.
Results: A large variation of read abundances related to bacteria, viruses, and parasites of medical importance, as well as bacterial associated antimicrobial resistance genes over time were detected. Significant increased abundances were observed for a number of bacterial pathogens coinciding with higher abundances of AMR genes. Vibrio cholerae as well as rotavirus A, among other virus peaked in several weeks during the study period whereas Cryptosporidium spp. and Giardia spp, varied more over time.
Conclusion: The metagenomic surveillance approach for monitoring circulating pathogens in sewage was able to detect putative pathogen and resistance loads in an urban informal settlement. Thus, valuable if generated in real time to serve as a comprehensive infectious disease agent surveillance system with the potential to guide disease prevention and treatment. The approach may lead to a paradigm shift in conducting real-time global genomics-based surveillance in settings with limited access to health care.
Conflict of interest statement
The authors have declared that no competing interests exist.
Figures
References
-
- Lozano R, Naghavi M, Foreman K, Lim S, Shibuya K, Aboyans V, et al. (2012) Global and regional mortality from 235 causes of death for 20 age groups in 1990 and 2010: a systematic analysis for the Global Burden of Disease Study 2010. Lancet 380: 2095–2128. 10.1016/S0140-6736(12)61728-0 - DOI - PMC - PubMed
-
- World Health Organization (2003) Guidelines for environmental surveillance of poliovirus circulation.
Publication types
MeSH terms
Substances
LinkOut - more resources
Full Text Sources
Medical
Miscellaneous
