. 2019 Oct 10;14(10):e0223583.
doi: 10.1371/journal.pone.0223583. eCollection 2019.

The contribution of linear perspective cues and texture gradients in the perceptual rescaling of stimuli inside a Ponzo illusion corridor

Affiliations

The contribution of linear perspective cues and texture gradients in the perceptual rescaling of stimuli inside a Ponzo illusion corridor

Gizem Y Yildiz et al. PLoS One. .

Abstract

We examined the influence of linear perspective cues and texture gradients in the perceptual rescaling of stimuli over a highly-salient Ponzo illusion of a corridor. We performed two experiments using the Method of Constant Stimuli where participants judged the size of one of two rings. In experiment 1, one ring was presented in the upper visual-field at the end of the corridor and the other in the lower visual-field at the front of the corridor. The perceived size of the top and bottom rings changed as a function of the availability of linear perspective and textures. In experiment 2, only one ring was presented either at the top or the bottom of the image. The perceived size of the top but not the bottom ring changed as a function of the availability of linear perspective and textures. In both experiments, the effects of the cues were additive. Perceptual rescaling was also stronger for the top compared to the bottom ring. Additional eye-tracking revealed that participants tended to gaze more in the upper than the lower visual-field. These findings indicate that top-down mechanisms provide an important contribution to the Ponzo illusion. Nonetheless, additional maximum likelihood estimation analyses revealed that linear perspective fulfilled a greater contribution in experiment 2, which is suggestive of a bottom-up mechanism. We conclude that both top-down and bottom-up mechanisms play important roles. However, the former seems to fulfil a more prominent role when both stimuli are presented in the image.


Conflict of interest statement

The authors have declared that no competing interests exist.

Figures

Fig 1
Fig 1. Ponzo illusion.
The figure provides an illustration of the Ponzo illusion in its classical configuration with two simple lines converging upwards and two horizontal lines in the centre that are identical in length but appear different.
Fig 2
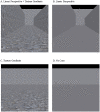
Fig 2. Background images in the present study.
A. Ponzo-like illusion display of a hallway with stones (textures) and walls (linear perspective cues). B. Ponzo-like illusion display of walls (linear perspective cues). C. Ponzo-like illusion display of a hallway with stones (texture gradients). D. Control background without depth cues.
Fig 3
Fig 3. Stimuli and procedures.
Illustration of stimuli and procedures that were used in the linear perspective + texture gradient background in experiments 1 and 2 (A-B and C-D, respectively). For the top standard ring block, the top standard ring was shown for 1 sec followed by an alerting sound cue that signalled the presentation of the bottom comparison ring (A and C for experiments 1 and 2, respectively). For the bottom standard ring block, the bottom standard ring was shown for 1 sec followed by an auditory alerting cue that signalled the presentation of the top comparison ring (B and D for experiments 1 and 2, respectively). In experiment 1, both the standard and comparison stimuli were presented over the same background image (A and B). In experiment 2, the comparison ring was presented outside of the background image within the grey area (C and D). The speaker symbols represent the presentation of the auditory alerting cue.
Fig 4
Fig 4. PSEs in experiment 1.
Asterisks (*) represent significant differences at p < .05 after Tukey’s HSD corrections were made for multiple comparisons. Daggers (†) represent significant differences from the physical size (100 pixels) of the standard ring at p < .05 after Bonferroni corrections were made for multiple comparisons. The horizontal dashed line denotes the physical size of the standard ring. PSEs were computed from psychometric functions that best fit the data. Error bars represent the standard errors around the mean for within subjects contrasts. These error bars were calculated using procedures described by O’Brien and Cousineau [33].
Fig 5
Fig 5. Fixation durations in experiment 1.
Fixation durations are the total amount of time participants gazed at an AOI across all trials for a particular condition. The asterisk (*) represents a significant difference at p < .05 after a Tukey’s HSD correction was made for multiple comparisons. Error bars represent the standard errors around the mean for within subjects contrasts. These error bars were calculated using procedures described by O’Brien and Cousineau [33].
Fig 6
Fig 6. PSEs in experiment 2.
Asterisks (*) represent significant differences at p < .05 after Tukey’s HSD corrections were made for multiple comparisons. Daggers (†) represent significant differences from the physical size (100 pixels) of the standard ring at p < .05 after Bonferroni corrections were made for multiple comparisons. The horizontal dashed line denotes the physical size of the standard ring. PSEs were computed from psychometric functions that best fit the data. Error bars represent standard errors around the mean for within-subjects contrasts. These error bars were calculated using procedures described by O’Brien and Cousineau [33].
Fig 7
Fig 7. Fixation durations in experiment 2.
Fixation durations are the total amount of time participants gazed at an AOI across all trials for a particular condition. The asterisks (*) represent significant differences at p < .05 after Tukey’s HSD corrections were made for multiple comparisons. Error bars represent standard errors around the mean for within subjects contrasts. These error bars were calculated using procedures described by O’Brien and Cousineau [33].

References

    1. Epstein W. Percept-percept couplings. Perception. 1982;11(1):75–83. 10.1068/p110075 - DOI - PubMed
    1. Gregory RL. Perceptual illusions and brain models. Proc R Soc Lond B Biol Sci. 1968;171(1024):279–96. 10.1098/rspb.1968.0071 - DOI - PubMed
    1. Sperandio I, Chouinard PA. The Mechanisms of Size Constancy. Multisens Res. 2015;28(3–4):253–83. - PubMed
    1. Cutting JE, Vishton PM. Perceiving layout: The integration, relative dominance, and contextual use of different information about depth In: Epstein W, Rogers S, editors. Handbook of Perception and Cognition. 5 NY: Academic Press; 1995. pp. 69–117.
    1. Gregory RL. Eye and brain: the psychology of seeing. 5th ed Oxford; New York: Oxford University Press; 1998. pp. 277–80.

Publication types