. 2019 Nov/Dec;134(6):634-642.
doi: 10.1177/0033354919878158. Epub 2019 Oct 10.

Black and White Differences in Life Expectancy in 4 US States, 1969-2013

Affiliations

Black and White Differences in Life Expectancy in 4 US States, 1969-2013

Jay S Kaufman et al. Public Health Rep. 2019 Nov/Dec.

Abstract

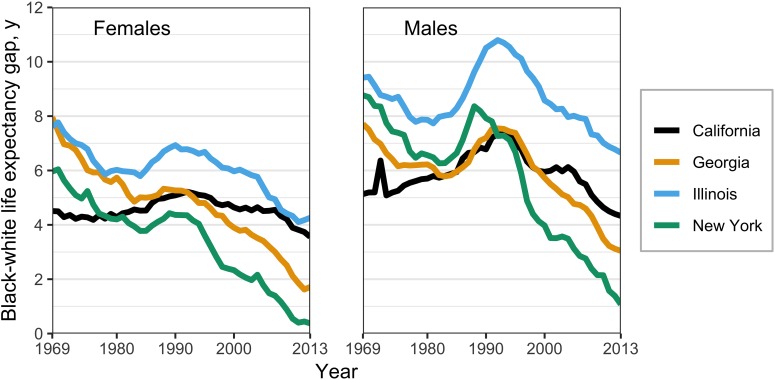
Objectives: Racial differences in mortality in the United States have narrowed and vary by time and place. The objectives of our study were to (1) examine the gap in life expectancy between white and black persons (hereinafter, racial gap in life expectancy) in 4 states (California, Georgia, Illinois, and New York) and (2) estimate trends in the contribution of major causes of death (CODs) to the racial gap in life expectancy by age group.

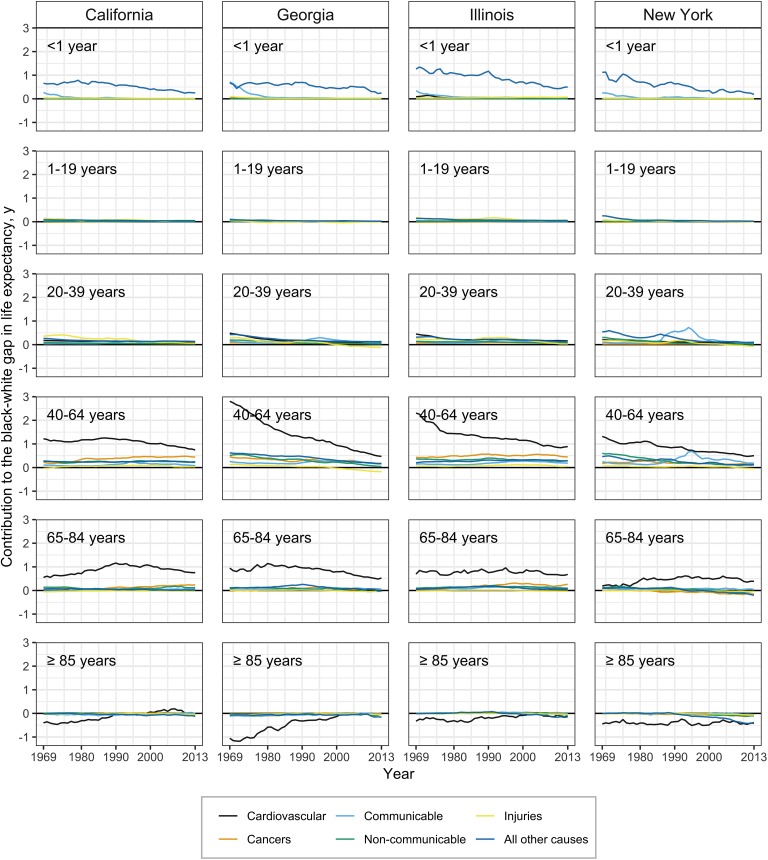
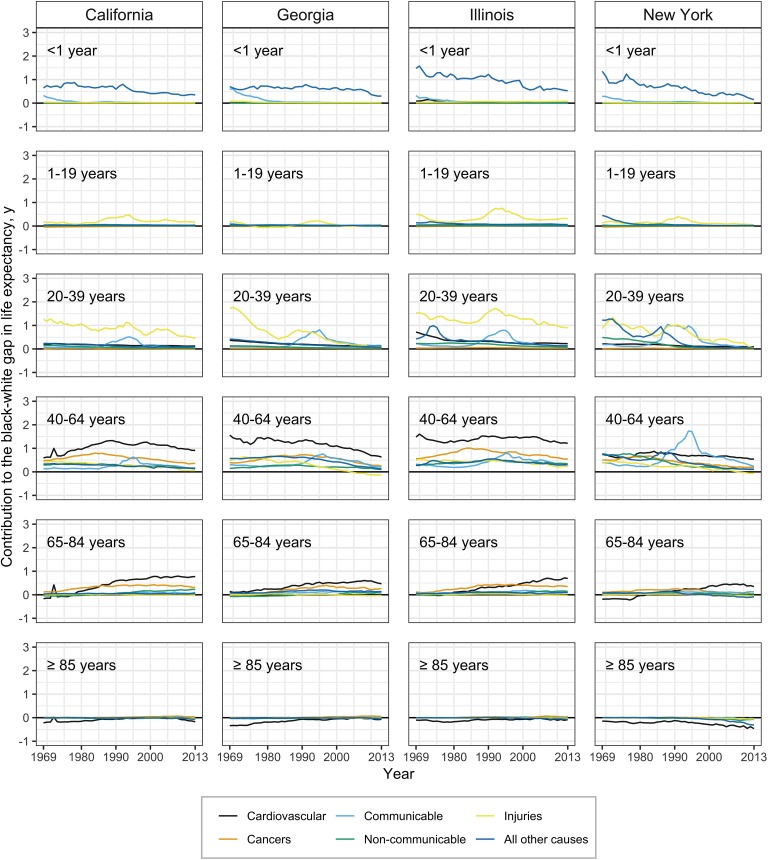
Methods: We extracted data on the number of deaths and population sizes for 1969-2013 by state, sex, race, age group, and 6 major CODs. We used a Bayesian time-series model to smooth and impute mortality rates and decomposition methods to estimate trends in sex- and age-specific contributions of CODs to the racial gap in life expectancy.

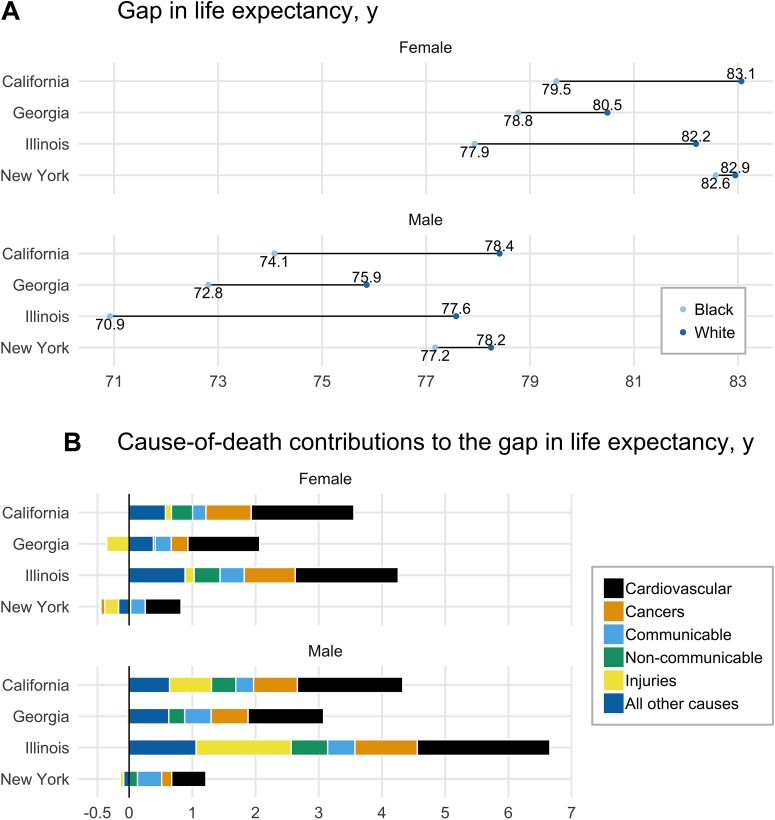
Results: The racial gap in life expectancy at birth decreased in all 4 states, especially among men in New York (from 8.8 to 1.1 years) and women in Georgia (from 8.0 to 1.7 years). Although few deaths occurred among persons aged 1-39, racial differences in mortality at these ages (mostly from injuries and infant mortality) contributed to the racial gap in life expectancy, especially among men in California (1.0 year of the 4.3-year difference in 2013) and Illinois (1.9 years of the 6.7-year difference in 2013). Cardiovascular deaths contributed most to the racial gap in life expectancy for adults aged 40-64, but contributions decreased among women aged 40-64, especially in Georgia (from 2.8 to 0.5 years). The contribution of cancer deaths to inequality increased in California and Illinois, whereas New York had the greatest reductions in inequality attributable to cancer deaths (from 0.6 to 0.2 years among men and from 0.2 to 0 years among women).

Conclusions: Future research should identify policy innovations and economic changes at the state level to better understand New York's success, which may help other states emulate its performance.

Keywords: inequality; mortality; race.


Conflict of interest statement

Declaration of Conflicting Interests: The authors declared no potential conflicts of interest with respect to the research, authorship, and/or publication of this article.

Figures

Figure 1.
Figure 1.
Gaps in life expectancy from birth between black and white persons in 4 US states, by sex, 1969-2013. The peak in California’s trend line in 1972 for men resulted from a low number of deaths due to cardiovascular disease among white men, which resulted from a coding error in the cause-of-death information in the vital statistics system; thus, caution should be taken in interpreting the gap in life expectancy between black and white men in California in 1972. Data source: Riddell et al.
Figure 2.
Figure 2.
Contribution of age and cause of death to gaps in life expectancy between black and white females in California, Georgia, Illinois, and New York, 1969-2013. Negative contributions indicate lower age-specific mortality rates among black women compared with white women for the specified cause. Data source: Riddell et al.
Figure 3.
Figure 3.
Contribution of age and cause of death to gaps in life expectancy among black and white males in California, Georgia, Illinois, and New York, 1969-2013. In New York, communicable diseases contributed approximately 2 years to the gap in life expectancy between black and white males in 1995 (during the HIV/AIDS epidemic) vs 0.75 years in Illinois at the same time. Negative contributions indicate lower age-specific mortality rates among black males compared with white males for the specified cause. The spike in the contribution of cardiovascular disease (CVD) to the gap in life expectancy between black and white males in 1972 resulted from a low number of CVD deaths to white men in that year, which was likely the result of a coding error in the cause-of-death information in the vital statistics system; thus, caution should be taken in interpreting California’s CVD estimate in 1972. Data source: Riddell et al.
Figure 4.
Figure 4.
Gaps in life expectancy between black and white males and black and white females and the contribution of major causes of death, California, Georgia, Illinois, and New York, 2013. In Panel B, causes to the right of the vertical black line contribute to widening the gaps in life expectancy between black and white persons and causes to the left contribute to narrowing the gap. The net effect of the cause-of-death contributions to the left and right of the vertical line equals the gap in life expectancy shown in Panel A.

References

    1. Hummer RA, Chinn JJ. Race/ethnicity and US adult mortality: progress, prospects, and new analyses. Du Bois Rev. 2011;8(1):5–24. doi:10.1017/S1742058X11000051 - PMC - PubMed
    1. Harper S, MacLehose RF, Kaufman JS. Trends in the black-white life expectancy gap among US states, 1990-2009. Health Aff (Millwood). 2014;33(8):1375–1382. doi:10.1377/hlthaff.2013.1273 - PubMed
    1. Bharmal N, Tseng CH, Kaplan R, Wong MD. State-level variations in racial disparities in life expectancy. Health Serv Res. 2012;47(1 pt 2):544–555. doi:10.1111/j.1475-6773.2011.01345.x - PMC - PubMed
    1. Murray CJ, Kulkarni SC, Michaud C, et al. Eight Americas: investigating mortality disparities across races, counties, and race-counties in the United States [published erratum appears in PLoS Med. 2006;3(12):e545]. PLoS Med. 2006;3(9):e260 doi:10.1371/journal.pmed.0030260 - PMC - PubMed
    1. Benjamins MR, Hirschtick JL, Hunt BR, Hughes MM, Hunter B. Racial disparities in heart disease mortality in the 50 largest U.S. cities. J Racial Ethn Health Disparities. 2017;4(5):967–975. doi:10.1007/s40615-016-0300-6 - PubMed

LinkOut - more resources