Review
. 2019 Oct 9;19(20):4353.
doi: 10.3390/s19204353.

Recent Progress in Wireless Sensors for Wearable Electronics

Affiliations
Review

Recent Progress in Wireless Sensors for Wearable Electronics

Young-Geun Park et al. Sensors (Basel). .

Abstract

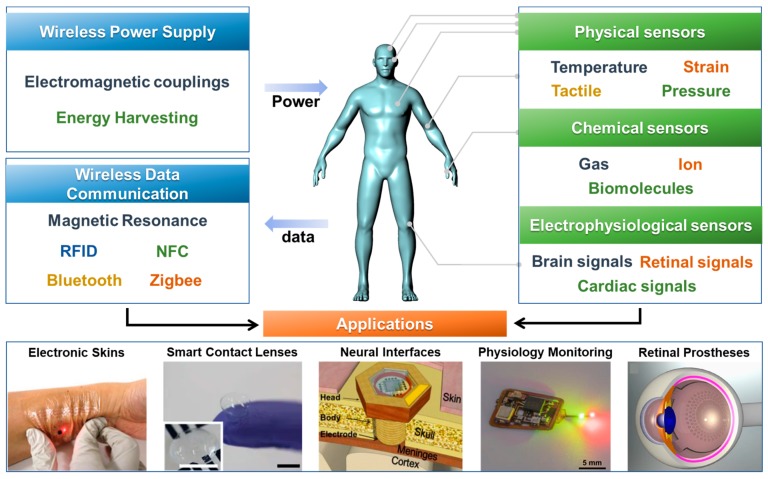
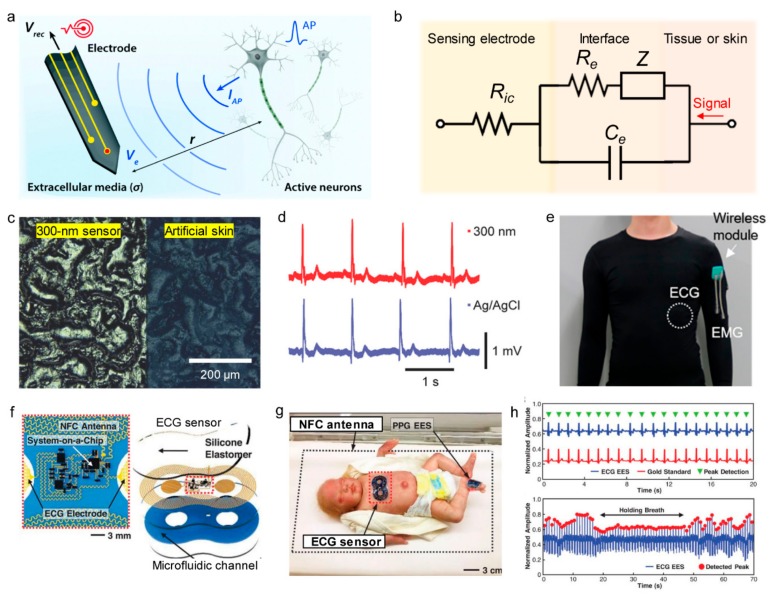
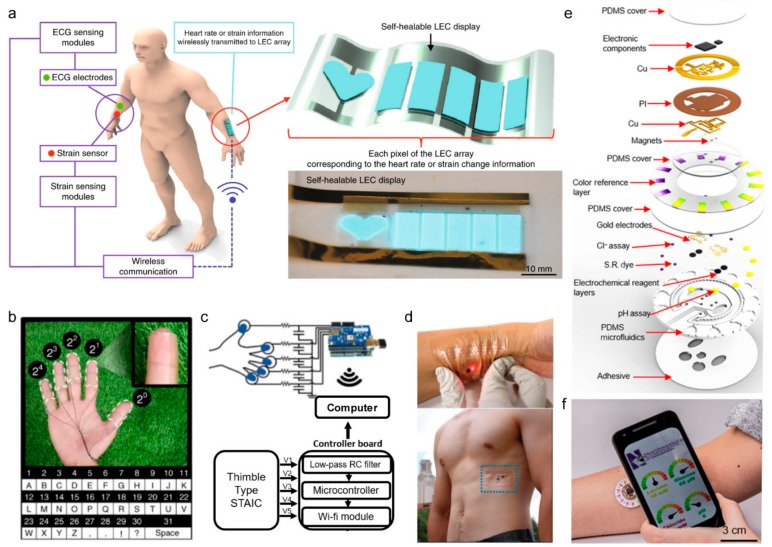
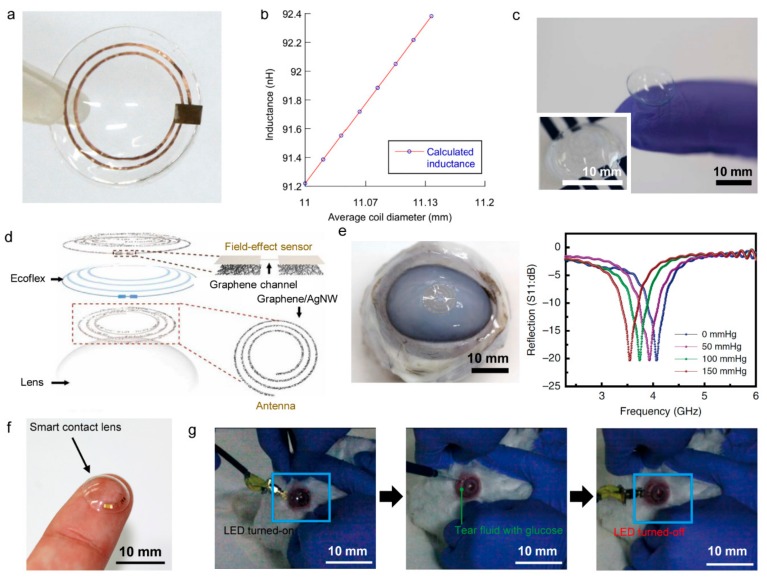
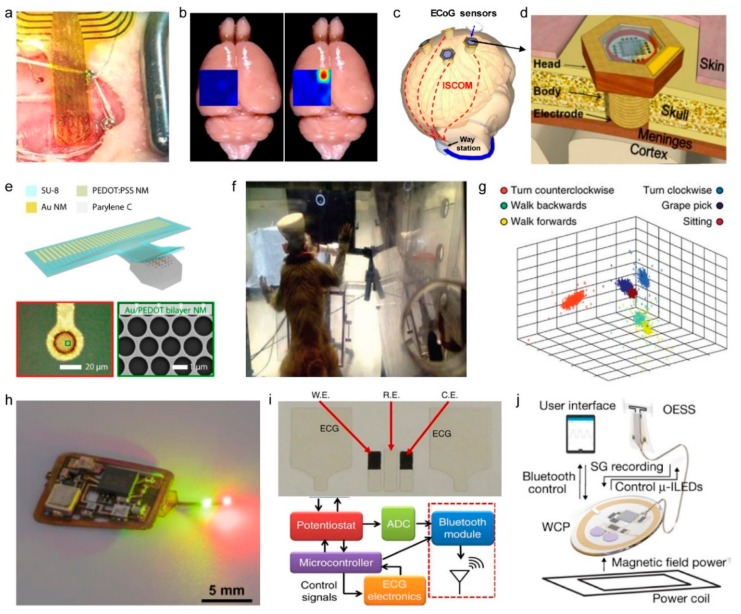
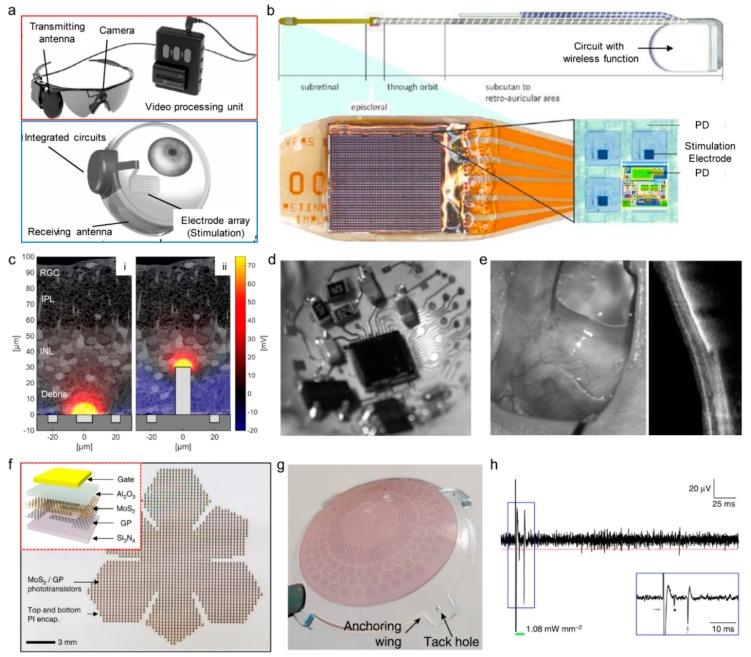
The development of wearable electronics has emphasized user-comfort, convenience, security, and improved medical functionality. Several previous research studies transformed various types of sensors into a wearable form to more closely monitor body signals and enable real-time, continuous sensing. In order to realize these wearable sensing platforms, it is essential to integrate wireless power supplies and data communication systems with the wearable sensors. This review article discusses recent progress in wireless technologies and various types of wearable sensors. Also, state-of-the-art research related to the application of wearable sensor systems with wireless functionality is discussed, including electronic skin, smart contact lenses, neural interfaces, and retinal prostheses. Current challenges and prospects of wireless sensor systems are discussed.

Keywords: electronic skins; neural interfaces; retinal prostheses; smart contact lenses; wearable electronics; wireless sensors.


Conflict of interest statement

The authors declare no conflict of interest.

Figures

Figure 1
Figure 1
Components in wireless, wearable sensor systems and their representative applications.
Figure 2
Figure 2
Wireless power supply technologies for wearable sensors. (a) Expanded view of the magnetic field in tissue multilayers, revealing propagating waves that converge on the coil (linear scale) (Reproduced with permission [24]). (b) Theoretical, numerically simulated, and measured power received by a 2-mm diameter coil as a function of distance when coupling 500 mW into the tissue (Reproduced with permission [24]). (c) Circuit diagram of wireless power receiver with voltage amplifier (Reproduced with permission [25]. Copyright 2015, John Wiley and Sons). (d) Resonant cavity powers a wireless device in a mouse on the surface of the cavity (Reproduced with permission [26]. Copyright 2015, Springer Nature). (e) Calculated light power density across the width of the behavioral area above the resonant cavity (Reproduced with permission [26]. Copyright 2015, Springer Nature). (f) Photograph of dual-antenna system configured for full-body readout on a mattress, with inset of a subject lying on top of a ~5-cm-thick pad that covers the antennas. Subject: 27 years of age, male, 90 kg (Reproduced with permission [27]. Copyright 2018, American Association for the Advancement of Science). (g) Block diagram of the electrical working principles. LDO, low-dropout regulator; µC, microcontroller (Reproduced with permission [28]. Copyright 2018, Springer Nature). (h) The optical output intensity of a regulated implant at 3 and 9 cm height in a single primary antenna (power 8 W in a 30 cm × 30 cm cage). a.u., arbitrary units (Reproduced with permission [28]. Copyright 2018, Springer Nature). (i) Electricity generation mechanism of the contact-separation TENG (Reproduced with permission [29]. Copyright 2019, Elsevier).
Figure 3
Figure 3
Physical sensors with wireless functions. (a) Top: photograph of AgNW/PI temperature sensor is attached to the skin near biceps. Bottom: temperature recorded by the temperature sensor and IR thermometer during biceps workout (Reproduced with permission [87]. Copyright 2019, American Chemical Society). (b) Illustration of a collection of thin, conformable skin-mounted sensors distributed across the body, with continuous, wireless transmission of temperature and pressure data in a time-multiplexed fashion. Inset: Top-view photograph of a representative sensor (Reproduced with permission [27]. Copyright 2018, The American Association for the Advancement of Science). (c) Exploded view schematic illustration of the device structure (Reproduced with permission [27]. Copyright 2018, The American Association for the Advancement of Science). (d) Post-operative monitoring of arterial pulsations after surgery (Reproduced with permission [44]. Copyright 2019, Springer Nature). (e) Sensing concept. The arterial pulsation results in a change in vessel diameter that is measured by the capacitive pulse sensor mounted around the artery. The change in capacitance results in a shift of the resonance frequency of the RLC circuit. This shift is measured wirelessly through the skin using an external reader coil (Reproduced with permission [44]. Copyright 2019, Springer Nature). (f) Schematic diagram of triboelectric nanogenerator (top). Schematic diagram of the working principle of self-powered ultrasensitive pulse sensor (bottom) (Reproduced with permission [88]. Copyright 2017, John Wiley and Sons). (g) Top: The optical image of bee wings on the pulse sensor, with the output performance driven by the bee wings (frequency, ≈ 200 Hz) display on the oscilloscope in real time. Bottom: The output voltage of the pulse sensor with the extremely high frequency of 10 kHz (Reproduced with permission [88]. Copyright 2017, John Wiley and Sons).
Figure 4
Figure 4
Chemical sensors with wireless functions. (a) Reagent layer of the chemically modified printed Prussian-Blue carbon working electrode containing uricase for SUA biosensor (Reproduced with permission [112]. Copyright 2015, Elsevier). (b) Real-time continuous monitoring according to the glucose concentrations (inset, calibration curves of the glucose sensor) (Reproduced under the terms of the CC BY-NC license [3]. Copyright 2018, the authors, The American Association for the Advancement of Science). (c) Potentiometric performance of the pH sensor (Reproduced with permission [115]. Copyright 2018, Elsevier). (d) schematic of the sensing element and wireless readout. A magnified illustration is binding of pathogenic bacteria by peptides self-assembled on the graphene nanotransducer (Reproduced with permission [116]. Copyright 2012, Springer Nature). (e) Schematic of broad-side coupled split-ring resonators with an interlayer of silk film or responsive hydrogel. Interlayers swell and absorb surrounding solvent (changing thickness and dielectric constant) and result in a change in resonant frequency and amplitude of the sensor. Inset: Trilayer sensor adhered to a human subject’s tooth for in vivo monitoring of ingested fluids (Reproduced with permission [18]. Copyright 2018, John Wiley and Sons). (f) Thin interlayer (≈ 1.2 µm) response on Subject 1 to various liquids. Changes to frequency and magnitude are seen in each case (Reproduced with permission [18]. Copyright 2018, John Wiley and Sons). (g) Schematic illustration of the transparent, flexible alcohol sensor integrated with a wireless antenna (Reproduced with permission [71]. Copyright 2018, Elsevier). (h) The experimental results (reflection value, S11) of the wireless sensor before and after exposure to the ethanol vapor of 95, 238, 476, 952 ppb (Reproduced with permission [71]. Copyright 2018, Elsevier). (i) Photograph of an NFC tag modified with printed PTS-PAni (Reproduced with permission [117]. Copyright 2018, American Chemical Society). (j) The circuit of the modified NFC tag. The amine gas released from spoiled meat dedopes PTS-PAni and increases the resistance of the device and thus switches the readability of the NFC tag (Reproduced with permission [117]. Copyright 2018, American Chemical Society).
Figure 5
Figure 5
Electrophysiological sensors with wireless functions. (a) Schematic overview of bioelectronic recording. Upon firing of APs, electrically active neurons inject charges into extracellular media with the corresponding extracellular potential and local field potential. The resultant potential Ve within electrolytic tissue media applied on the electrolyte-electrode interface is transmitted via electronic interconnects and recorded as the output signal, Vrec (Reproduced under the terms of CC BY-NC license [129]. Copyrights 2019, Royal Society of Chemistry). (b) Equivalent circuit diagram of the interface (Randles circuit) between the sensing electrodes and the biological system. (c) Optical image of 300 nm dry, thin-film electrode laminated on artificial skin. The right side of the image shows the bare artificial skin, while the left side shows the laminated sensor (Reproduced with permission [130]. Copyright 2018, John Wiley and Sons). (d) A series of ECG spikes measured with 300 nm thin film (top, red), and wet adhesive Ag/AgCl gel (bottom, blue) sensors (Reproduced with permission [130]. Copyright 2018, John Wiley and Sons). (e) Multimodal sensing suit composed of EMG and ECG sensors with wireless transmission module for long-term continuous monitoring of physiological activities (Reproduced with permission [131]. Copyright 2019, American Chemical Society). (f) Schematic illustration of wireless, battery-free modules for recording ECG data. The ionic liquid in the microfluidic channel contains blue dye for visualization purposes (Reproduced under the terms of CC BY license [132]. Copyright 2019, the authors, American Association for the Advancement of Science). (g) neonatal intensive care unit setting with a binodal (chest and foot) deployment of skin-like wireless devices designed to provide the same functionality and measurement fidelity (Reproduced under the terms of CC BY license [132]. Copyright 2019, the authors, American Association for the Advancement of Science). (h) Top: ECG signals acquired simultaneously from an ECG sensor (blue) and a gold standard (red), with detected peaks (green). Bottom: Respiration rate extracted from oscillations of the amplitudes of peaks extracted from the ECG waveforms (Reproduced under the terms of CC BY license [132]. Copyright 2019, the authors, American Association for the Advancement of Science).
Figure 6
Figure 6
Electronic skins. (a) Overview of the system with sensors wirelessly communicating values to the display (Reproduced with permission [137]. Copyright 2018, Springer Nature). (b) Self-cleanable, transparent, and attachable ionic communicators were attached on the fingers and connected with wires to a controller board. A different order of a binary system was assigned to each finger, and the letters were pre-coded in the microcontroller (Reproduced with permission [138] Copyright 2018, Springer Nature). (c) Block diagram of the communicator based on STAICs. STAICs were connected to a controller board which contains an RC low-pass filter, a microcontroller, and a Wi-Fi module (Reproduced with permission [138] Copyright 2018, Springer Nature). (d) Top: A photo of the assembled ECG e-tattoo. Photos of a wireless e-tattoo with LED worn on the skin powered by a wireless NFC reader concealed beneath the white paper: compressed. Bottom: A picture of the battery-free ECG e-tattoo applied at the lower rib cage of a male subject (Reproduced with permission [53]. Copyright 2019, John Wiley and Sons). (e) Schematic illustrating the exploded view of the complete hybrid battery-free system. PI, polyimide; S.R., sweat rate (Reproduced under the terms of the CC BY-NC license [139]. Copyright 2019, the authors, published by The American Association for the Advancement of Science). (f) A phone interface that illustrates wireless communication and image acquisition (Reproduced under the terms of the CC BY-NC license [139]. Copyright 2019, the authors, published by The American Association for the Advancement of Science).
Figure 7
Figure 7
Smart contact lenses. (a) The contact lens sensor with sensing elements embedded in a silicone rubber contact lens (Reproduced with permission [140]. Copyright 2014, Elsevier). (b) The inductance of the coil as a linear function of the average coil diameter (Reproduced with permission [140]. Copyright 2014, Elsevier). (c) A photograph of the contact lens sensor. Scale bar, 1 cm. (Inset: a close-up image of the antenna on the contact lens (Reproduced under the terms of the CC BY license [45]. Copyright 2017, Springer Nature). (d) Schematic of the wearable contact lens sensor, integrating the glucose sensor and intraocular pressure sensor (Reproduced under the terms of the CC BY license [45]. Copyright 2017, Springer Nature). (e) Photographs of the sensor transferred onto the contact lens worn by a bovine eyeball (Left). Wireless recording of the reflection coefficients at different pressures (Right) (Reproduced under the terms of the CC BY license [45]. Copyright 2017, Springer Nature). (f) Photograph of the fabricated soft, smart contact lens (Reproduced under the terms of the CC BY-NC license [3]. Copyright 2018, the authors, American Association for the Advancement of Science). (g) Photographs of the in vivo test on a live rabbit using the soft, smart contact lens. Left: Turn-on state of the LED in the soft, smart contact lens mounted on the rabbit’s eye. Middle: Injection of tear fluids with a glucose concentration of 0.9 mM. Right: Turn-off state of the LED after detecting the increased glucose concentration (Reproduced under the terms of the CC BY-NC license [3]. Copyright 2018, the authors, American Association for the Advancement of Science).
Figure 8
Figure 8
Neural interfaces (a−g) and physiological monitoring devices (h−j). (a) Implanted flexible ECoG electrode. A photo of the flexible electrode array placed on the left hemisphere of the brain of a Sprague-Dawley rat (Reproduced under the terms of CC BY license [141]. Copyrights 2017, the authors, Springer Nature). (b) Mappings of ECoG signal amplitudes from a rat brain under normal state and epilepsy state. The red area has the highest amplitude, i.e. most active under epilepsy (Reproduced under the terms of CC BY license [141]. Copyrights 2017, the authors, Springer Nature). (c) Schematic illustration of distributed wireless ECoG recording systems with intra-skin communication (ISCOM) (Reproduced under the terms of CC BY license [171]. Copyright 2018, MDPI AG. e) Reproduced under the terms of CC BY-NC license [144]. Copyright 2018, the authors, American Association for the Advancement of Science). (d) Schematic illustration of a wireless ECoG sensor (Reproduced under the terms of CC BY license [171]. Copyright 2018, MDPI AG. e) Reproduced under the terms of CC BY-NC license [144]. Copyright 2018, the authors, American Association for the Advancement of Science). (e) Top: Device schematic of the 32-channel Au/PEDOT: PSS nanomesh MEA. Bottom: Microscope image of a Au/PEDOT: PSS bilayer-nanomesh microelectrode (left) and a SEM image of a zoomed-in region of the microelectrode (right). (f) Monkey with a wireless system performing a task using pure brain control (Reproduced with permission [145]. Copyright 2014, Springer Nature). (g) first three principal components of neural activity for six different behaviors in a monkey. Principal-component analysis data were used for support vector machine classification (Reproduced with permission [145]. Copyright 2014, Springer Nature). (h) Integrated wireless, battery-free oximeters in operation mode with illuminating LEDs (Reproduced under the terms of CC BY-NC license [15]. Copyrights 2019, the authors, American Association for the Advancement of Science). (i) Photograph of an integrated sensing patch and a block diagram of the wireless readout circuit (Reproduced under the terms of CC BY license [146]. Copyright 2016, Springer Nature). (j) The platform consists of an optoelectronic stimulation and sensing (OESS) module and a low-modulus, stretchable strain gauge (SG) with integrated LEDs that wraps around the bladder to monitor changes in its volume and to provide optogenetic stimulation to the neurons that innervate the bladder (Reproduced with permission [147], Copyright 2019, Springer Nature).
Figure 9
Figure 9
Retinal prostheses. (a) Schematic illustration of a neural prosthesis system with an external camera and internal electrode arrays (Argus II System) (Reproduced under the terms of CC BY-NC-ND license []. Copyright 2016, American Academy of Ophthalmology). (b) Schematic illustration of a fully-internal neural prosthesis system (Alpha-IMS system). PD: photodetector (Reproduced with permission [179]. Copyright 2014, Oxford University Press). (c) Motivation for a 3D subretinal prosthesis. Degenerated RCS retinas exhibit near-complete loss of photoreceptors at P120, which are replaced by debris (≈ 30 μm thick), separating the inner nuclear layer (INL) from RPE. Such separation between the subretinal electrodes and target neurons in INL reduces stimulation efficacy (i). Pillar electrodes (30 µm tall) can bypass debris and more effectively deliver electric field to the target cells (ii) (Reproduced with permission [152]. Copyright 2014, IOP Publishing). (d) Fabricated liquid crystal polymer-based retinal prosthesis with three-dimensionally integrated circuit (Reproduced with permission [148]. Copyright 2015, IEEE). (e) The retinal prosthesis after one year of implantation showing well recovered ocular tissues (left) and showing no adverse effect such as retinal inflammation by optical coherence tomography (right) (Reproduced with permission [148]. Copyright 2015, IEEE). (f) The optical camera image of the phototransistor array with a truncated icosahedron design on a planar substrate. Inset shows a schematic illustration of the device structure (Reproduced under the terms of CC BY license [149]. Copyright 2017, Springer Nature). (g) Photograph of lens-shaped retinal prostheses. Four anchoring wings with holes are present for attaching the prosthesis with retinal tacks (Reproduced under the terms of CC BY license [182]. Copyright 2018, Springer Nature). (h) Representative single-sweep recording from a retinal ganglion cell over PDMS–photovoltaic interface upon 10-ms illumination at 1081.7 µW mm2. The red dotted line is the threshold set for spike detection. The green bar represents the light pulse. The blue insert shows a magnification of the period around the light pulse. The asterisk indicates the over-threshold spike detected, while the gray arrows are the on-set and off-set stimulation artifacts (Reproduced under the terms of CC BY license [182]. Copyright 2018, Springer Nature).

References

    1. Bariya M., Nyein H.Y.Y., Javey A. Wearable sweat sensors. Nat. Electron. 2018;1:160–171. doi: 10.1038/s41928-018-0043-y. - DOI
    1. Gao W., Emaminejad S., Nyein H.Y.Y., Challa S., Chen K., Peck A., Fahad H.M., Ota H., Shiraki H., Kiriya D., et al. Fully integrated wearable sensor arrays for multiplexed in situ perspiration analysis. Nature. 2016;529:509–514. doi: 10.1038/nature16521. - DOI - PMC - PubMed
    1. Park J., Kim J., Kim S.-Y., Cheong W.H., Jang J., Park Y.-G., Na K., Kim Y.-T., Heo J.H., Lee C.Y., et al. Soft, smart contact lenses with integrations of wireless circuits, glucose sensors, and displays. Sci. Adv. 2018;4:eaap9841. doi: 10.1126/sciadv.aap9841. - DOI - PMC - PubMed
    1. Li C., Cong S., Tian Z., Song Y., Yu L., Lu C., Shao Y., Li J., Zou G., Rümmeli M.H., et al. Flexible perovskite solar cell-driven photo-rechargeable lithium-ion capacitor for self-powered wearable strain sensors. Nano Energy. 2019;60:247–256. doi: 10.1016/j.nanoen.2019.03.061. - DOI
    1. Barrett P.M., Komatireddy R., Haaser S., Topol S., Sheard J., Encinas J., Fought A.J., Topol E.J. Comparison of 24-hour Holter Monitoring with 14-day Novel Adhesive Patch Electrocardiographic Monitoring. Am. J. Med. 2014;127:95. doi: 10.1016/j.amjmed.2013.10.003. - DOI - PMC - PubMed

MeSH terms

LinkOut - more resources